
First, get all the files, either as a zip archive or a gzipped tar-file and unpack them. Now, start up Matlab (version 5 or higher). Make
sure that the toolbox is in your path. This can be done simply by
cd'ing to the correct directory.
Alternatively,
if you have unpacked them into
directory /users/rich/m_map (and /users/rich/m_map/private),
then you can add this to your search path:
path(path,'/users/rich/m_map');or
addpath /users/rich/m_mapTo follow along with this document, you would then use a Web-browser to open
file:/users/rich/m_map/map.html, that
is, this HTML document.
(Note: you may want to install M_Map as a toolbox accessible to all users. To do this, unpack the files into $MATLAB/toolbox/m_map, and add that directory to the list defined in $MATLAB/toolbox/local/pathdef.m).
Instructions for installing the (optional) high-resolution bathymetry database are given in Section 9 , and instructions for installing the (optional) high-resolution GSHHS coastline database is given in Section 10 . However, we should first check that the basic setup is OK.
To see an example map, try this:
m_proj('oblique mercator');
m_coast;
m_grid;
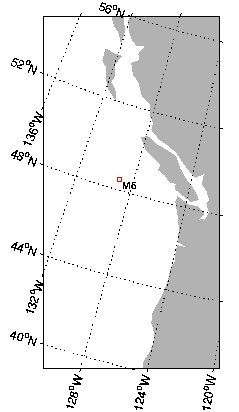
This is a line map of the Oregon/British Columbia coast, using an Oblique Mercator projection
(A few more complex maps can be generated by running the demo function m_demo).
The first line initializes the projection. Defaults are set for the different projection, so you can easily see what a specific projection looks like, but all projections have a number of optional parameters as well. To get the same map without using the defaults, you would use
m_proj('oblique mercator','longitudes',[-132 -125], ...
       'latitudes',[56 40],'direction','vertical','aspect',.5);
The exact meanings of the various options is given in Section 2 . However, notice
that longitudes are specified using a signed notation - East longitudes are positive,
whereas West longitudes are negative (Also note that a decimal degree notation is used, so that
a longitude of 120 30'W is specified as -120.5).
The second line draws a coastline, using the 1/4 degree database. Coastlines with greater
resolution can be drawn, using your own database (see also Section 7 ). m_coast
can be called with various line parameters. For example,
m_coast('linewidth',2,'color','r');
draws a thicker red coastline. Filled coastlines can also be drawn, using the 'patch'
option (followed by any of the usual PATCH property/value pairs).
m_coast('patch',[.7 .7 .7],'edgecolor','none');
draws a coastline with a gray fill and no border.
The third line superimposes a grid. Although there are many possible options that can be used to customize the appearance of the grid, defaults can always be used (as in the example). These options are discussed in Section 4 . You can get a list of the options using the GET syntax:
m_grid getwhich acts somewhat like the
get(gca) syntax for regular plots.
Finally, suppose you want to show and label the location of, say, a mooring at 129W, 48 30'N.
[X,Y]=m_ll2xy(-129,48.5);
line(X,Y,'marker','square','markersize',4,'color','r');
text(X,Y,' M5','vertical','top');
m_ll2xy (and its inverse m_xy2ll) convert from longitude/latitude coordinates to those of the
projection. Various clipping options can also be specified in converting to projection
coordinates. If you are willing to accept default clipping setting, you can
use the built-in functions m_line and m_text :
m_line(-129,48.5,'marker','square','markersize',4,'color','r');
m_text(-129,48.5,' M5','vertical','top');
Finally (!), we may want to alter the grid details slightly. Note that, a given map must only be initialized once.
clf
m_coast('patch',[.7 .7 .7],'edgecolor','none');
m_grid('xlabeldir','end','fontsize',10);
m_line(-129,48.5,'marker','square','markersize',4,'color','r');
m_text(-129,48.5,' M5','vertical','top');
In order to get a list of the current projections,
m_proj getor
m_proj('get');
Which currently return the following list:
Available projections are:
     Stereographic
     Orthographic
     Azimuthal Equal-area
     Azimuthal Equidistant
     Gnomonic
     Satellite
     Albers Equal-Area Conic
     Lambert Conformal Conic
     Mercator
     Miller Cylindrical
     Equidistant Cylindrical
     Oblique Mercator
     Transverse Mercator
     Sinusoidal
     Gall-Peters
     Hammer-Aitoff
     Mollweide
     UTM
If you want details about the possible options for any of these projections, add its name
to the above command, e.g.
m_proj('get','stereographic');
     'Stereographic'
     <,'lon<gitude>',center_long>
     <,'lat<itude>', center_lat>
     <,'rad<ius>', ( degrees | [longitude latitude] )>
     <,'rec<tbox>', ( 'on' | 'off' )>
You can also get details about the current projection. For example, in order to
see what the default parameters are for the sinusoidal projection, we first initialize it,
and then use the 'set' option:
m_proj('sinusoidal');
m_proj set
Current mapping parameters -
 Projection: Sinusoidal  (function: mp_tmerc)
 longitudes: -90  30 (centered at -30)
 latitudes: -65  65
 Rectangular border: off
In order to initialize a projection, you usually specify some location parameters that
define the geometry of the projection (longitudinal limits, central parallel, etc.), as well as parameters
that define the extent of the map (whether it is in a rectangular axis, what the border points
are, etc.). These vary slightly from projection to projection.
Two useful properties for projections are (1) the ability the preserve angles for differentially small regions, and (2) the ability to preserve area. Projections satisfying the first condition are called conformal , those satisfying the second are called equal-area . No projection can be both. Many projections (especially global projections) are neither, instead an attempt has been made to aesthetically balance the errors in both conditions.
Note: All projections (except UTM) are currently spherical rather than ellipsoidal. It is unlikely that this will be a problem in normal usage.
         <,'lon<gitude>',center_long>

<,'lat<itude>', center_lat> <,'rad<ius>', ( degrees | [longitude latitude] )> <,'rec<tbox>', ( 'on' | 'off' | 'circle' )> radius for the map, the viewpoint altitude is specified:
<,'alt<itude>', altitude_fraction > These maps are usually drawn with rectangular boundaries (with the exception of the sinusoidal and sometimes the transverse mercator).
<,'lon<gitude>',( [min max] | center)> <,'lat<itude>', ( maxlat | [min max])> <,'lon<gitude>',[ G1 G2 ]>
<,'lat<itude>', [ L1 L2 ]> 'direction' property).
<,'asp<ect>',value> <,'dir<ection>',( 'horizontal' | 'vertical' ) <,'lon<gitude>',[min max]>
<,'lat<itude>',[min max]> <,'clo<ngitude>',value> <,'rec<tbox>', ( 'on' | 'off' )> <,'zon<e>', value 1-60> <,'hem<isphere>',value 0=N,1=S> 'normal',
a spherical earth of radius 1 unit, but other options
can also be chosen using the following property:
<,'ell<ipsoid>', ellipsoid> m_proj('get','utm').
The big difference between UTM and all
the other projections is that for ellipsoids other than 'normal'
the projection coordinates are in meters of easting and
northing. To take full advantage of this it is often useful to call m_proj
with 'rectbox' set to 'on' and not to use the long/lat
grid generated by m_grid (since the regular matlab grid will be in units
of meters).
           <,'lon<gitude>',[min max]>

<,'lat<itude>',[min max]> <,'clo<ngitude>',value> <,'par<allels>',[lat1 lat2]> <,'rec<tbox>', ( 'on' | 'off' )> 'off' .
m_proj('mollweide');
m_coast('patch','r');
m_grid('xaxislocation','middle');
If you are plotting something with a large north/south extent, but not very wide (say, North and South America, or the North and South Atlantic), then the Sinusoidal or Mollweide projections will look pretty good. Another choice is the Transverse Mercator, although that is usually used only for very large-scale maps.
For smaller areas within one hemisphere or other (say, Australia, the United States, the Mediterranean, the North Atlantic) you might pick a conic projection. The differences between the two available conic projections are subtle, and if you don't know much about projections it probably won't make much difference which one you use.
If you get smaller than that, it doesn't matter a whole lot which projection you use. One projection I find useful in many cases is the Oblique Mercator, since you can align it along a long (but narrow) coastal area. If map limits along lines of longitude/latitude are OK, use a Transverse Mercator or Conic Projection. The UTM projection is also useful.
Polar areas are traditionally mapped using a Stereographic projection, since for some reason it looks nice to have a "bullseye" pattern of latitude lines.
If you want to get a quick idea of what any projection looks like, default parameters for all functions are set for a "typical" usage, i.e. to get a quick idea of what any projection looks like, you can do so without having to figure out a lot of numerical values:
m_proj('stereographic');  % Example for stereographic projection
m_coast;
m_grid;
m_scale
primitive for this - for a 1:250000 map, call
m_scale(250000);after you have drawn everything (Be careful - a 1:250000 map of the world is a lot bigger than 8.5"x11" sheet of paper).
This option is usually only useful for large-scale maps, i.e. maps of very small areas).
If you wish to know the current scale, calling m_scale without
any parameters will calculate and return that value.
To return to the default scaling call m_scale('auto').
(PS - If you do want to find distances from Bangkok to anywhere, plot an azimuthal equidistant projection of the world centered on Bangkok (13 44'N, 100 30'E), and choose a fairly small scale, like 1:200,000,000). Another option would be to use range rings, see example 11.
M_Map includes two fairly simple databases for coastlines and global elevation data. Highly-detailed databases are not included in this release because they are a) extremely large and b) extremely time-consuming to process (loops are inherently involved). If more detailed maps are required, section 9 and section 10 give instructions on how to add some freely-available high-resolution datasets. Read section 7 and section 8 if you want to add your own coastline/bathymetry data.
M_Map includes a 1/4 degree resolution coastline database. This is suitable for maps
covering large portions of the globe, but is noticeably coarse for many large-scale
applications. Users not satisfied with their regional map are directed to
section 7 and/or section 10
for more information on creating and using high-resolution
coastlines.
The M_Map database is accessed using the m_coast function. Coastlines
can be drawn as simple lines, using
m_coast('line', ...optional line arguments );
or
m_coast( optional line arguments );where the optional arguments are all the standard arguments for specifying line style, width, color, etc. Coastlines can also be drawn as filled patches using
m_coast('patch', ...optional patch arguments );
where the optional trailing arguments are the standard patch properties. For example,
m_coast('patch',[.7 .7 .7],'edgecolor','g');
draws gray land, outlined in green.
When patches are being drawn, lakes and inland seas are given the axes background colour.
Note that line coastlines are usually drawn rather rapidly. Filled coastlines take considerably more time to generate (because map limits are not necessarily rectangular, clipping must be accomplished in m-files).
M_Map can access a 1-degree resolution global elevation database (actually, this database is
is included in the Matlab distribution, used by of $MATLAB/toolbox/matlab/demos/earthmap.m).
A contour map of elevations at default levels can be drawn using
m_elev;Different levels can also be specified:
m_elev('contour',LEVELS, optional contour arguments);
For example, if you want all the contours to be dark blue, use:
m_elev('contour',LEVELS,'edgecolor','b');
Filled contours are also possible:
m_elev('contourf',LEVELS, optional contourf arguments);
Finally, if you want to simply extract the elevation data for your own purposes,
[Z,LONG,LAT]=m_elev([LONG_MIN LONG_MAX LAT_MIN LAT_MAX]);returns rectangular matrices for depths Z at locations LONG,LAT.
m_proj('Lambert');
m_coast;
m_grid;
to get a Lambert conic projection of North America. Now try
m_ungridThe coastline is still there, but the grid has disappeared and the axes shows raw X/Y projection coordinates. Now, try this:
m_grid('xtick',10,'tickdir','out','yaxislocation','right','fontsize',7);
The various options that can be changed are:
'box',( 'on' | 'off' | 'fancy' ) 'on', the default, is a a simple line. Two
types of fancy outline boxes are available. If 'tickdir' is 'in',
then alternating black and white patches are made (see example 2).
If 'tickdir' is set to 'out', then a more complex line pattern
is drawn (see example 6).
Fancy boxes are in general only available for maps bounded
by lat/long limits (i.e. not for azimuthal projections), but if this option is
chosen inappropriately a warning message is issued.
'xtick',( num | [value1 value2 ...]) 'ytick' property.
'xticklabels',[label1;label2 ...] 'yticklabels' property
'xlabeldir', ( 'middle' | 'end' ) 'ylabeldir' property.
'ticklen',value 'tickdir',( 'in' | 'out' ) 'box' is
set to 'fancy', this specifies the form of the fancy outline box.
     'color',colorspec

      'linewidth', value

  'linestyle', ( linespec | 'none' )

   'fontsize',value

'fontname',name 'XaxisLocation',( 'bottom' | 'middle' | 'top' ) 'YaxisLocation',( 'left' | 'middle' | 'right' ) title and
x/ylabel functions in the usual way (this is a change from v1.0 in which
the 'visible' property had
to be explicitly set to 'on'; this is now done within m_grid).
The purpose of this package is to allow you to map your own data! Once a suitable grid and (possibly) a coastline have been chosen, you can add your own lines, text, or contour plots using built-in M_Map drawing functions which handle the conversion from longitude/latitude coordinates to projection coordinates. These drawing functions are very similar to the standard Matlab plotting functions, and are described in the next section.
Sometimes you may want to convert between longitude/latitude and projection coordinates
without immediately plotting the data. This might happen if you want to interactively
select points using ginput, or if you want to draw labels tied to a
specific point on the screen rather than a particular longitude/latitude. Projection
conversion routines are described in sections 5.2 and
5.3. Once raw longitude/latitude coordinates are converted into
projection coordinates, standard Matlab plotting functions can be used.
Maps are drawn to fit within the boundaries of the plot axes. Thus their scale
is somewhat arbitrary. If you are interested in making a map to a given
scale, e.g. 1:200000 or something like that, you can do so by using the
m_scale primitive, see section 2.6 .
The data units are the projection coordinates, which are distances expressed
as a fraction of earth radii. To get a map "distance" between two points,
use the Cartesian distance between the points in the projection coordinate
system and multiply by your favourite value for the earth's radius, usually
around 6370 km (exception - the UTM projection uses coordinates of northing and
easting in meters, so no conversion is necessary).
Caution: One problem that sometimes occurs is that data does not appear on the plot due to ambiguities in longitude values. For example, if plot longitude limits are [-180 180], a point with a longitude of, say, 200, may not appear in cylindrical and conic projections. This is not a bug. Handling the clipping in "wrapped around" curves requires adding points (rather than just moving them) and is therefore incompatible with various other requirements (such as keeping input and output matrices the same size in the conversion routines described below).
 line, text, quiver, patch,
contour, and contourf
with M_Map equivalents that recognize
lontgitude/latitude coordinates by prepending "m_" to the function name. For example,
m_line(LONG,LAT,...line properties)   % draw a line on a map
m_quiver(LONG,LAT,U,V,S)              % A quiver plot
m_text(LONG,LAT,'string')             % Text
m_patch(LONG,LAT,..patch properties)  % Patches.
Each of these functions will handle the coordinate conversion internally, and will return a vector of handles to the graphic objects if desired. The only difference between these functions and the standard Matlab functions is that the first two arguments MUST be longitude and latitude.
One caveat applies to m_patch. For compatibility reasons this uses the
same code that applies to coastline filling. Coastlines come either as either "islands"
or "lakes", and M_Map keeps track of the difference by assuming curves are oriented so that
the filled area ("land") is always on the right as we go around the curve. This is
slightly different than the convention used in patch which always fills
the inside. Keeping track of this difference is relatively straightforward in a Cartesian
system, but not so easy in spherical coordinates. In the absence of other information
m_patch tries to do the right thing, but (especially when the patch
intersects a map boundary) it can get confused. If a patch isn't filling correctly,
try reversing the order of points using flipud or fliplr.
Data gridded in longitude and latitude can also be contoured:
m_contour(LONG,LAT,VALUES)
m_contourf(LONG,LAT,VALUES)
Again, these functions will return handles to graphics objects, allowing (for example) the drawing of labelled contours:
[cs,h]=m_contour(LONG,LAT,VALUES)
clabel(cs,h,'fontsize',6);
Fancy arrows (i.e. with width, head shape, and colour specifications) can be generated using
m_vec.m . See the on-line help for more details about the use of m_vec.
m_track.
m_proj('UTM','long',[-72 -68],'lat',[40 44]);
m_gshhs_i('color','k');
m_grid('box','fancy','tickdir','out');

% fake up a trackline
lons=[-71:.1:-67];
lats=60*cos((lons+115)*pi/180);
dates=datenum(1997,10,23,15,1:41,zeros(1,41));

m_track(lons,lats,dates,'ticks',0,'times',4,'dates',8,...
        'clip','off','color','r','orient','upright');

m_track, and
the different options for setting fontsize, tick spacing, date formats, etc.
While fiddling with the various parameters, it is often handy to be able to erase the plotted tracks without erasing the coastline and grid. This can be done using
m_ungrid trackor
m_ungrid('track')
m_range_ring,
which has 3 required calling parameters: LONG, LAT, RANGE, followed by any number of
(optional) line specification property/value pairs. Example 11
illustrates how to use m_range_ring.
[X,Y]=m_ll2xy(LONG,LAT, ...optional clipping arguments )where LONG, LAT, X, and Y are matrices of the same size. Projection coordinates are equal to true distances near the center of the map, and are expressed as fractions of an earth radius. To get a distance, multiply by the radius of the earth (about 6370km). The exception is the UTM projection which provides coordinates of northing and easting in meters.
The possible clipping arguments are
'clip','on' 'clip','off' 'clip','point' 'clip','patch' [LONG,LAT]=m_xy2ll(X,Y)There are no options.
For ideas on how to make more complex plots, see the Examples.
These plots are also included in the function m_demo.
Once a given map includes several elements a certain amount of fiddling is usually necessary
to satisfy the natural human urge to give the image a certain aesthetic quality. If the image
includes complicated coastlines which take a long time to draw
(e.g. those discussed below) than clearing the figure and
redrawing soon becomes tedious. The m_ungrid command introduced above can be used
to selectively remove parts of the figure. For example:
m_proj('lambert','long',[-160 -40],'lat',[30 80]);
m_coast;
m_range_ring(-123,49,[1e3:1e3:10e3],'color','r');
draws range rings at 1000km increments from my office. But I am unsatisfied with this, and want
to redraw using only 200km increments. I can remove the effects of m_range_ring
and redraw using:
m_ungrid range_ring
m_range_ring(-123,49,[200:200:2000],'color','r');
In general the results of
m_ANYTHING can be deleted by calling
m_ungrid ANYTHING.
m_ungrid can recognize and delete specific elements by searching
the 'tag' property of all plot elements, which is set by the various
different M_Map routines.
If you are interested in a particular area and want a higher-resolution coastline than
that used by m_coast, the best procedure is to
m_ll2xy, and plot.
load coast.dat
m_line(coast(:,1),coast(:,2));
Filled coastlines will require more work. You should first read the instructions there on joining the coastline data into continuous segments. If you are lucky, (i.e. no lakes or anything else), you may achieve success with
load coast.dat
[X,Y]=m_ll2xy(coast(:,1),coast(:,2),'clip','patch');
k=[find(isnan(X(:,1)))];
for i=1:length(k)-1,
    x=coast([k(i)+1:(k(i+1)-1) k(i)+1],1);
    y=coast([k(i)+1:(k(i+1)-1) k(i)+1],2);
    patch(x,y,'r');
end;
If this does not work, read the comments in private/mu_coast, orient the curves
in the desired fashion, and use m_usercoast to load your own data.
Files containing political boundaries for various countries and US states can be
downloaded from
http://www.maproom.psu.edu/cgi-bin/ian/points/index.cgi. Once downloaded
to your machine use
m_plotbndry to access and plot the desired boundary. For example,
if you downloaded various US states into a subdirectory "states:,
m_plotbndry('states/arizona','color,'r')
would plot arizona on the current map.
A number of global and regional topography databases are available at NCAR . Several are available for free from their ftp site.
As long as the data is stored in a mat-file as a rectangular matrix in longitude/latitude,
then m_contour or m_contourf can be used to plot
that data.
A recent new bathymetry with approximately 1km resolution in lower latitude areas is being used by many people. This dataset is described at http://topex.ucsd.edu/marine_topo/text/topo.html and is available as a 134Mb binary file at ftp://topex.ucsd.edu/pub/global_topo_2min/topo_6.2.img . The authors have included an m-file (mygrid_sand.m) which can extract portions of the data. Once this database (and the m-file) is installed on your computer, you can use it in M_Map very easily. A typical usage is as follows:
% Extract data
[elevations,lat,lon]=mygrid_sand([lat_south lat_north long_west long_east]);

% Use in M_Map command
m_contour(lon,lat,elevations);
For some projections, you must make sure that the 'lon' values returned by
mygrid_sand.m fall within the range used in this projection
(i.e. you may have to add/subtract 360). This seems to happen all the time
for areas in the west (i.e. negative longitudes), if you forget this
you often end up with bewildering error messages about empty vectors!
For many purposes the elevation database accessed by M_Map provides adequate resolution. However, there are also many cases when more detail is desired. I have not included a higher-resolution database because it would greatly increase the size of the package. However, v1.2 includes m-files to access and plot a popular global 5-minute bathymetry/topography database, after a few minutes of work.
This section provides instructions on how to download
TerrainBase, and convert
it from a 56Mb ASCII file to a 18Mb binary file using m_tba2b.m. It
is then straightforward to access and plot bathymetry from this file using
m_tbase.m, which is in every way functionally identical to
m_elev (see Section 3.2).
TerrainBase is also available on CDrom, and is also
commonly stored in netcdf (or other) binary format somewhere on many academic networks. If
you modify m_tbase.m to access data from one of these
sources, let me know!
How to install TerrainBase:
m_tba2b('PATHNAME') to store the resulting 18Mb binary
file as PATHNAME/tbase.int.
tbase.
PATHNAME setting in m_tbase to
point to the location of this file.
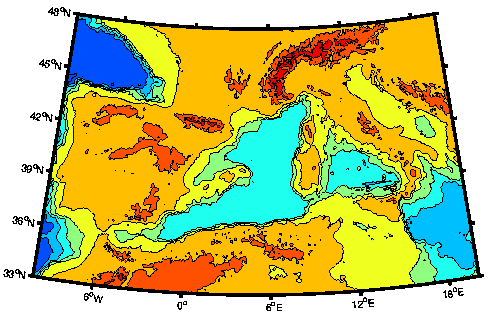
m_proj('lambert','lon',[-10 20],'lat',[33 48]);
m_tbase('contourf');
m_grid('linestyle','none','tickdir','out','linewidth',3);
When drawing maps there is always a tradeoff between the execution time of the generating program and the resolution of the resulting map. Included in M_Map is a 1/4 degree coastline database which can be used to generate very fast maps, with adequate resolution for many purposes.
However, it is often desirable to be able to make detailed maps of limited geographic areas. For this purpose a higher-resolution coastline database is necessary. I have not included such a database in M_Map because it would greatly increase the size of the package. However, I have included m-files to access and use a popular high-resolution database called GSHHS
As distributed, GSHHS consists of a hierarchical set of databases at different resolutions. The lowest or "crude" resolution is not as good as the M_Map database, although it contains many more inland lakes. The "high" resolution consists of points about 200m apart. There is also an even finer "full" resolution. You can install part or all of the database (depending on how much disk space you have available). The "full" resolution occupies 90Mb of disk space, and successively coarser resolutions are smaller by about 1/4. Thus "high" resolution occupies 21Mb, "intermediate" uses 6Mb, and "low" uses 1.1Mb (one reason for not always using "high" resolution is that the entire 90Mb database must be read and processed each call, which may take some time).
How to install GSHHS:
 gshhs_c.b.gz,
 gshhs_l.b.gz, gshhs_i.b.gz
and/or gshhs_h.b.gz
in a
convenient directory. One useful place is in m_map/private.
m_map/private ,
you must edit the FILNAME settings in m_gshhs_c.m,
m_gshhs_l.m, m_gshhs_i.m, m_gshhs_h.m and/or m_gshhs_f.m
to point to the appropriate files.
m_coast
( Section 3 ). For example, to draw a gray-filled
high-resolution coastline,
m_gshhs_h('patch',[.5 .5 .5]);
is sufficient. However, execution times may be very, very long, as the entire
database must be searched and processed. I would not recommend trying to draw world
maps with the intermediate or high-resolution coastlines!
There are two ways to speed this up.
The first is merely to use a lower-resolution database, with fewer points.
The second is useful if
you are going to be repeatedly drawing
a map (because, for example, it's the base figure for your work). In
this case I recommend
that you save an intermediate processed (generally smaller) file as follows:
m_proj ...  % set up projection parameters

% This command does not draw anything - it merely processes the
% high-resolution database using the current projection parameters
% to generate a smaller coastline file called "gumby"

m_gshhs_h('save','gumby');

% Now we can draw a few maps of the same area much more quickly

figure(1);
m_usercoast('gumby','patch','r');
m_grid;

figure(2);
m_usercoast('gumby','linewidth',2,'color','b');
m_grid('tickdir','out','yaxisloc','left');

etc.
m_coast.mat
is sometimes not found when using m_coast.m. The easiest
solution is to put ../m_map/private into your path as
well as ../m_map (in later versions matlab can find the mat-file).
> Warning: Divide by zero.messages. This is due to a bug in Matlab (actually due to the compiler TMW used) that results in an incorrect warning flag being set when dividing some numbers by NaN. You can safely ignore these errors and wait for v5.2
print command.
In order to avoid this, set the figure background to white, i.e.
set(gcf,'color','white')
However, if you print the figure, the resulting postscript file (or plot) will show the colours as expected. This appears to be a bug of some sort in Matlab.
If you want to see the colours in Matlab itself, try this:
set(findobj('tag','m_grid_color'),'facecolor','none')