August 21, 2018

High Moisture, High Clouds, and an MCS to the Northeast

Today was another quiet day in transit to 13N, 135E. Isolated convective cells that were present at the end 20 August (local time is 8 hours ahead) quickly dissipated after sunrise. Figure 1 is a radar display of echoes at 0.8 deg at 0000 UTC. Figure 2 and Figure 3 are illustrative of the cloud cover around 0500 UTC. Many altocumulus, altostratus, and cirrus clouds were accompanied by scattered non-precipitating cumuli. By the 0600 UTC rawinsonde launch, skies were gray and overcast. Figure 4 shows the sounding for 0600 UTC. Over 65 mm of precipitable water was present in the column. The temperature profile was very near a moist adiabat from about 925 to 800 hPa. Some drier air and a small temperature inversion were present between 400 and 500 hPa. Winds below 400 hPa were westerly at 20 kts or less, and strong easterlies were present above 200 hPa. These features appeared to be present in all soundings on 21 August. Despite over 2800 J/kg CAPE (???/!!!) in the 12 UTC sounding, few convective elements were able to grow vertically within range (120 km for volume scans) of SEAPOL.

Occasional short-lived shallow convective cells were observed by SEAPOL during the day as cloud cover gradually decreased. Surveillance scans were started every 10 minutes at 0900 UTC and revealed a line of convection to the northeast at a range of about 200 km. The surveillance scan from 1240 UTC is depicted by Figure 5. The convective line was also clearly seen in IR imagery (Figure 6). Clouds from this convective line were probably advected to the west-southwest during the day by winds in the upper troposphere documented by the sounding. As the ship headed east-southeastward, a growing stratiform region to the southwest of the convective line moved within range of SEAPOL. RHI scans (e.g. Figure 7) revealed a rather unremarkable trailing stratiform region with a brightband near 5 km and a large anvil cloud extending toward the radar at about 7 km altitude. Automated hydrometeor ID (Figure 8) indicated that the anvil was made primarily of aggregated ice, and "wet snow" was present near the brightband. The MCS persisted to the northeast of the radar domain for several hours.


Figure 1: 0.8 deg sweep of PPI at 0000 UTC on 21 August. Back to text.


Figure 2: High cirrus were present around 0500 UTC, or 1PM local time. Back to text.


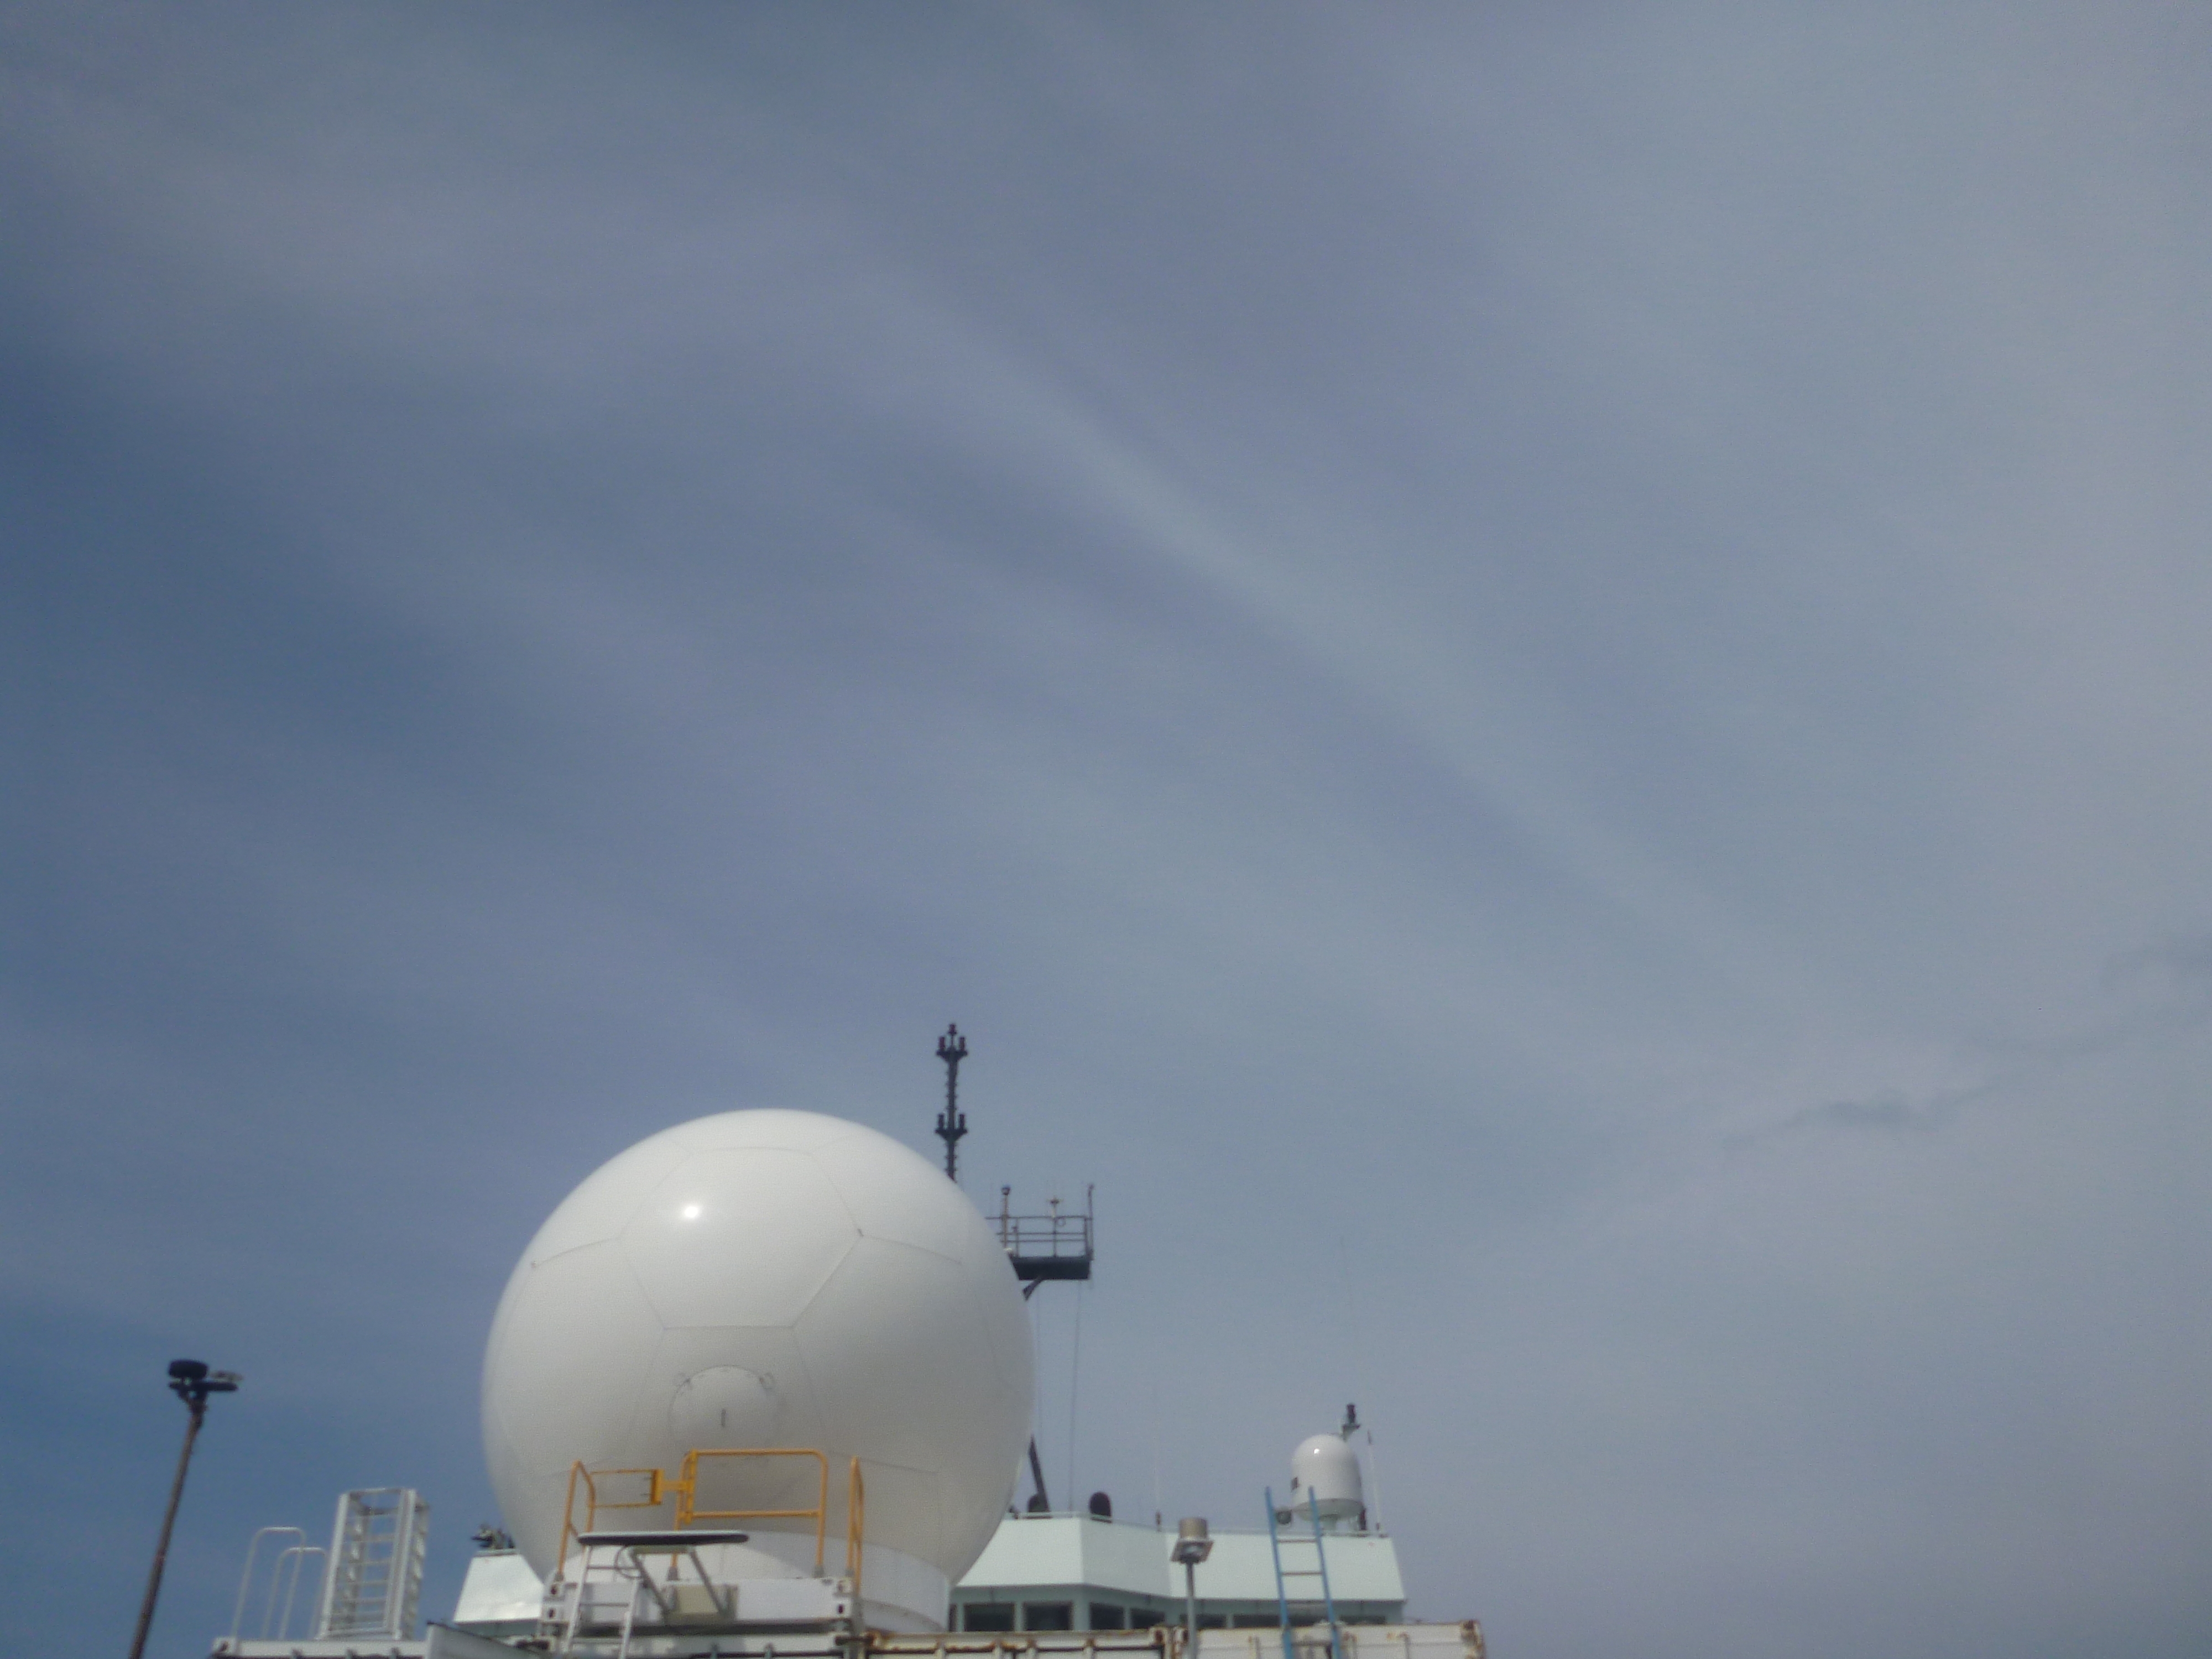
Figure 3: Altostratus, altocumulus, and some shallow non-precipitating boundary layer cumuli were widespread. Back to text.


Figure 4: Rawinsonde from 0600 UTC, 21 August. Back to text.


Figure 5: Surveillance scan at 0.8 deg from 1240 UTC. Back to text.


Figure 6: Himiwari-8 IR imagery at 1330 UTC. At the time, the ship was near 16.25N, 128.65E. Back to text.


Figure 7: RHI cross-section through southwestern edge of stratiform region. Back to text.


Figure 8: HID corresponding to Figure 7. Back to text.