August 23, 2018
Scattered Convection and More Decaying Stratiform
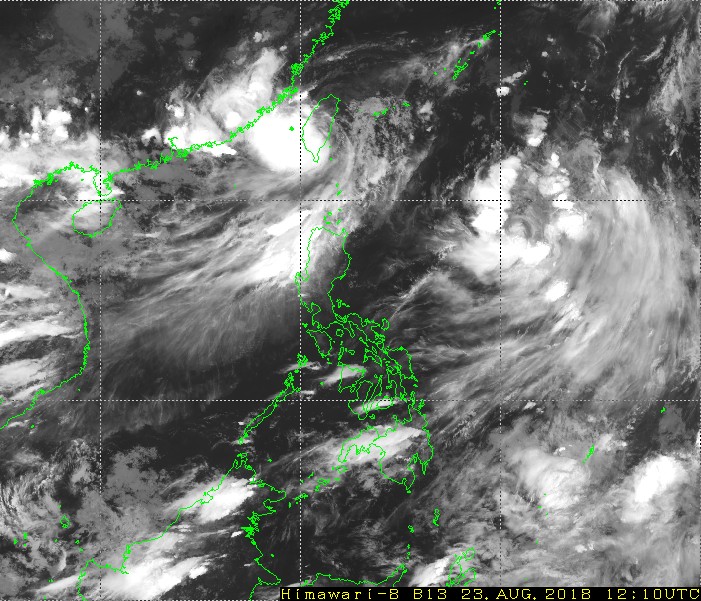
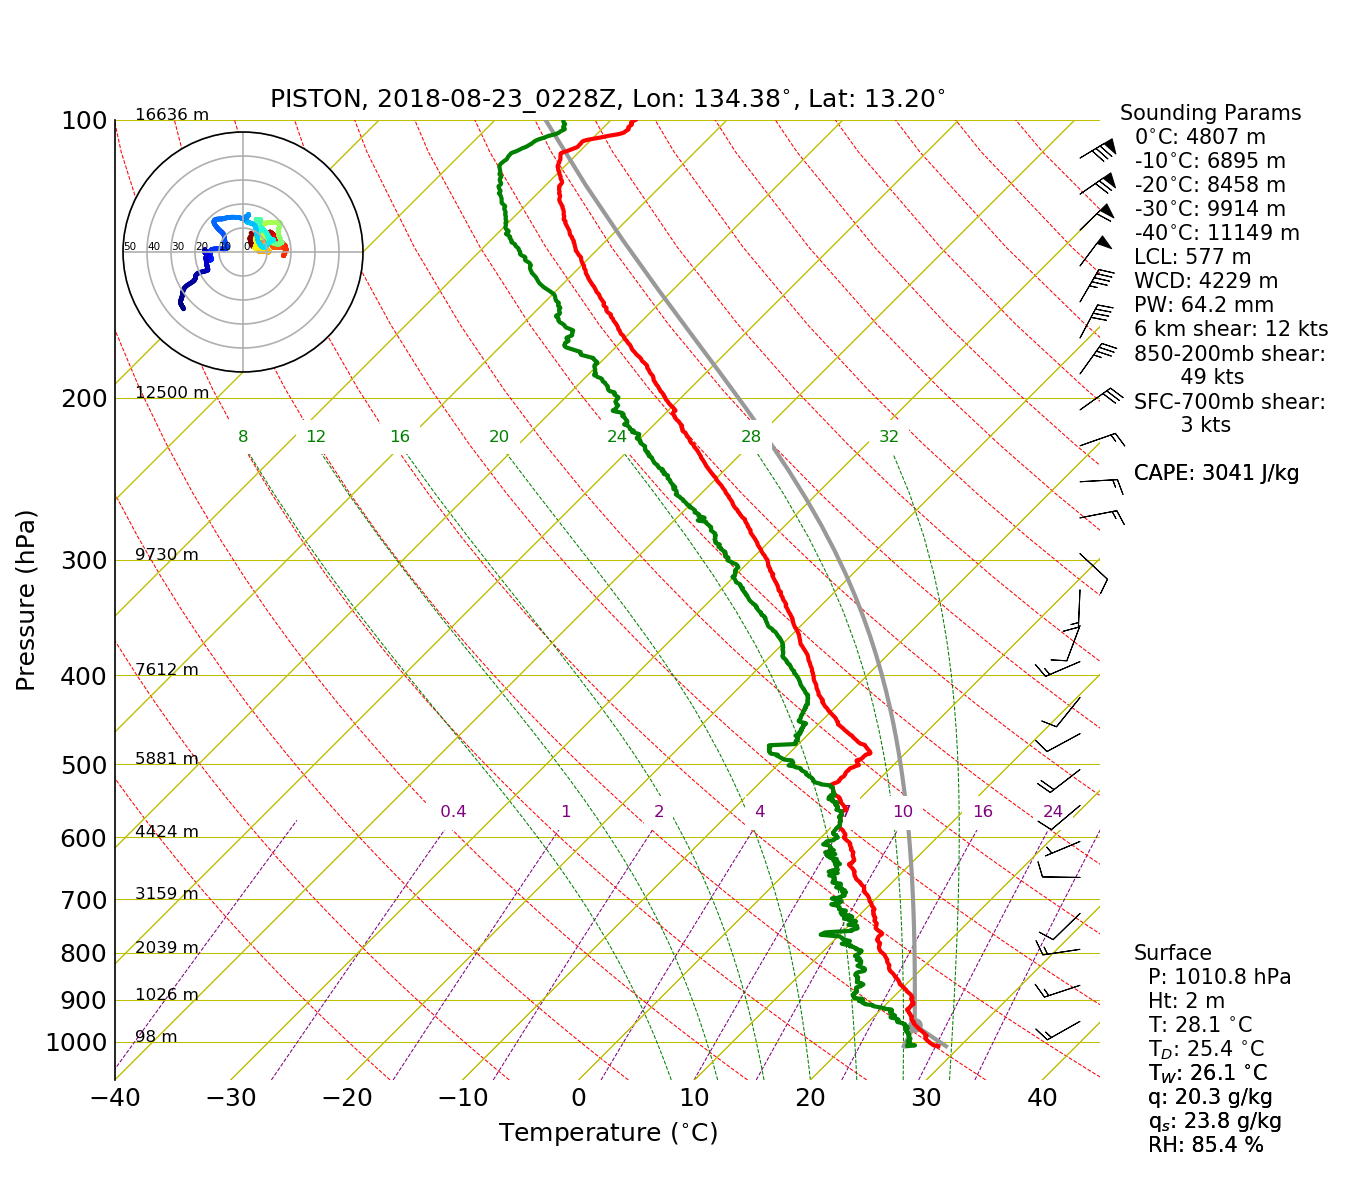
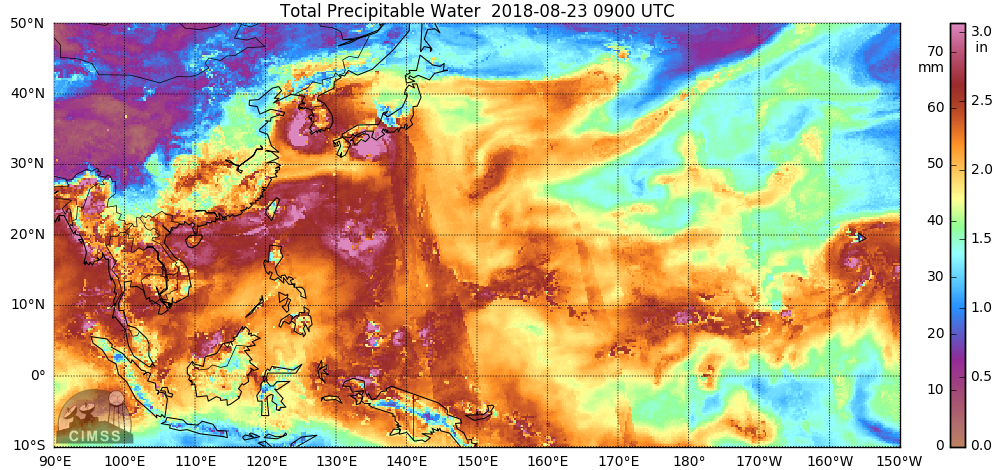
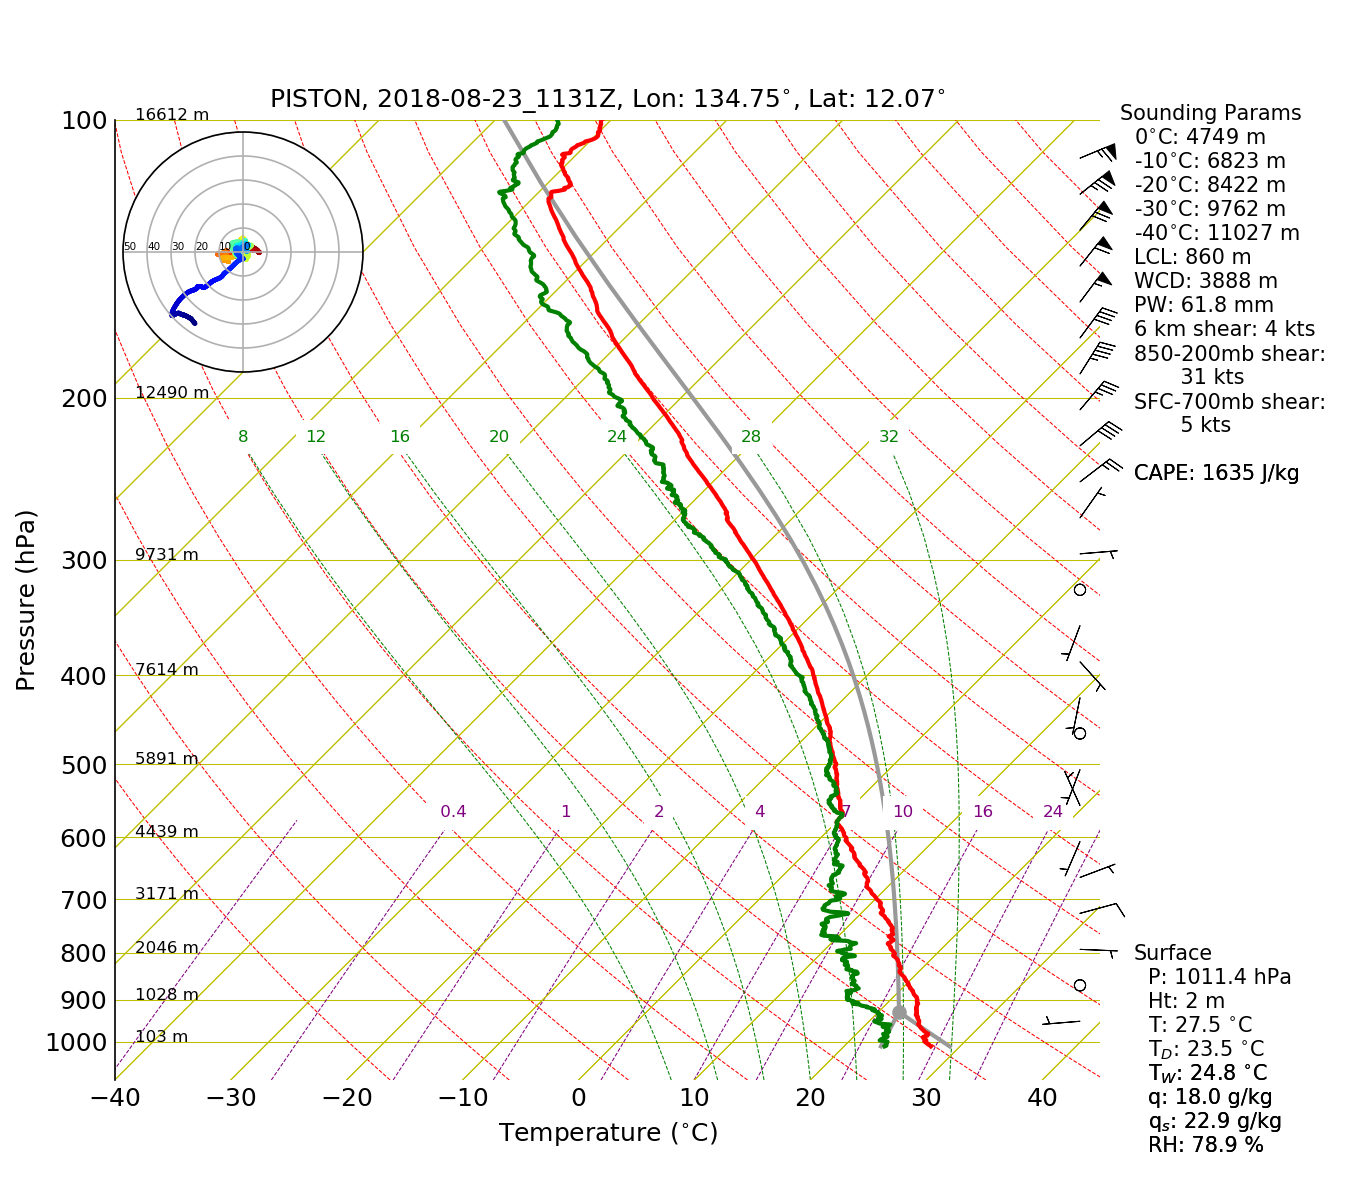
The ship slowly transited southward from about 13N to 11N along 134.75E today. Scattered convection was observed, particularly during local daytime hours and early evening. Then the convection again decayed into stratiform and mostly dissipated by the early morning hours (late Aug. 23 in UTC time). Figure 1 shows infrared imagery from 1210 UTC. The ship's location was beneath a large area of mid-to-high level clouds feeding into an area of higher vorticity to the north. The 03 UTC sounding (Figure 2) indicated a still very moist atmosphere with 64 mm of precipitable water, although some subsidence (temperature inversion and dry air slot) was observed near 500 mb. The high TPW was also indicated in large-scale analysis of precipitable water (Figure 3), although a northward extending slot of drier air was present over Indonesia and the Philippines. To start the day, widespread altostratus and altocumulus clouds were visible from the surface, and some shallow cumuli were present closer to the ocean. Figure 4 is a representative photo of sky conditions during the morning. The mid-level clouds persisted throughout the day and evening and appeared to be fed persistently by short-lived pulse convection. In fact, the 12 UTC sounding (Figure 5) indicated a nearly saturated layer between 500 and 600 mb. However, even the mid-level cloud almost almost completely dissipated by 18 UTC.
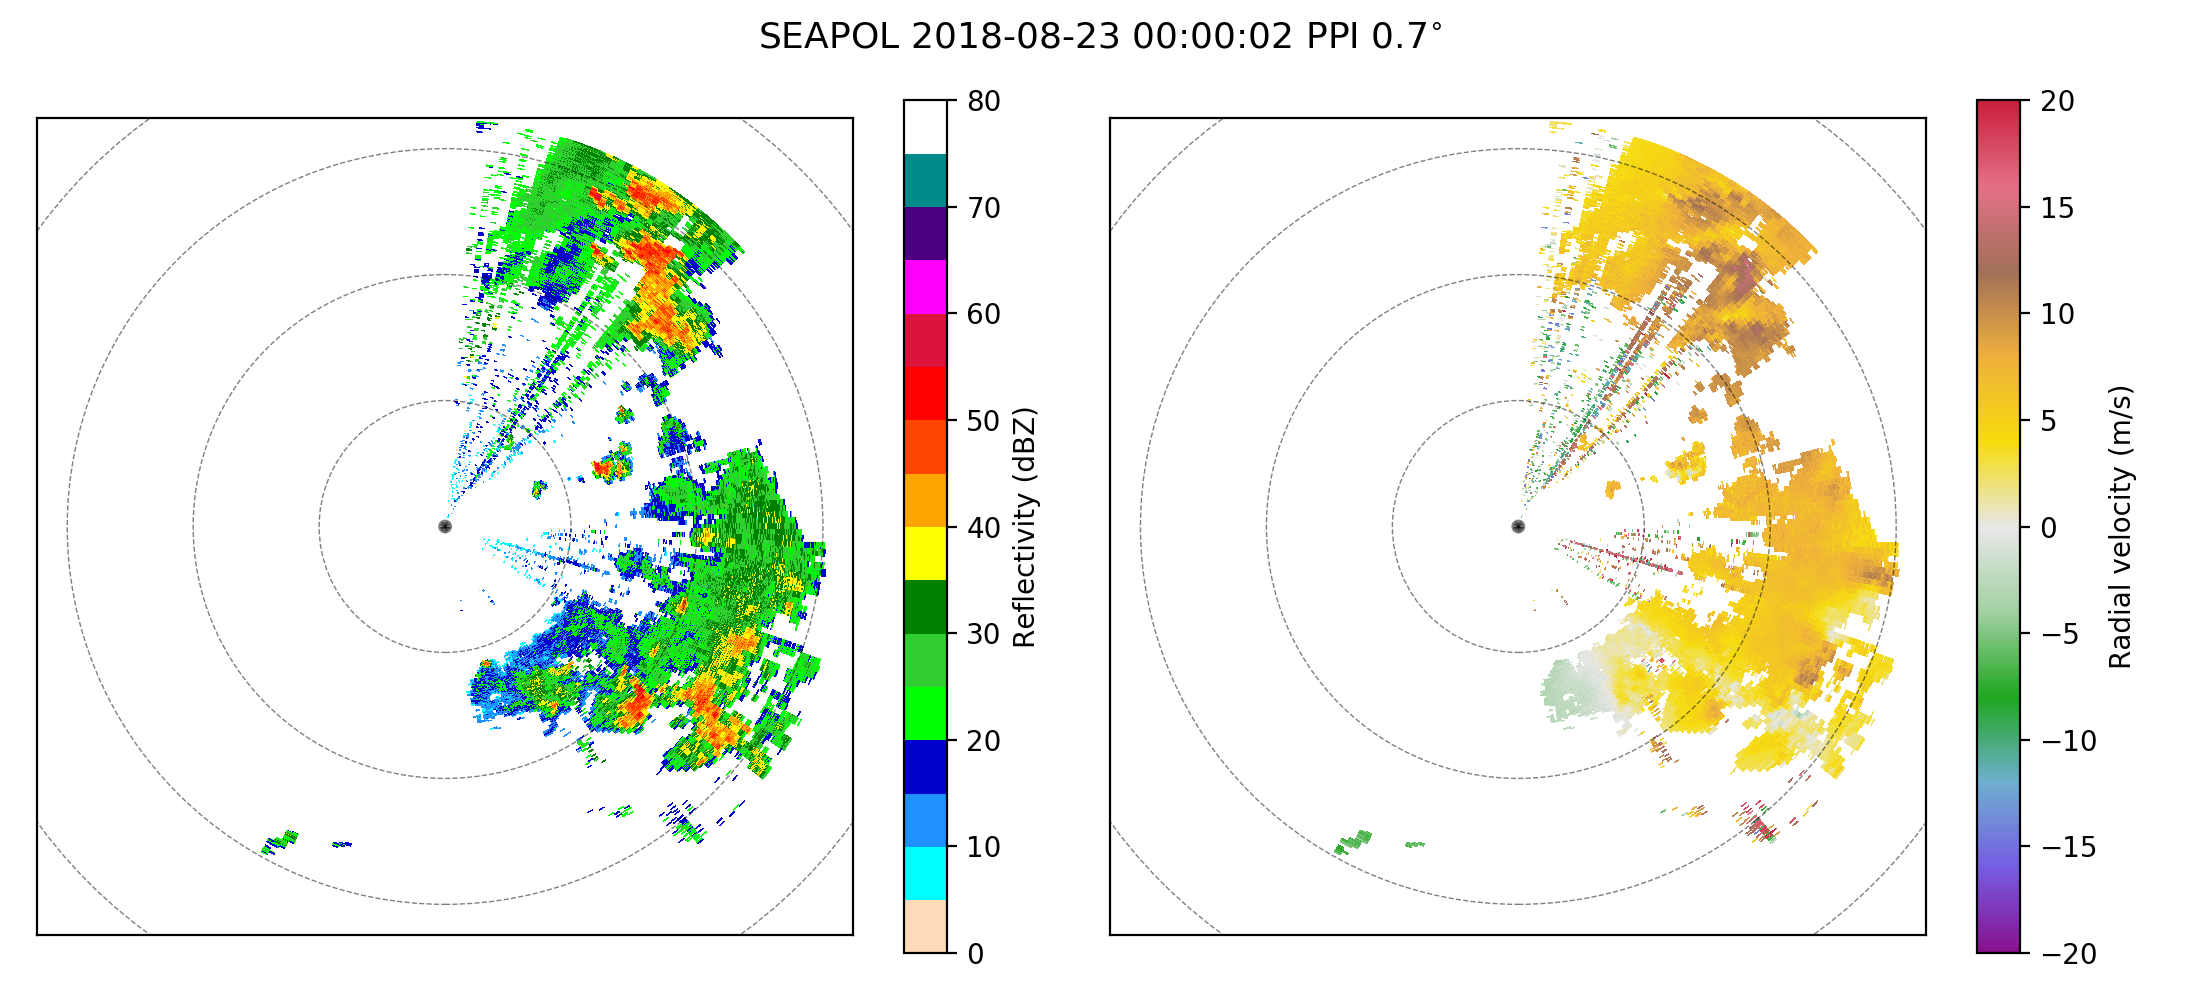
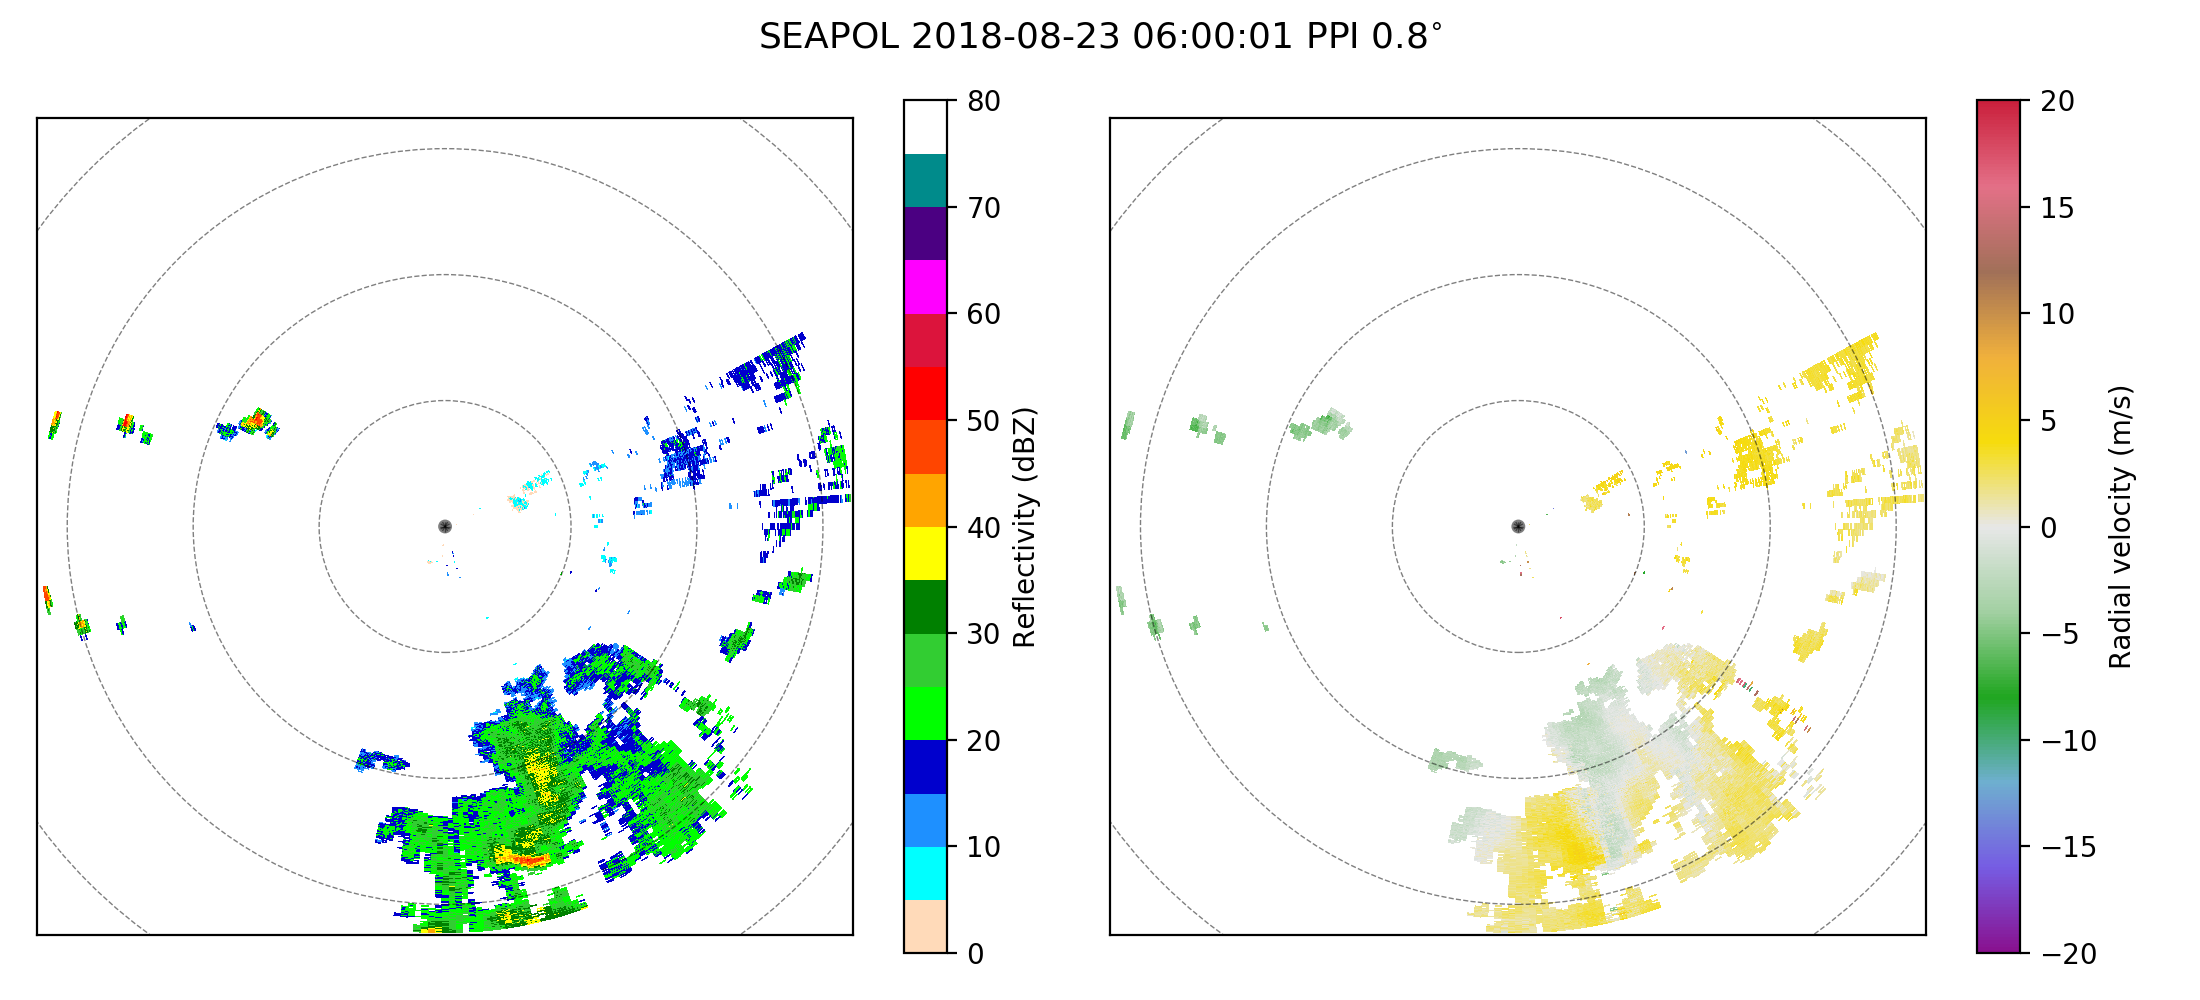
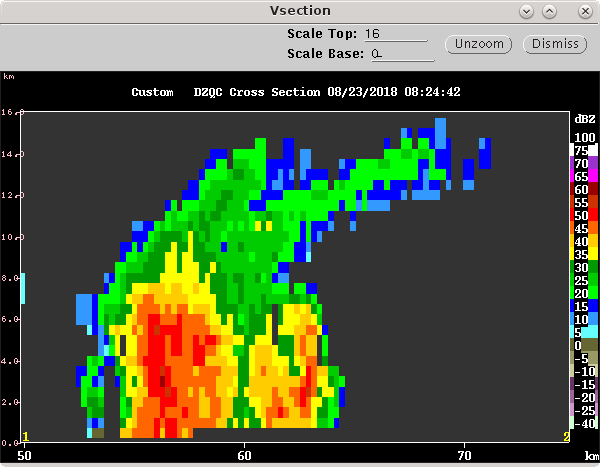
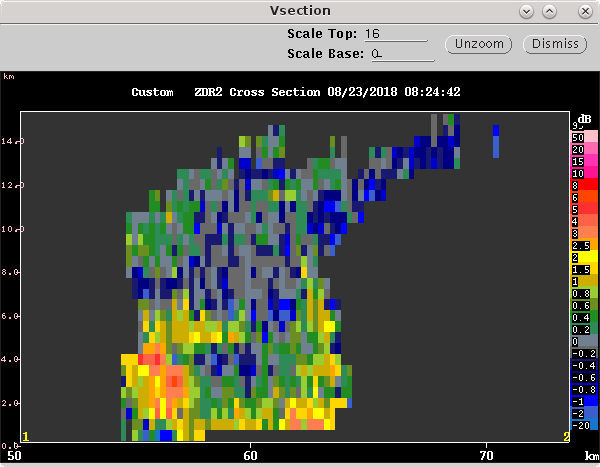
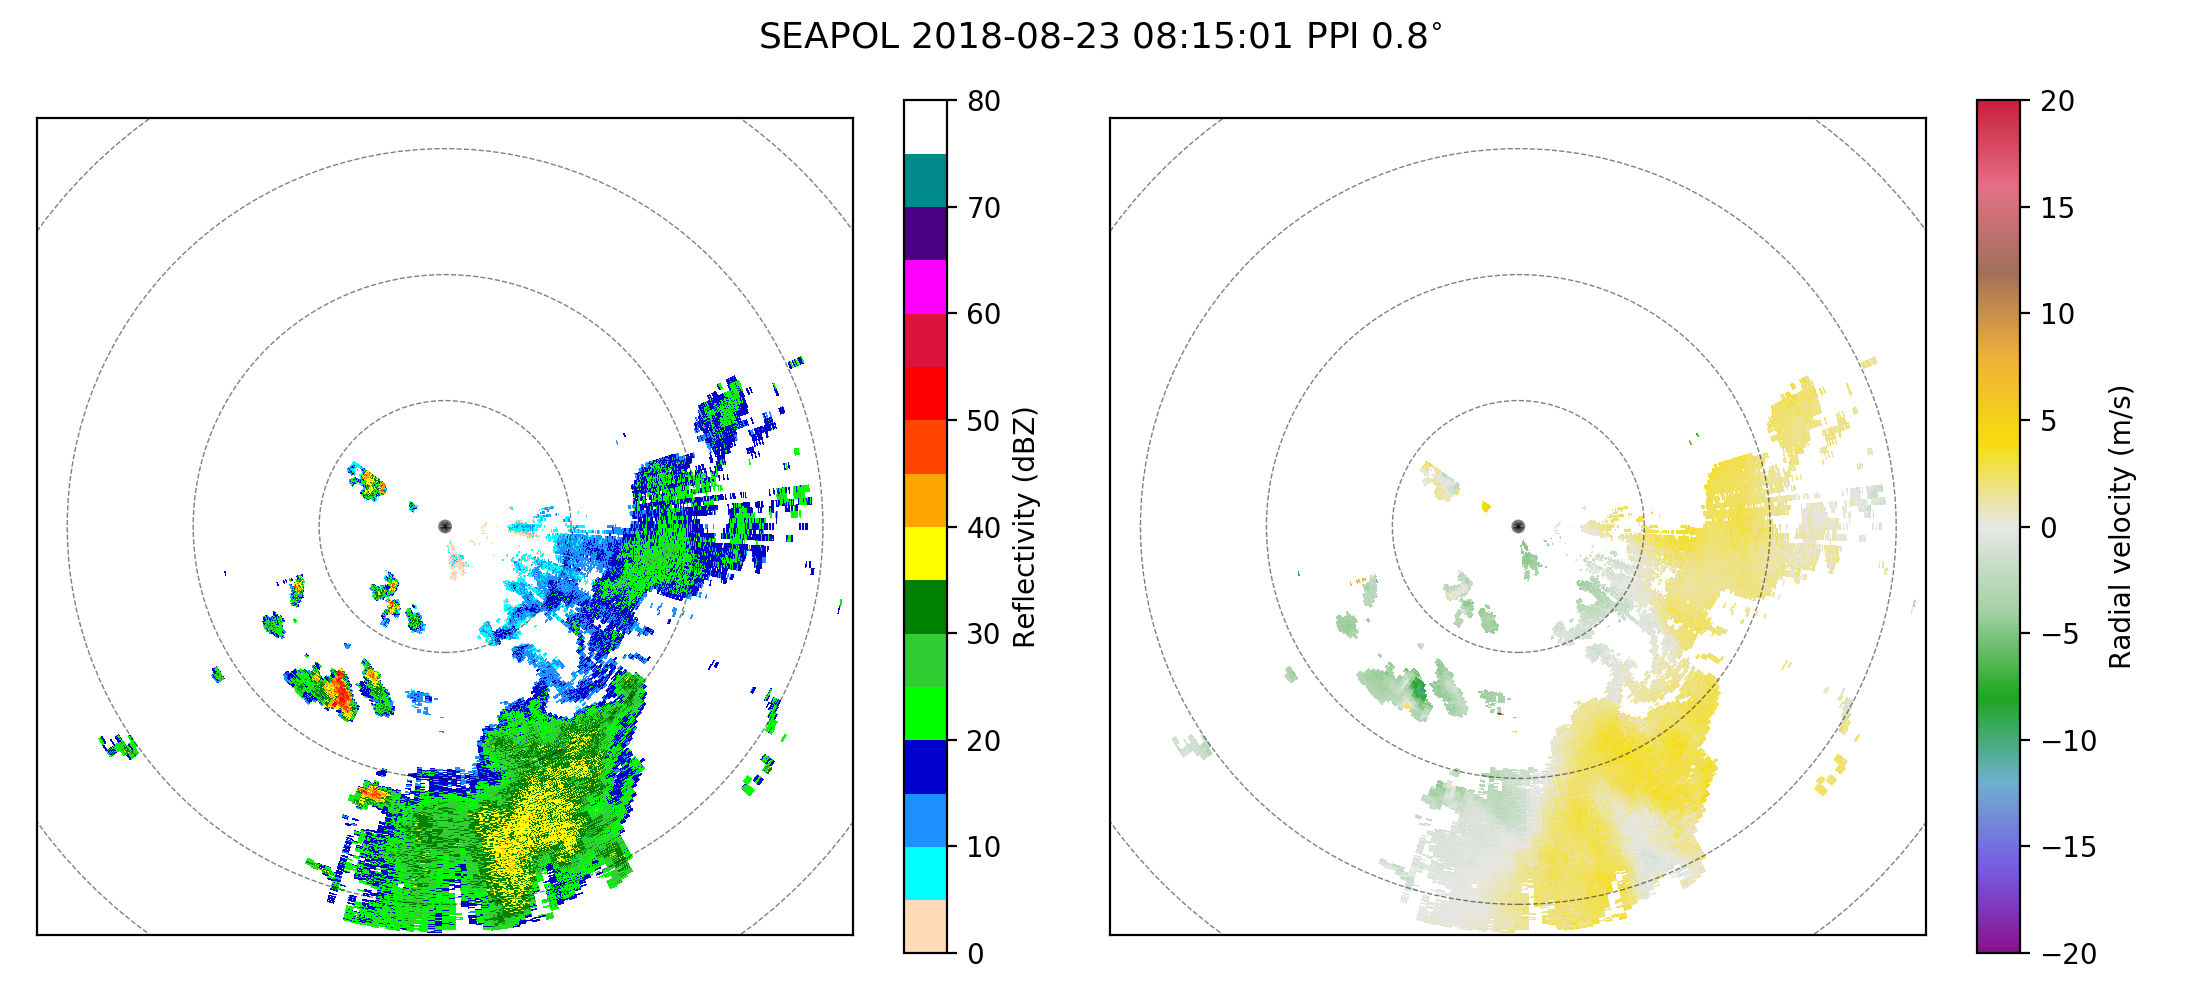
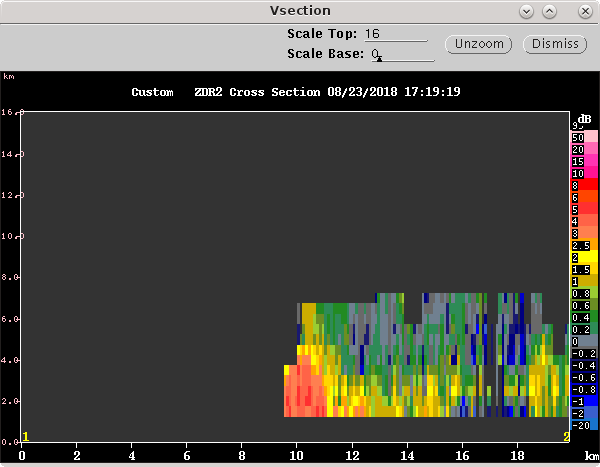
Scattered convection of various depth was detected by SEAPOL throughout the day. Low-level scans at 00, 06, 12, and 16 UTC are shown in Figure 6. While convection was not particularly active, a few interesting features were noted. For example, Figure 7 depicts cross-sections of one convective echo observed near 0824 UTC that extended upward to near 16 km. The echo is the most intense echo seen southwest of SEAPOL in Figure 8. Reflectivity in this echo reached over 50 dBZ above the surface, and two areas of high ZDR were detected within the cell. KDP just below the brightband exceeded 3 deg/km. The cell also exhibited an split upper portion, consistent with two updrafts existing simultaneously. Scans from the prior hour (not shown) suggested that the cell may have consisted of several short-lived updrafts as the entire small complex moved northeastward. Another intense, shallow cell appeared around 1700 UTC in the far western portion of the domain. A cross-section of it is displayed in Figure 9. ZDR in this small cell, which at the time, appeared to be barely more than 5-6 km deep had a ~2 km wide swath of ZDR in excess of 3 dB as high as 4 km. Such shallow cells with high ZDR are not the norm, but they do seem to appear frequently.
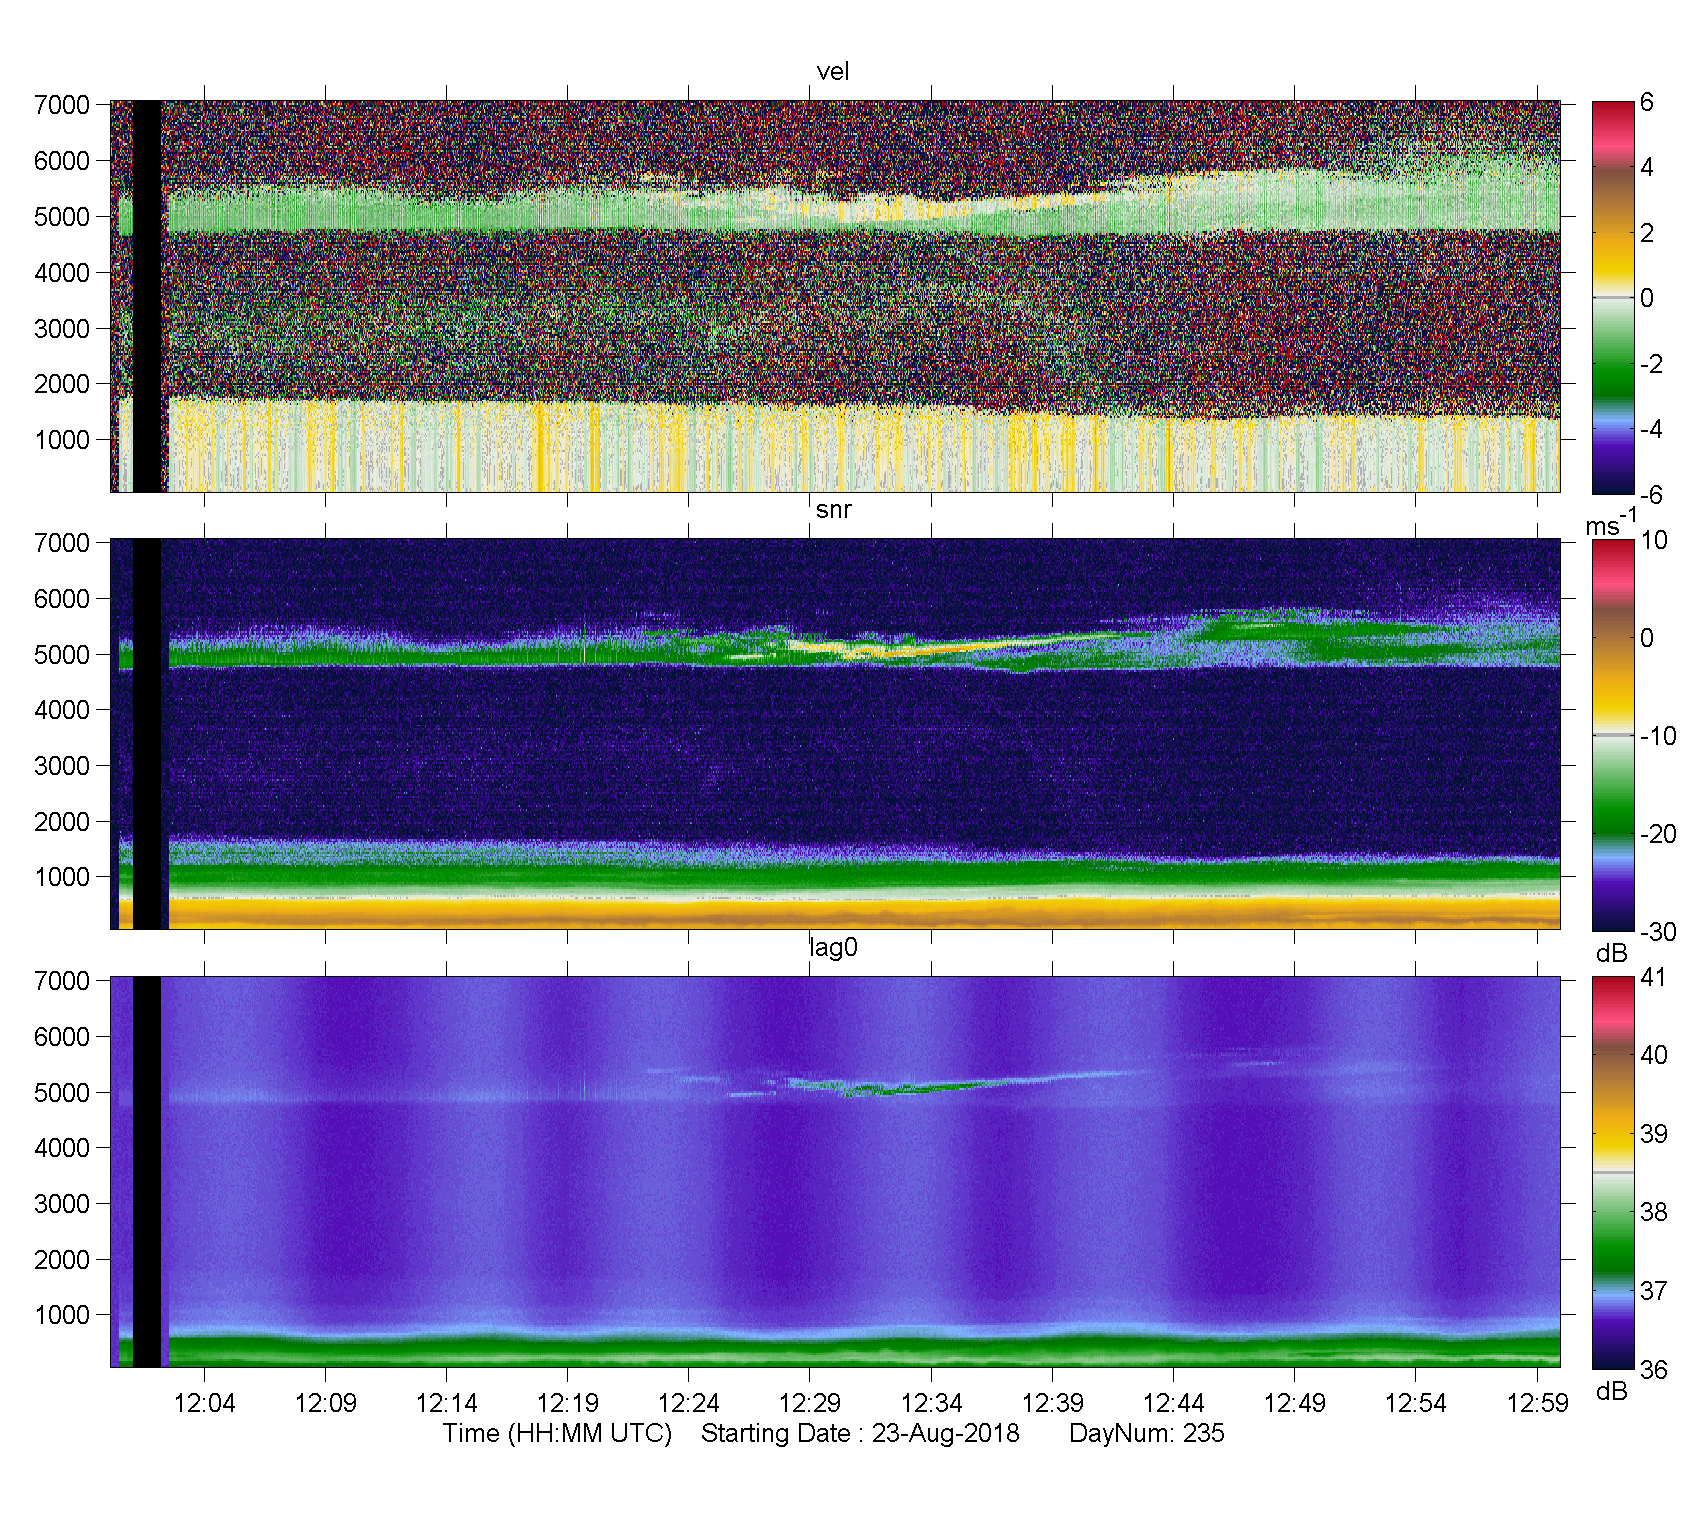
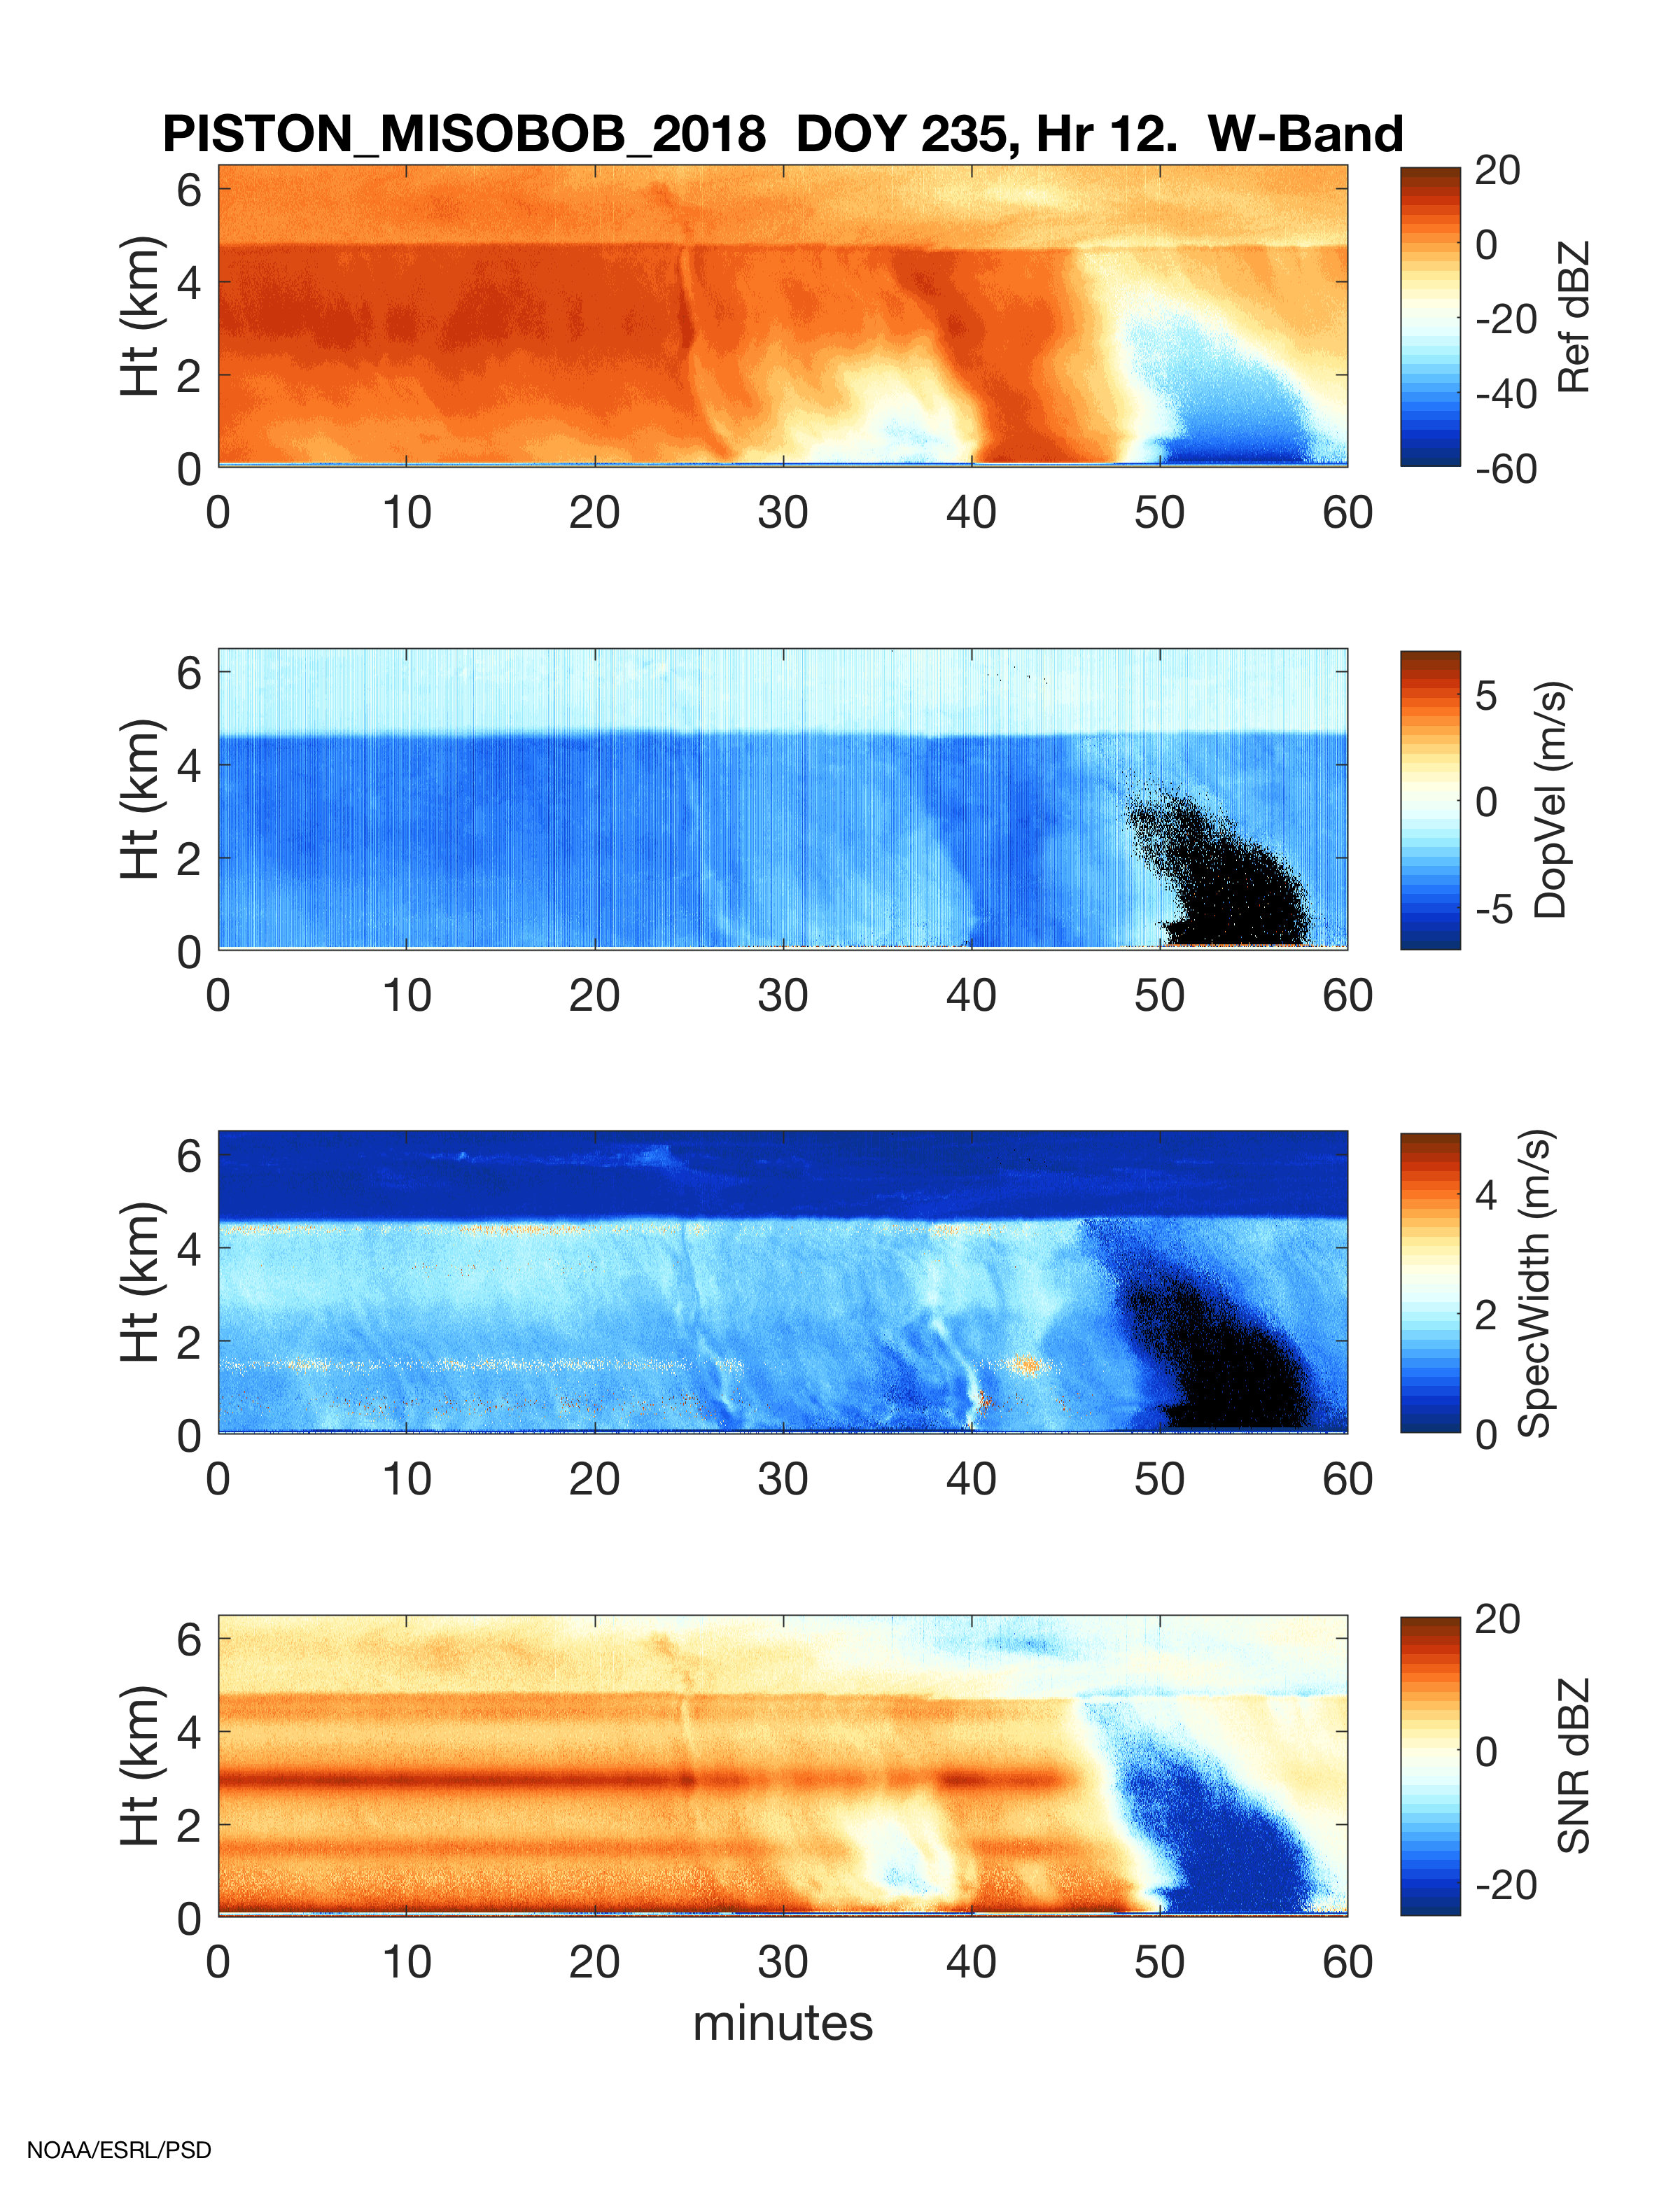
Finally, vertically pointing instruments effectively captured the light stratiform rainfall that occurred near the radar--particularly between 09 and 13 UTC. Figures 10 and 11 show, respectively, hour long time series of data up to 6 km from the NOAA Doppler lidar and W-band zenith pointing cloud radar. The Doppler lidar beam penetrated the light rainfall and virga over the ship, but the beam was quickly attenuated by ice at the radar brightband level near 5 km. W-band measurements showed a great amount of detail. One slightly heavier rain shaft passed over the ship around 0840 UTC and lasted a few minutes. Several small rain drops occurred on the deck at that time. W-band reflectivity was as high as ~10 dBZ, and Doppler velocities appeared to be downward at about 2-3 m/s (although the color scale is difficult to interpret).
SEAPOL was turned off for a few hours after 15 UTC as a precaution since convective activity was limited and the ship was nearing the Palau EEZ. The radar was turned back on around 21 UTC, but observed little convection for the remainder of Aug. 23.