August 22, 2018
Overcast Skies, Scattered Convection, and a Cold Pool
A few instances of stratiform precipitation with embedded convection were observed today. Figure 5 is an RHI cross-section of such a region at 0154 UTC. In this example, differences in the microphysical structure of younger convection at about 100 km and 110 km range compared to more mature convection closer to the radar were observed. Differential reflectivity in excess of 2 dB was observed in the cell near 100 km out. In this example, remnant cirrus associated with decaying stratiform was located between 20-40 km from the radar, and such signatures were seen throughout the radar domain for much of the day. Figure 6 illustrates an example of deep convection that was observed to the NE of SEAPOL at 0224 UTC. The convective core reached at least 15 km high and had a large stratiform region extending to its southwest. The corresponding hydrometeor ID (HID) is illustrated by Figure 7. Interestingly, the HID algorithm depicts some hail in the convective core between 5 and 8 km altitude. This seems unlikely in the Tropics; however, if the extremely large CAPE values in the 06 UTC sounding are correct, then perhaps updraft velocities were large enough to support small hail. That said, try explaining the difference between high density graupel and small hail! Another example of deep convection with graupel indicated at high altitudes occurred around 0810 UTC and is depicted in Figure 8.
The echoes seen in Figure 8 were part of a line of convection that passed just to the south of SEAPOL around 0845 UTC (photo of the convective line and nonprecipitating convection close to the radar in Figure 9). At the time, convective cells extended along a line from just south of the radar south-southwestward to about 75 km away from the radar. Some of the most intense echoes briefly reached 17 km. A stratiform area of precipitation would grow to the west of the convective cells located between 50-75 km out, as seen in a later PPIs (Figure 10 shows scans at 4.1 deg elevation from 0747 to 1047 UTC). During the time that the convective line passed just south of SEAPOL, the high spectral resolution lidar (HSRL) detected low non-precipitating cloud (Figure 11). Aerosol backscatter was reduced in the boundary layer for a few minutes after passage of the convective line, and a drop in temperature at the ship was also observed (Figure 12), indicating that the feature was probably a cold pool. The vertically pointing NOAA W-band cloud radar briefly detected an echo with upward, then downward, Doppler velocities (Figure 13), and a 50% increase in surface heat flux was estimated (Figure 14). The mixed layer was also more isothermal in the 12 UTC sounding than in the 06 and 18 UTC soundings, and so the reported CAPE at 12 UTC was lower. If indeed, the CAPE values exceeding 3000 J/kg at 06 and 18 UTC are correct, then they are quite remarkable.

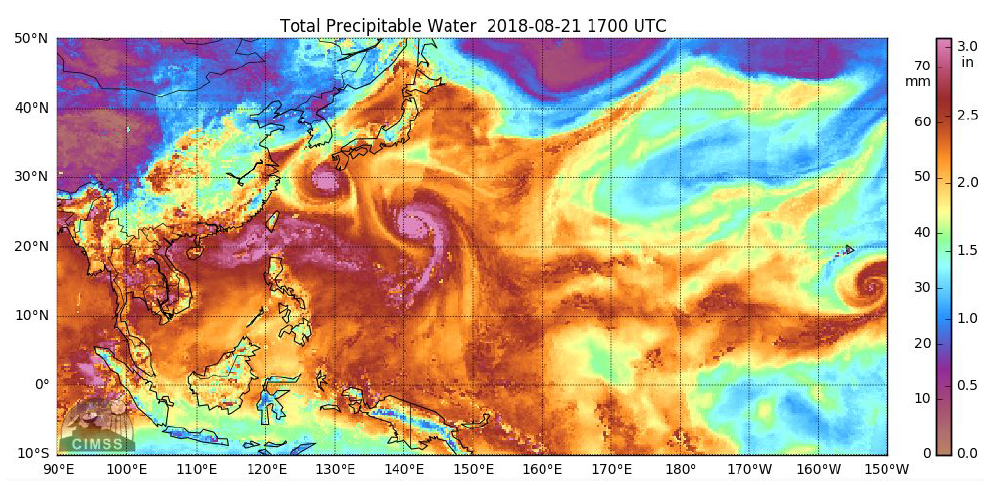
Figure 3: Total precipitable water over the West Pacific and surrounding regions at 1700 UTC on 21 August.Back to text.


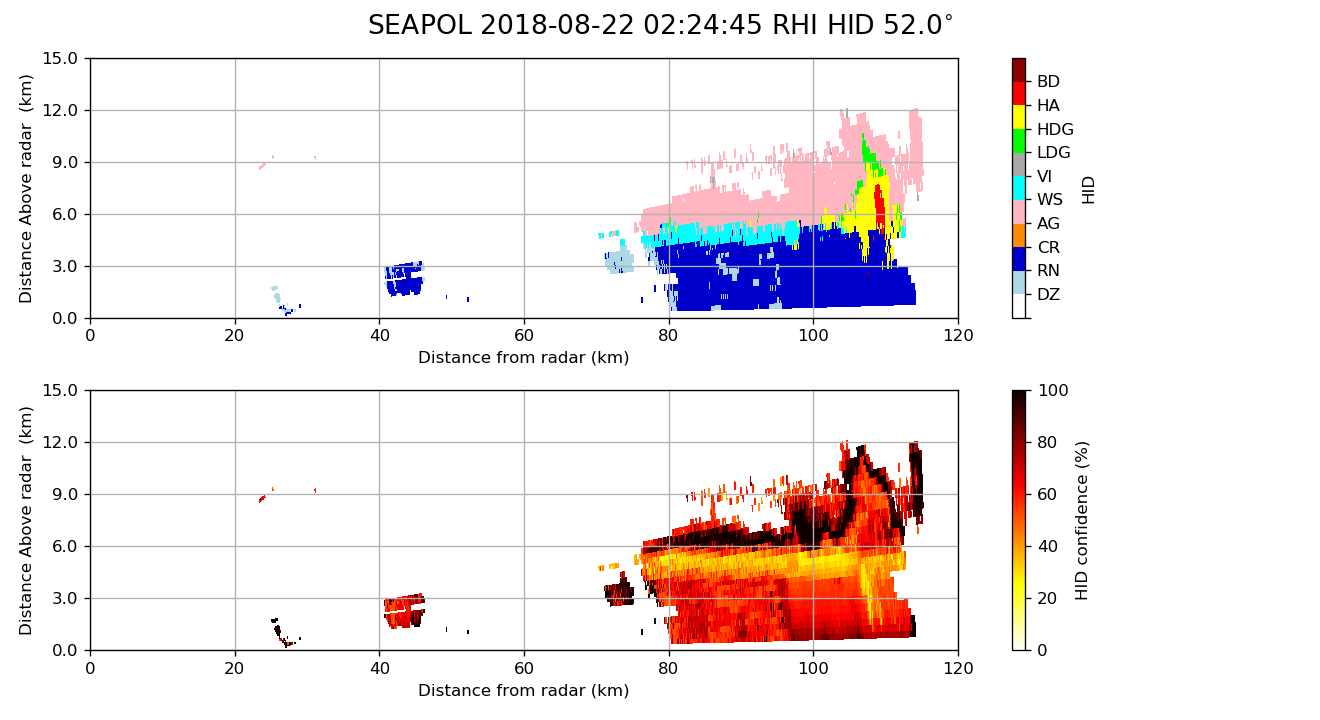

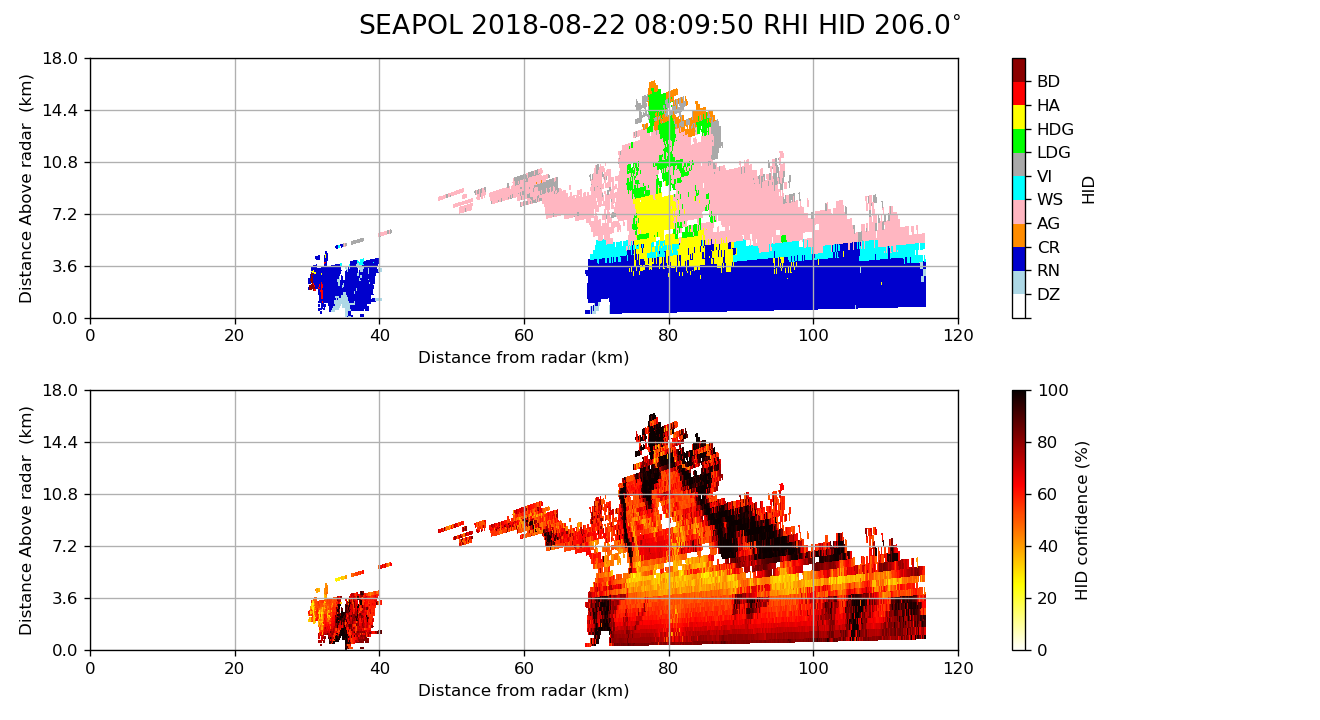
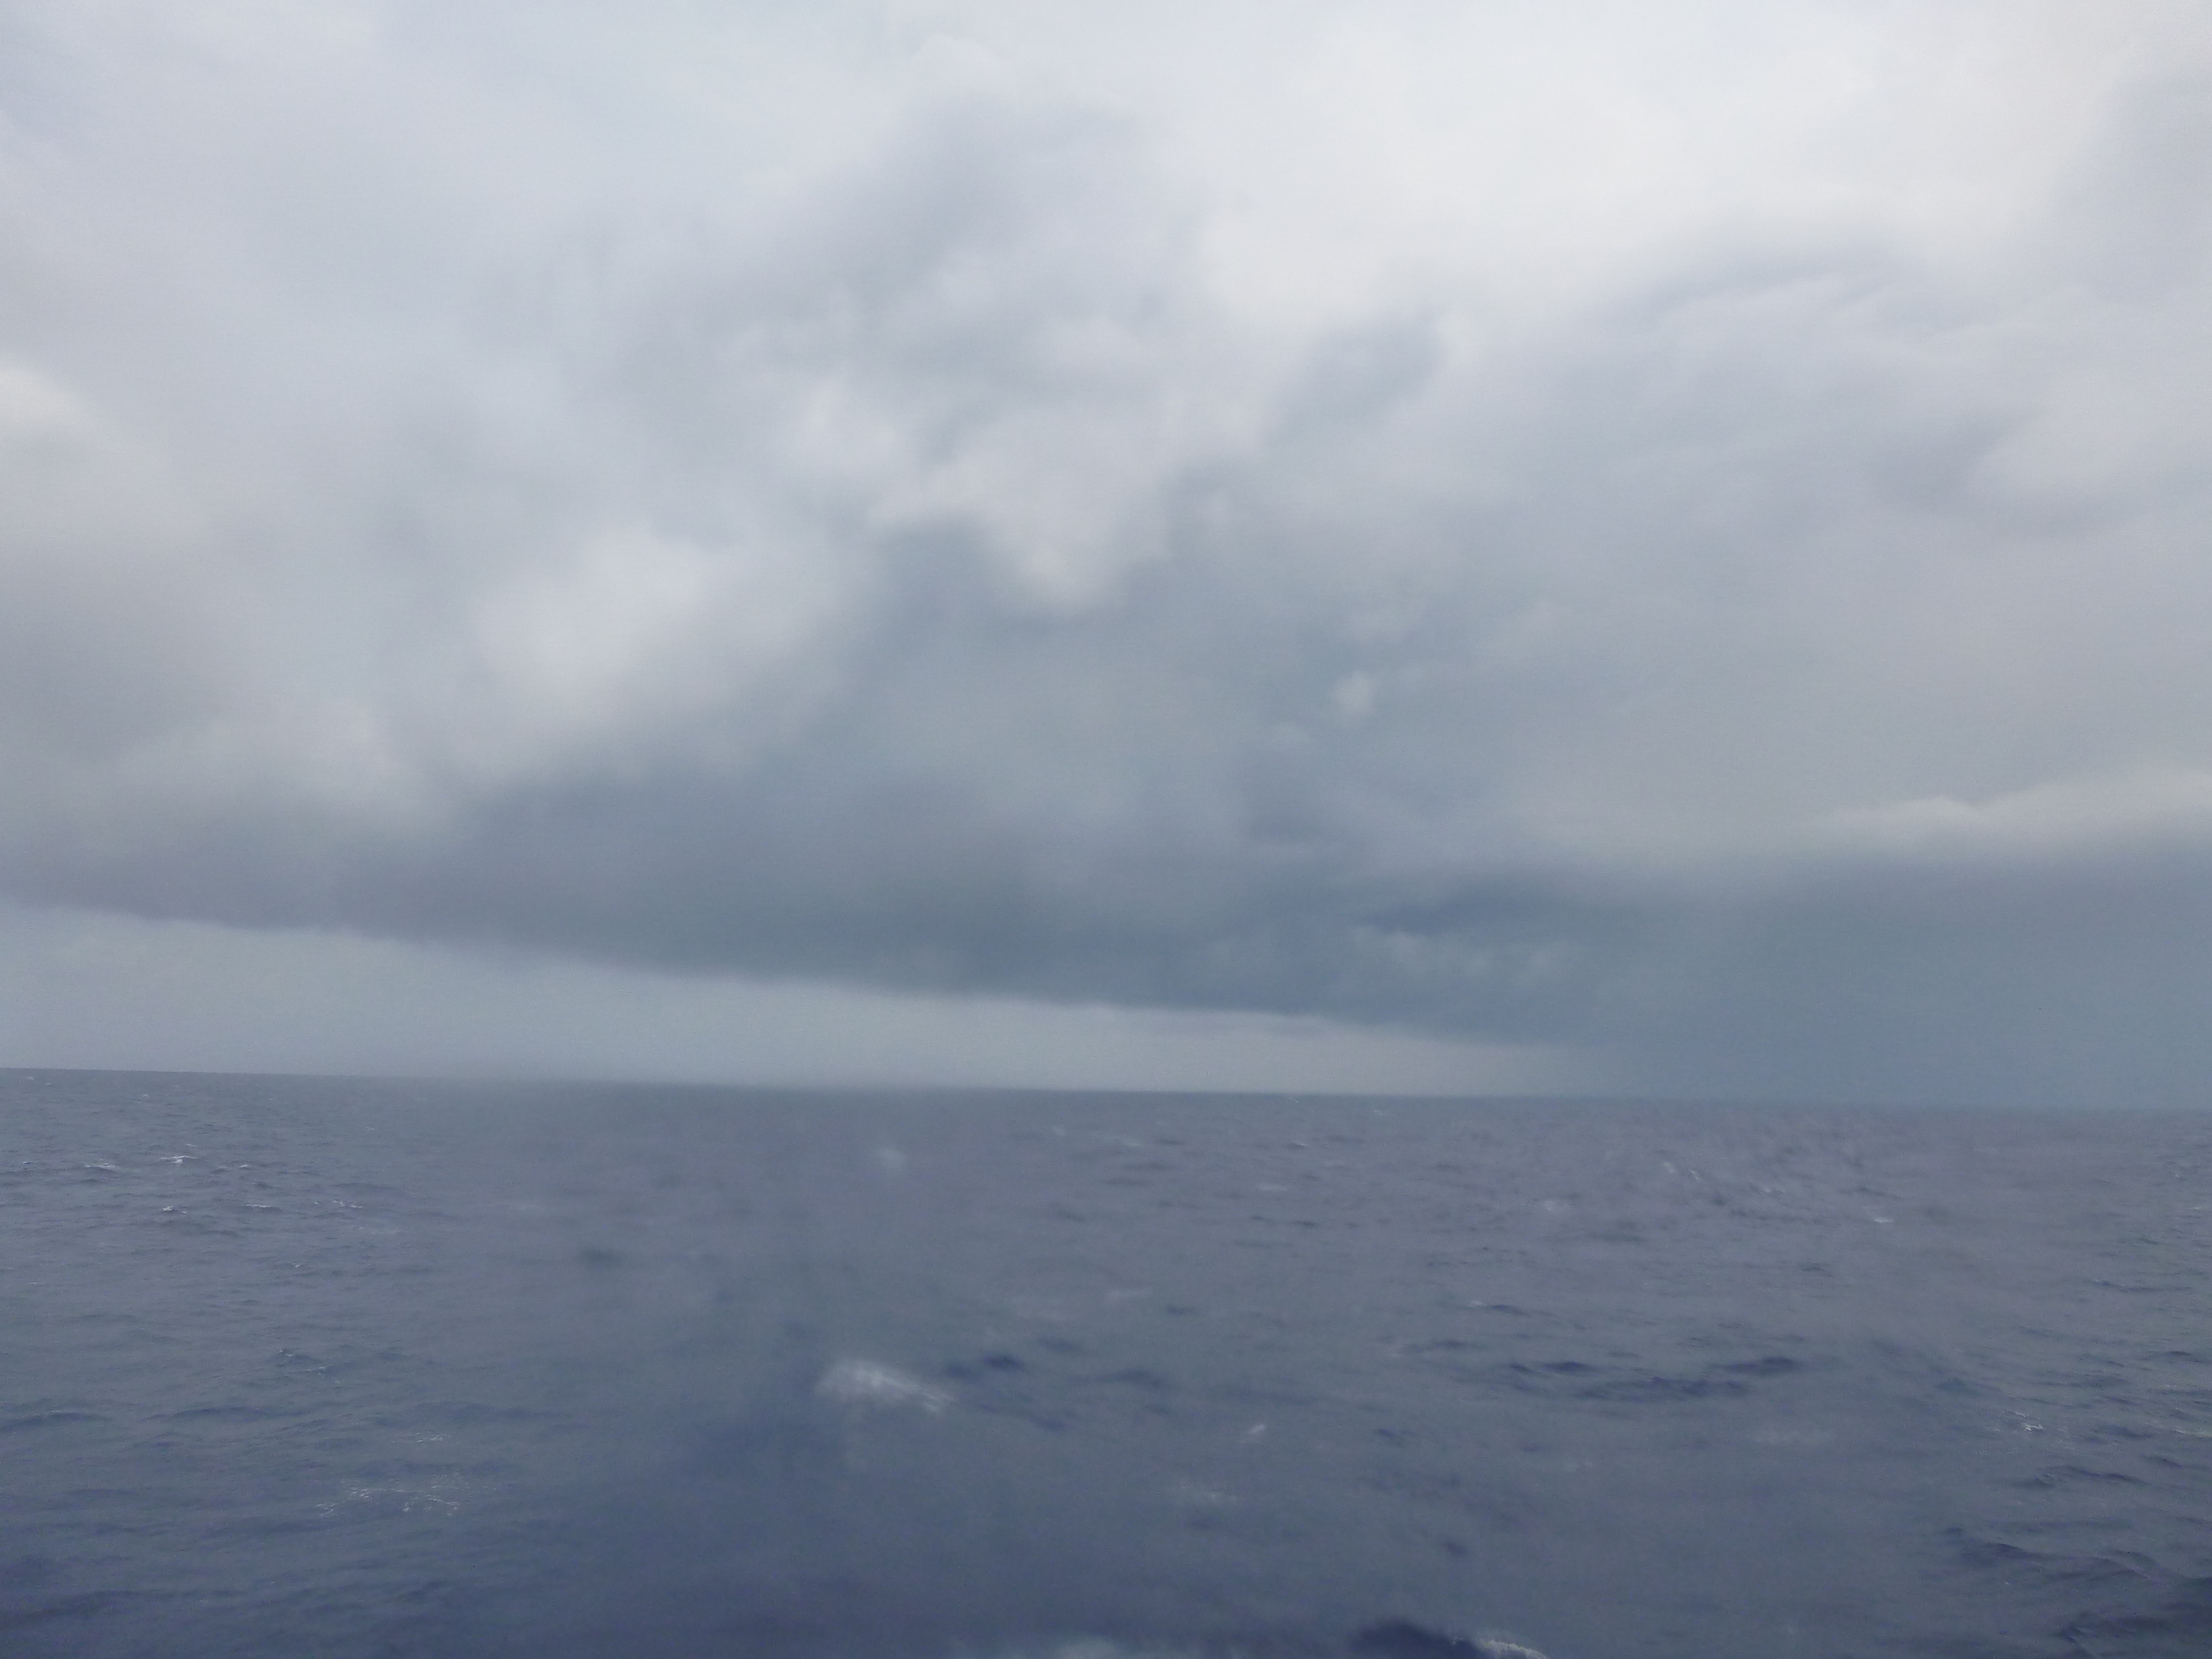
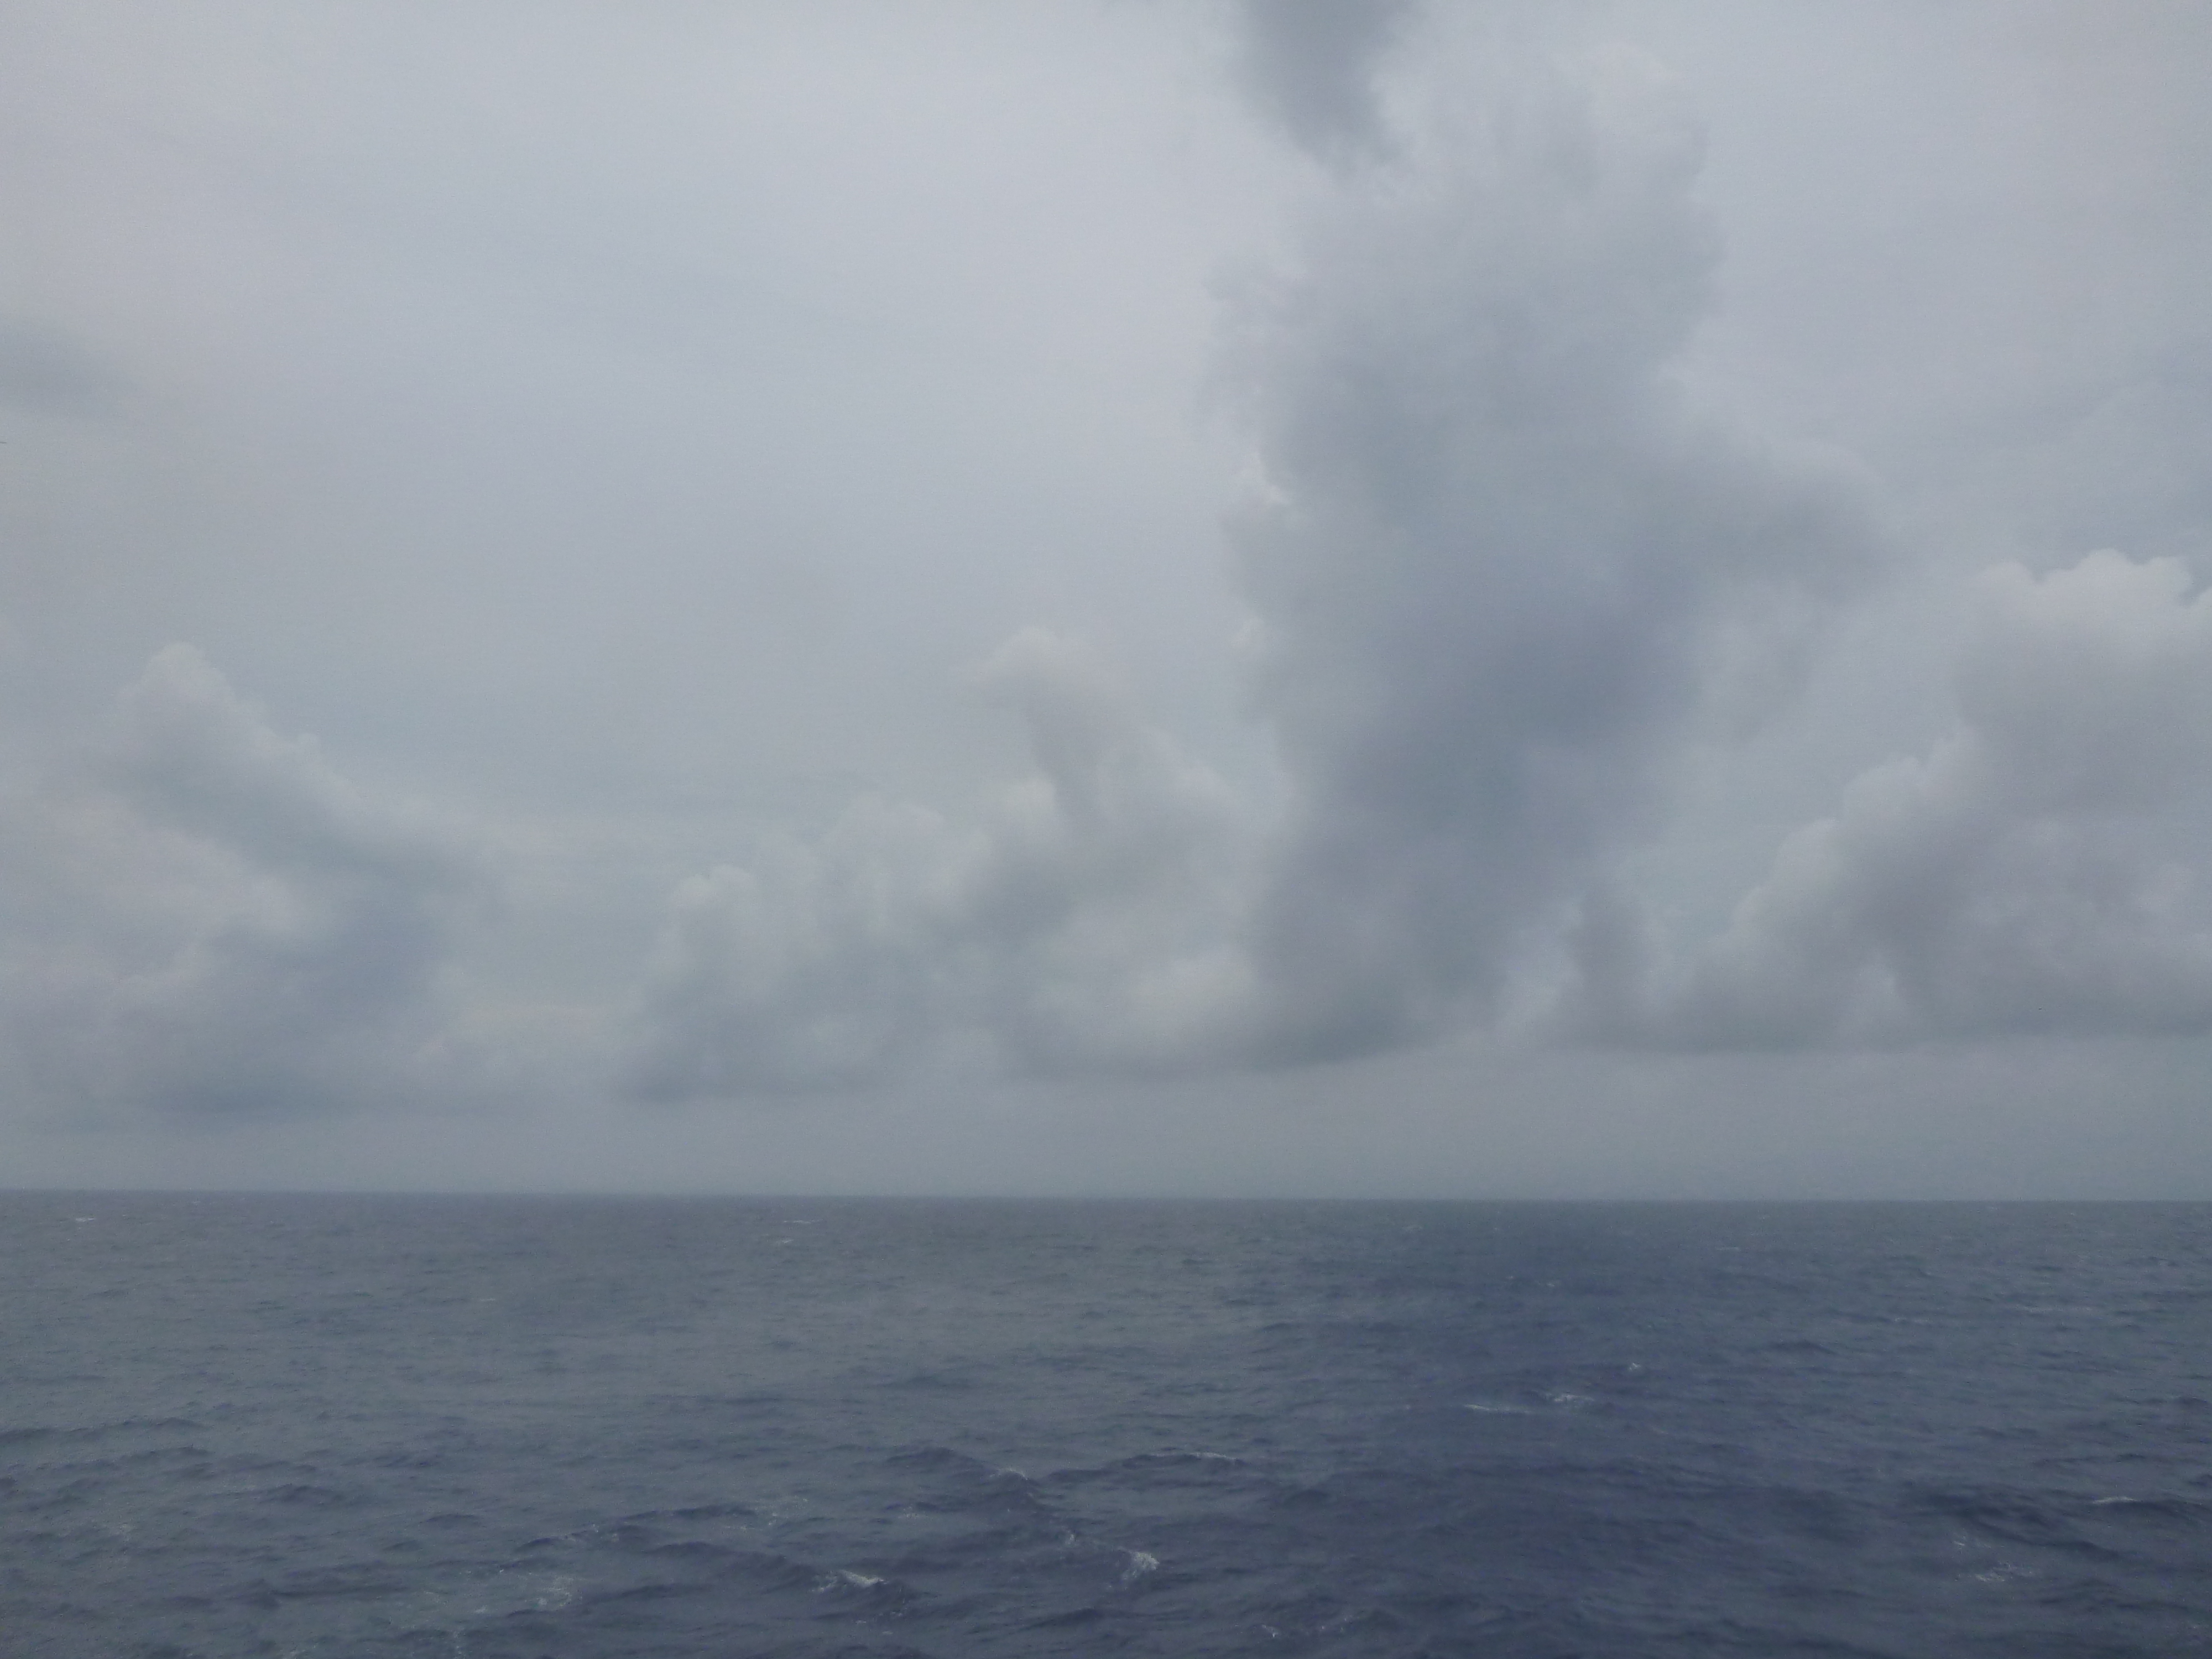
Figure 9: Top: Photo looking toward the convective line passing around 0845 UTC. Bottom: Photo taken of shallow nonprecipitating convection closer to the radar at the same time.Back to text.
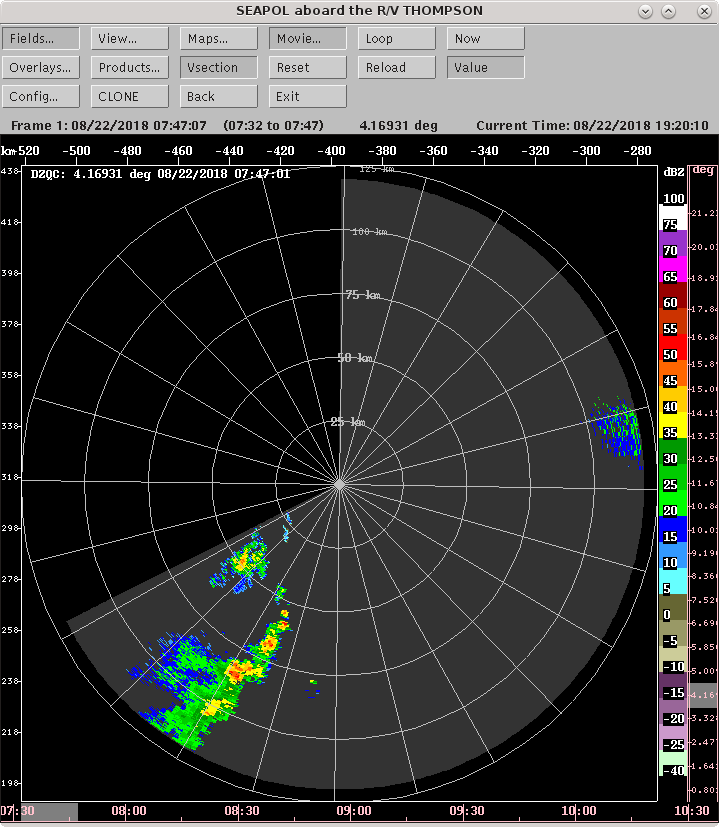
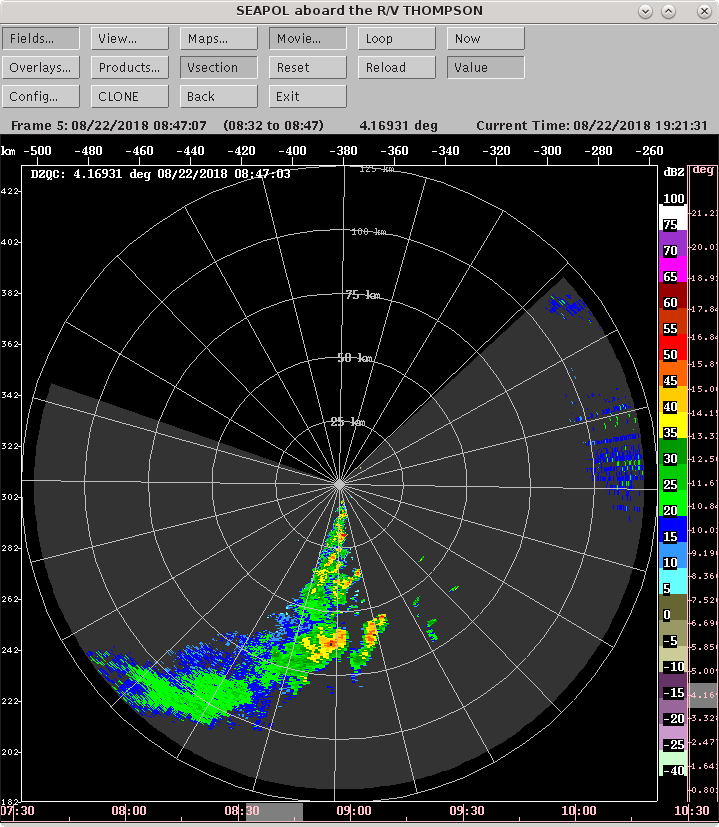
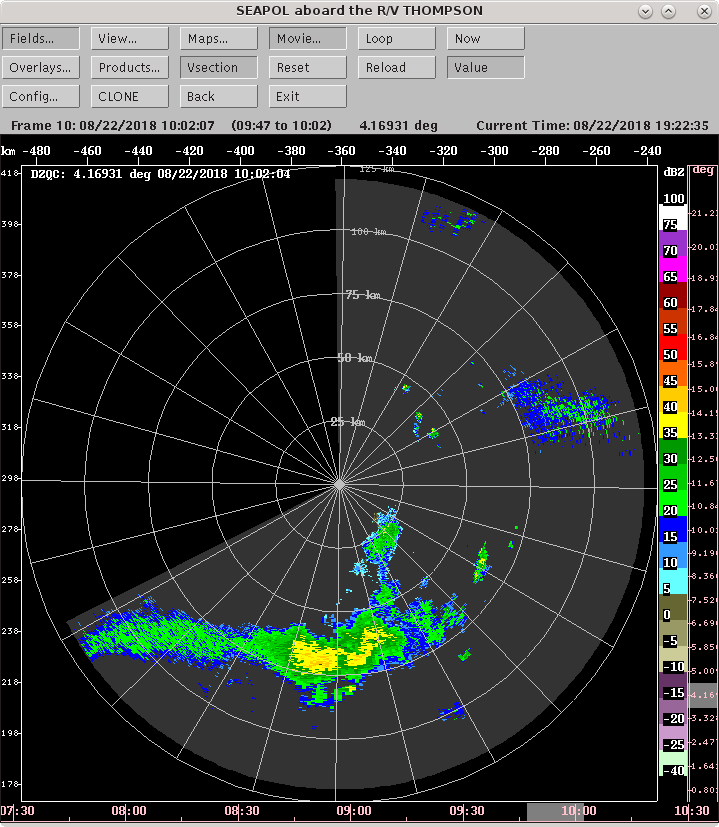
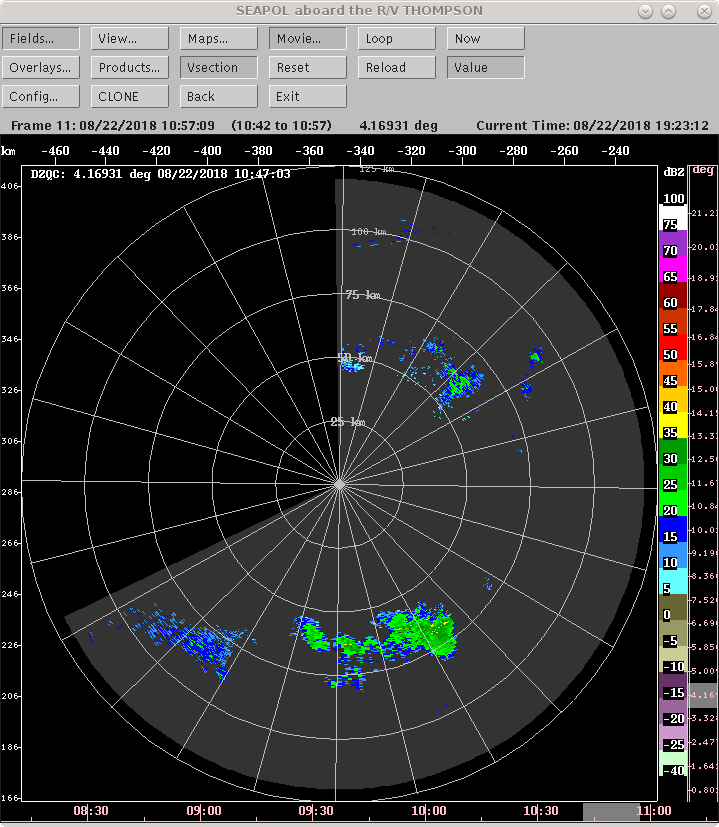
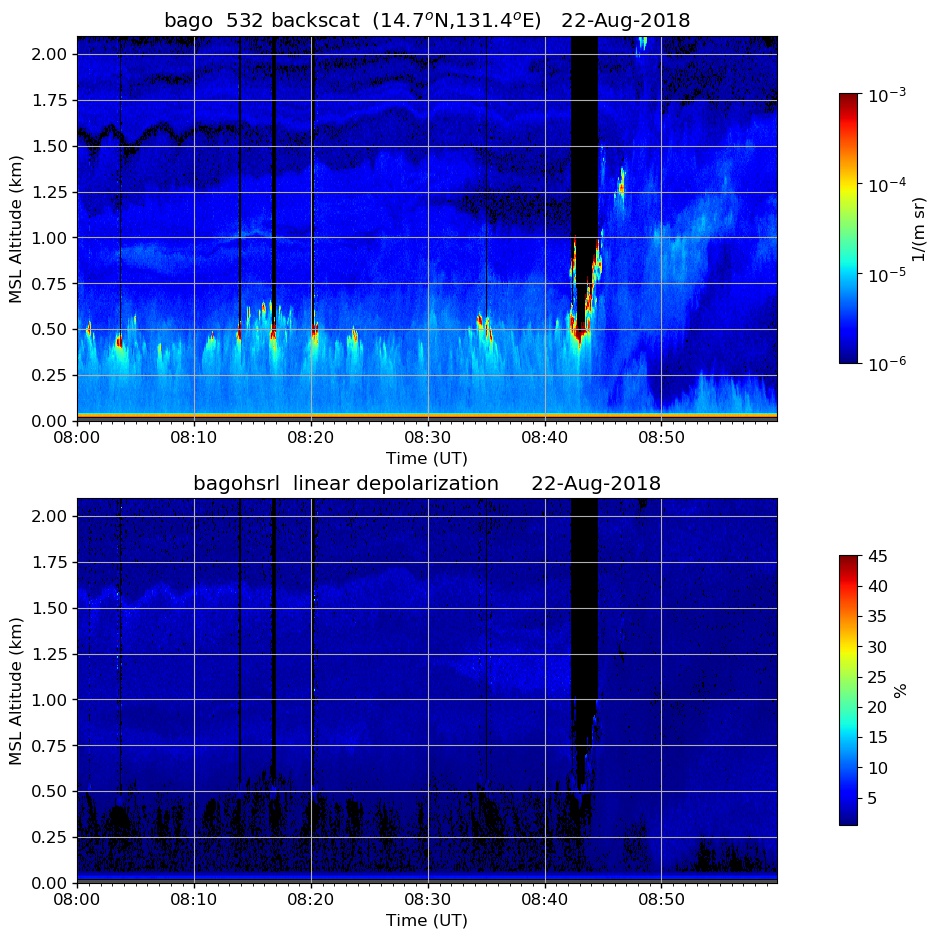
Figure 11: Backscatter (top) and linear depolarization (bottom) from HSRL from 08 to 09 UTC. Back to text.
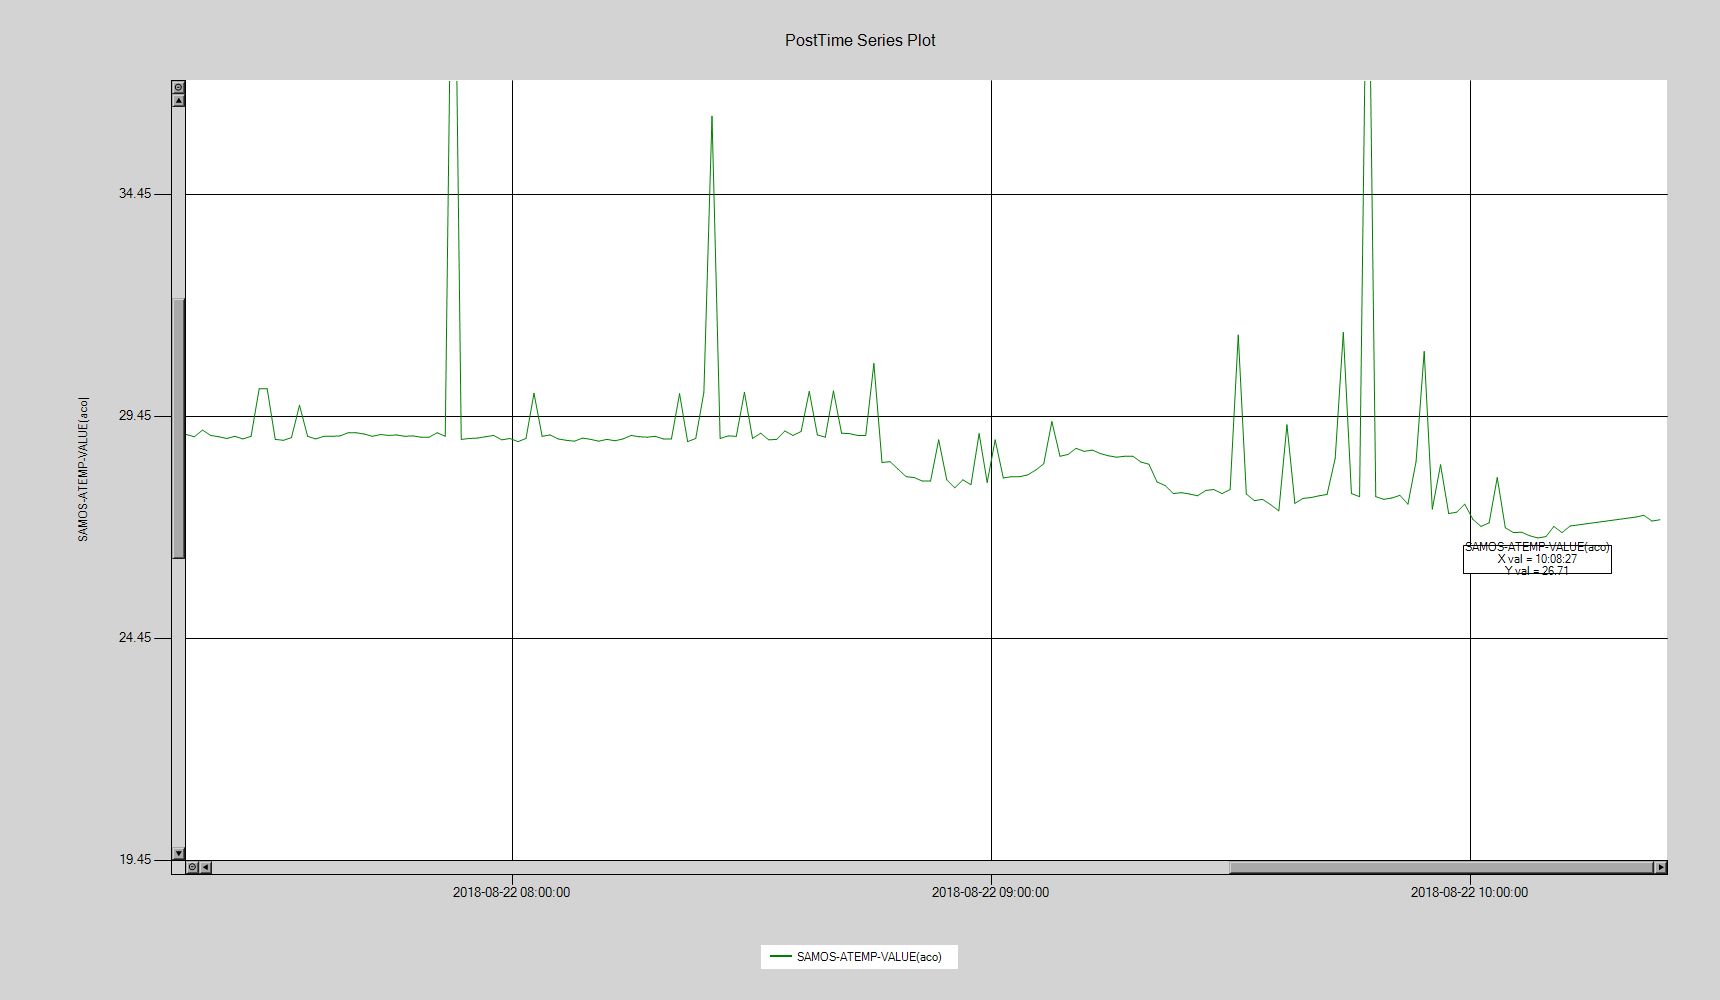
Figure 12: Time series of ship temperature. Note the drop in temperature just before 09 UTC. Back to text.
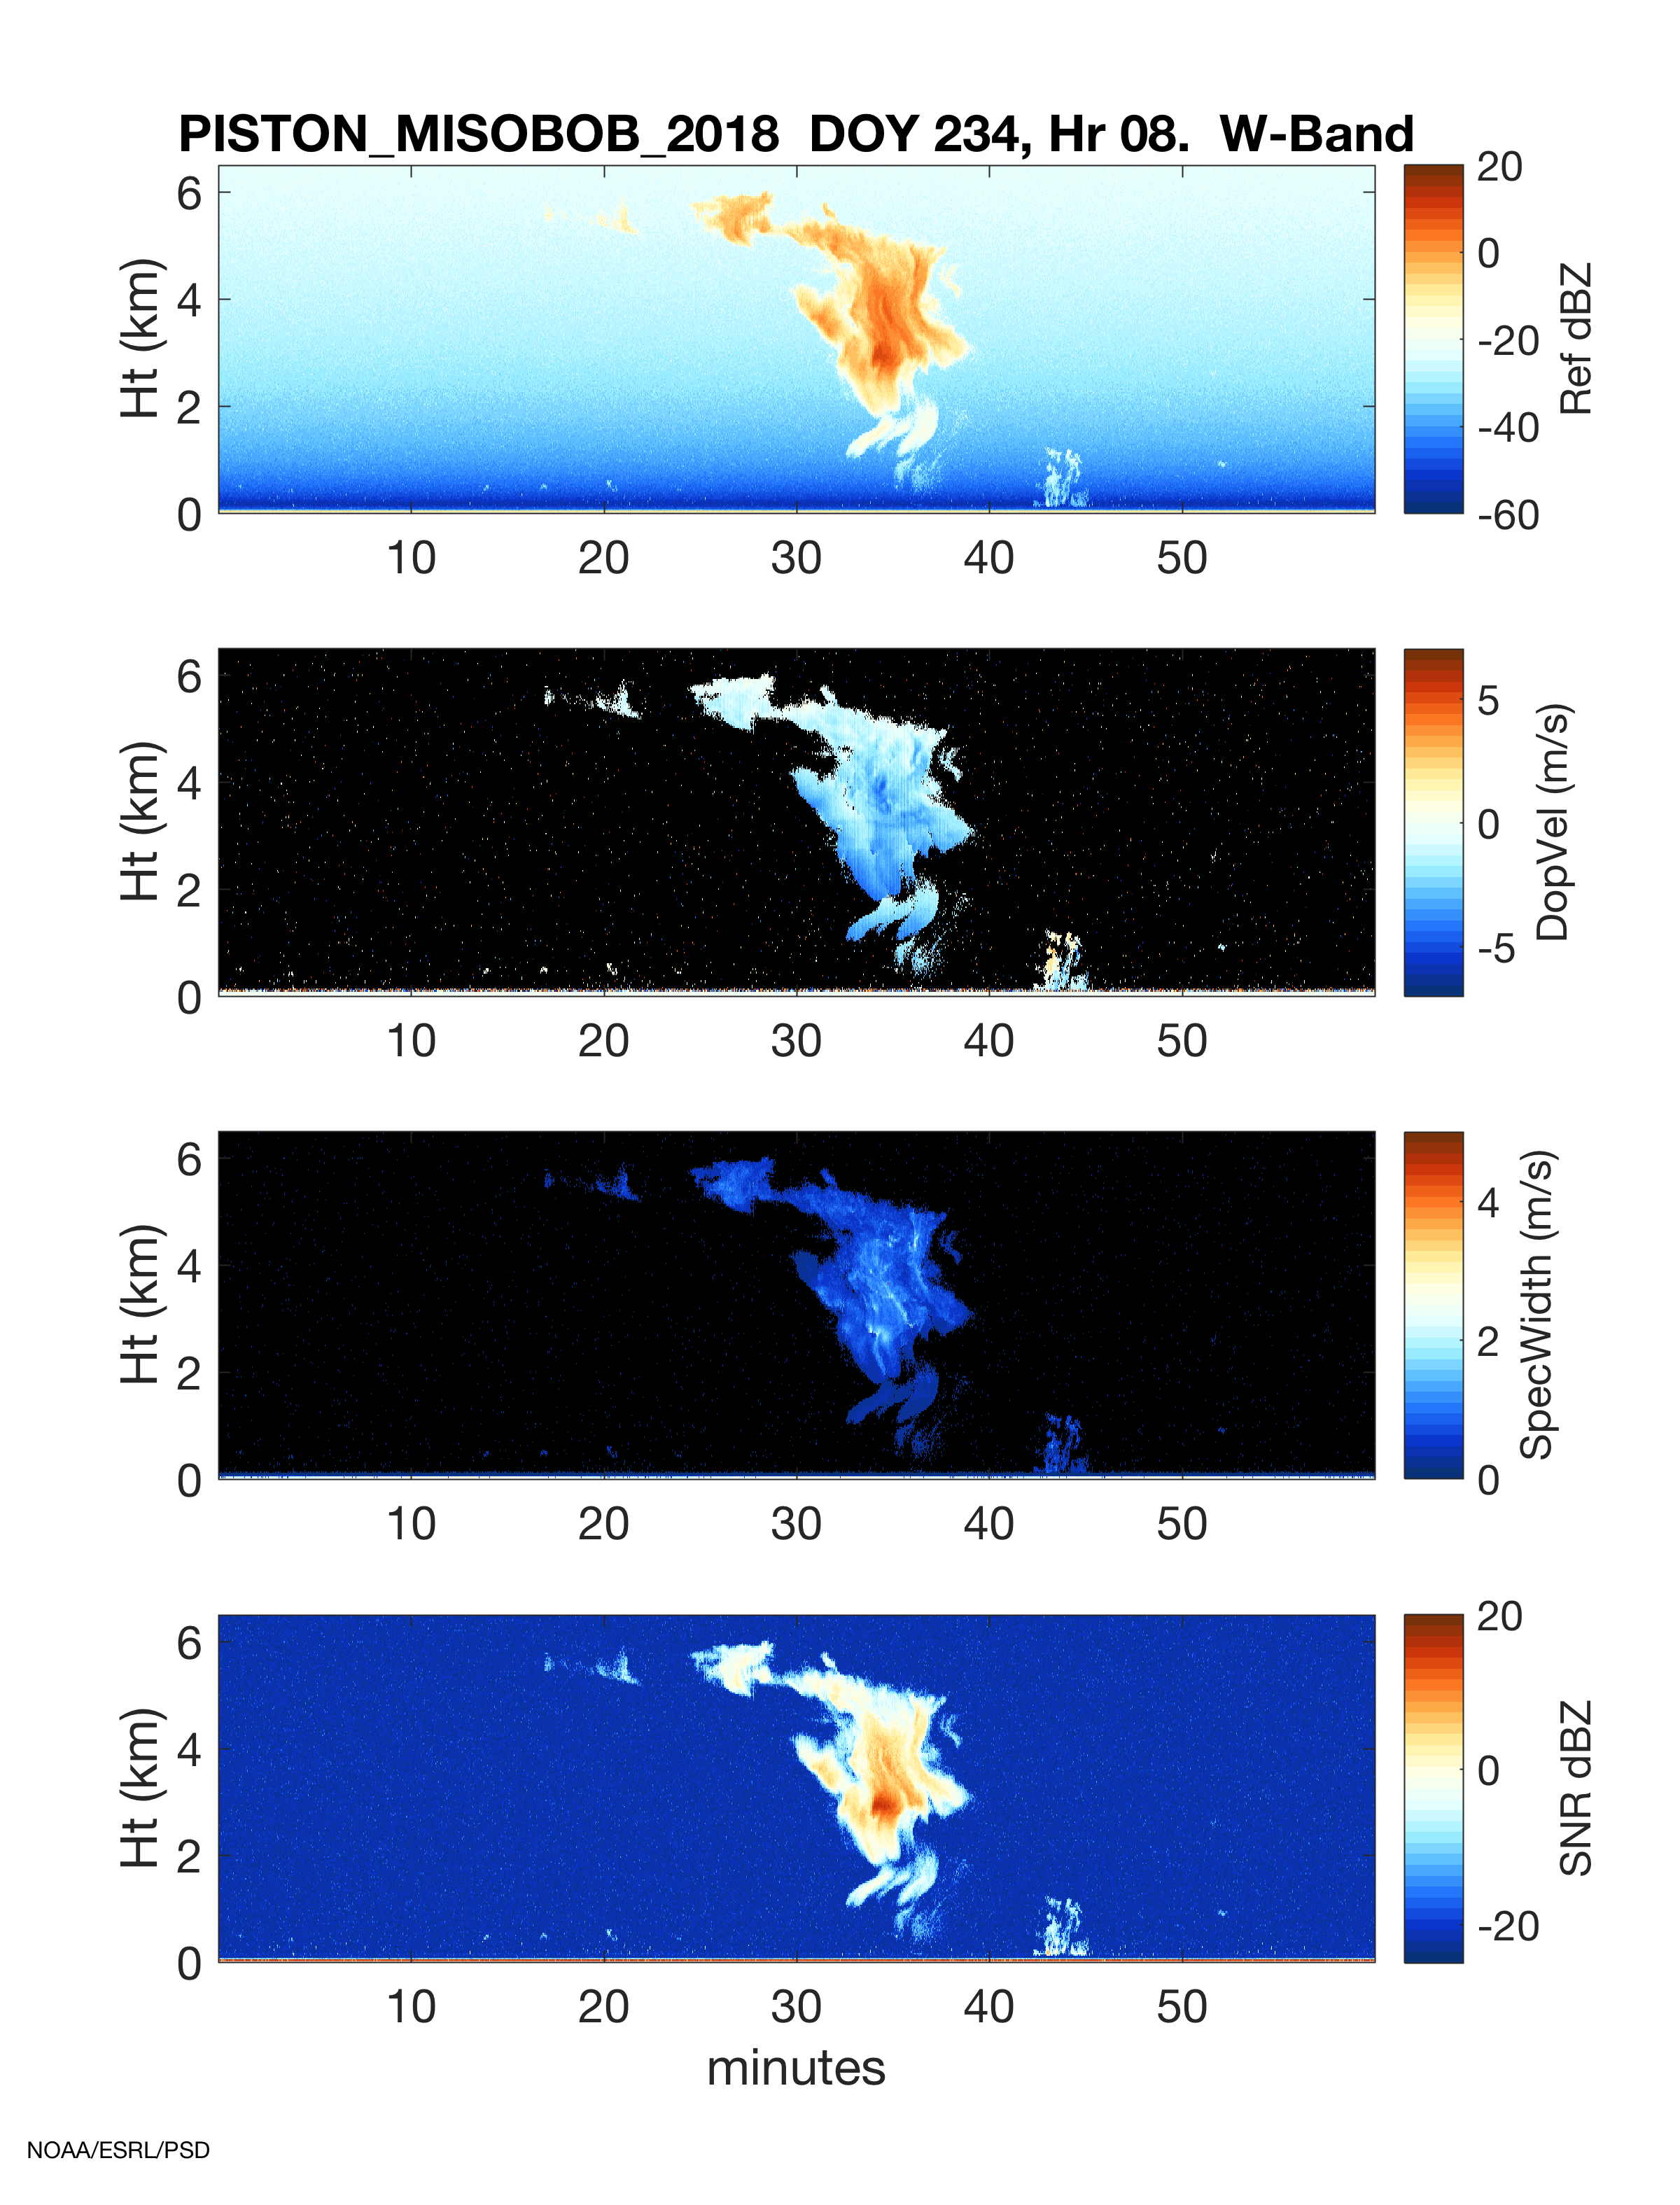
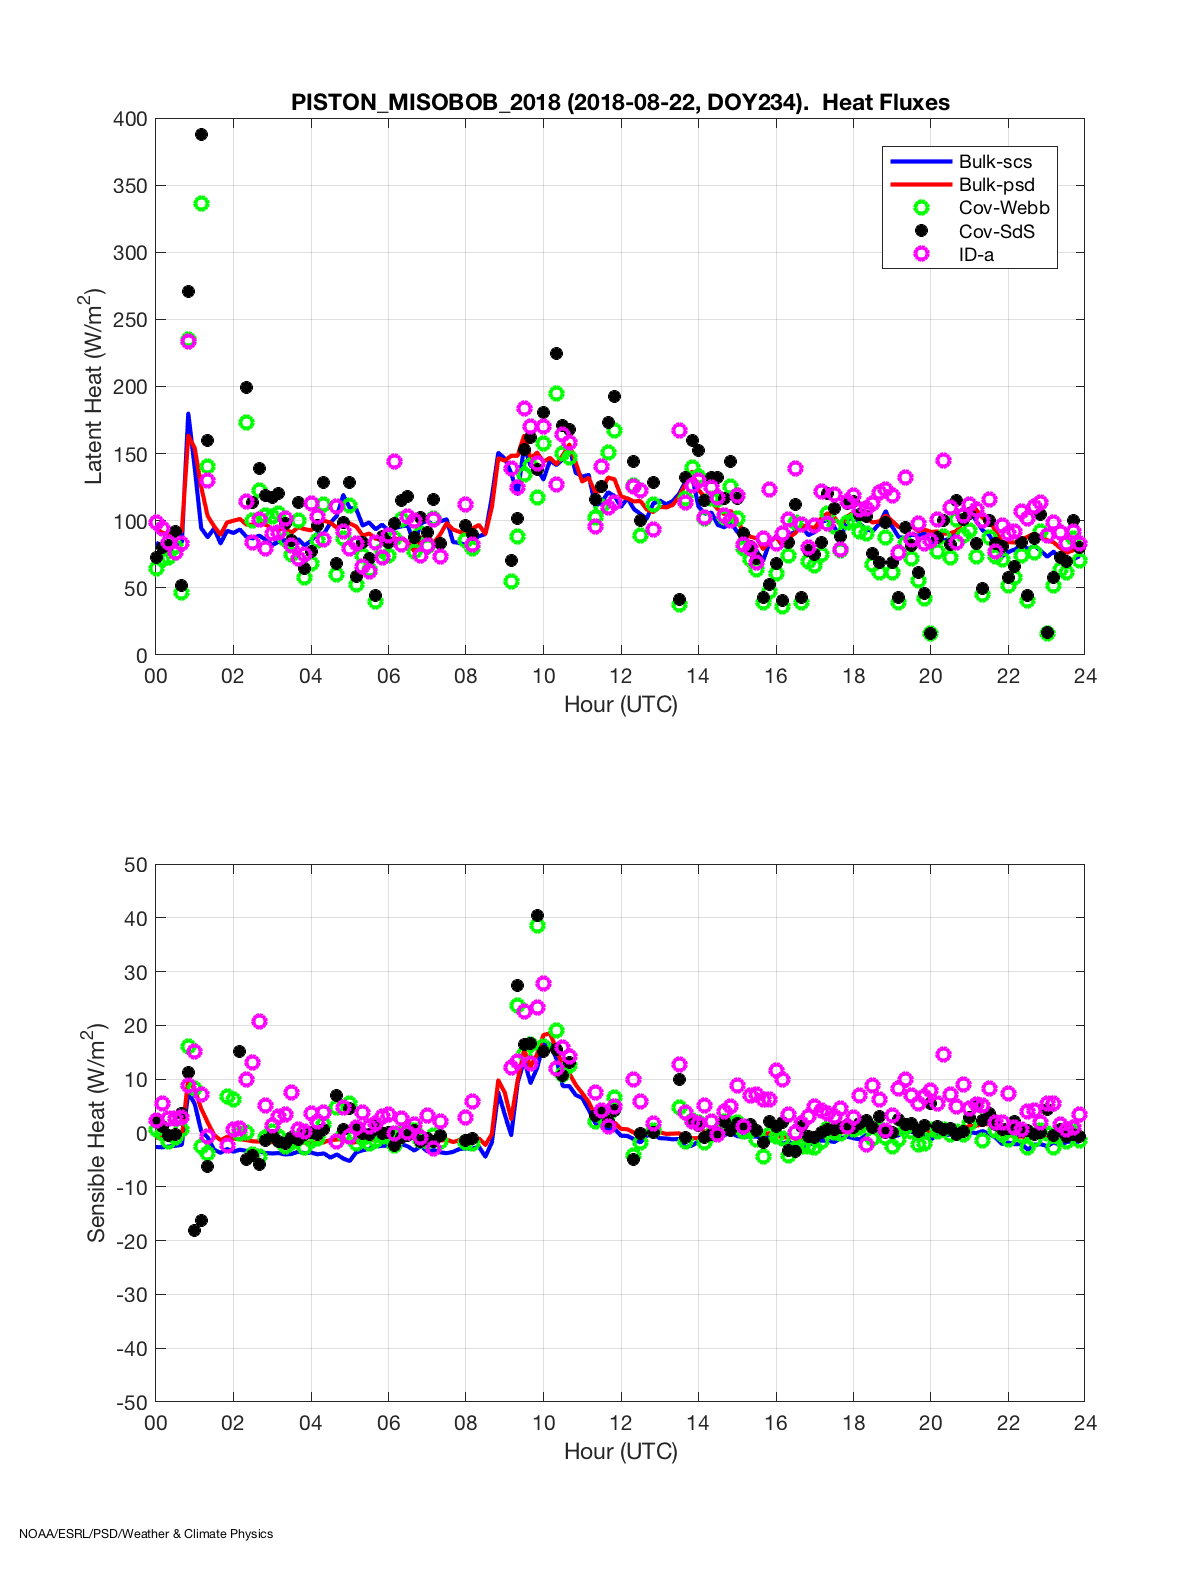
Figure 14: NOAA heat flux product for 22 August. Note the spike in heat fluxes near the cold pool occurrence between 08 and 09 UTC. Back to text.