August 26, 2018
Convectively Suppressed Day
Today was a generally uneventful day near the ship. The ridge continued its attempt to establish itself over the Thompson's location, but convective cells continued to develop in the wake of the very slow-moving trough to the northwest. This is particularly apparent in Figure 1, the visible Himawari image from 2040 UTC. This image also shows a snapshot of a mesoscale system that fluctuated in size to our southeast, between 145-150E and 5-10N. It had moved there from further east, helping the next trough in the sequence squeeze the ridge from the other side.
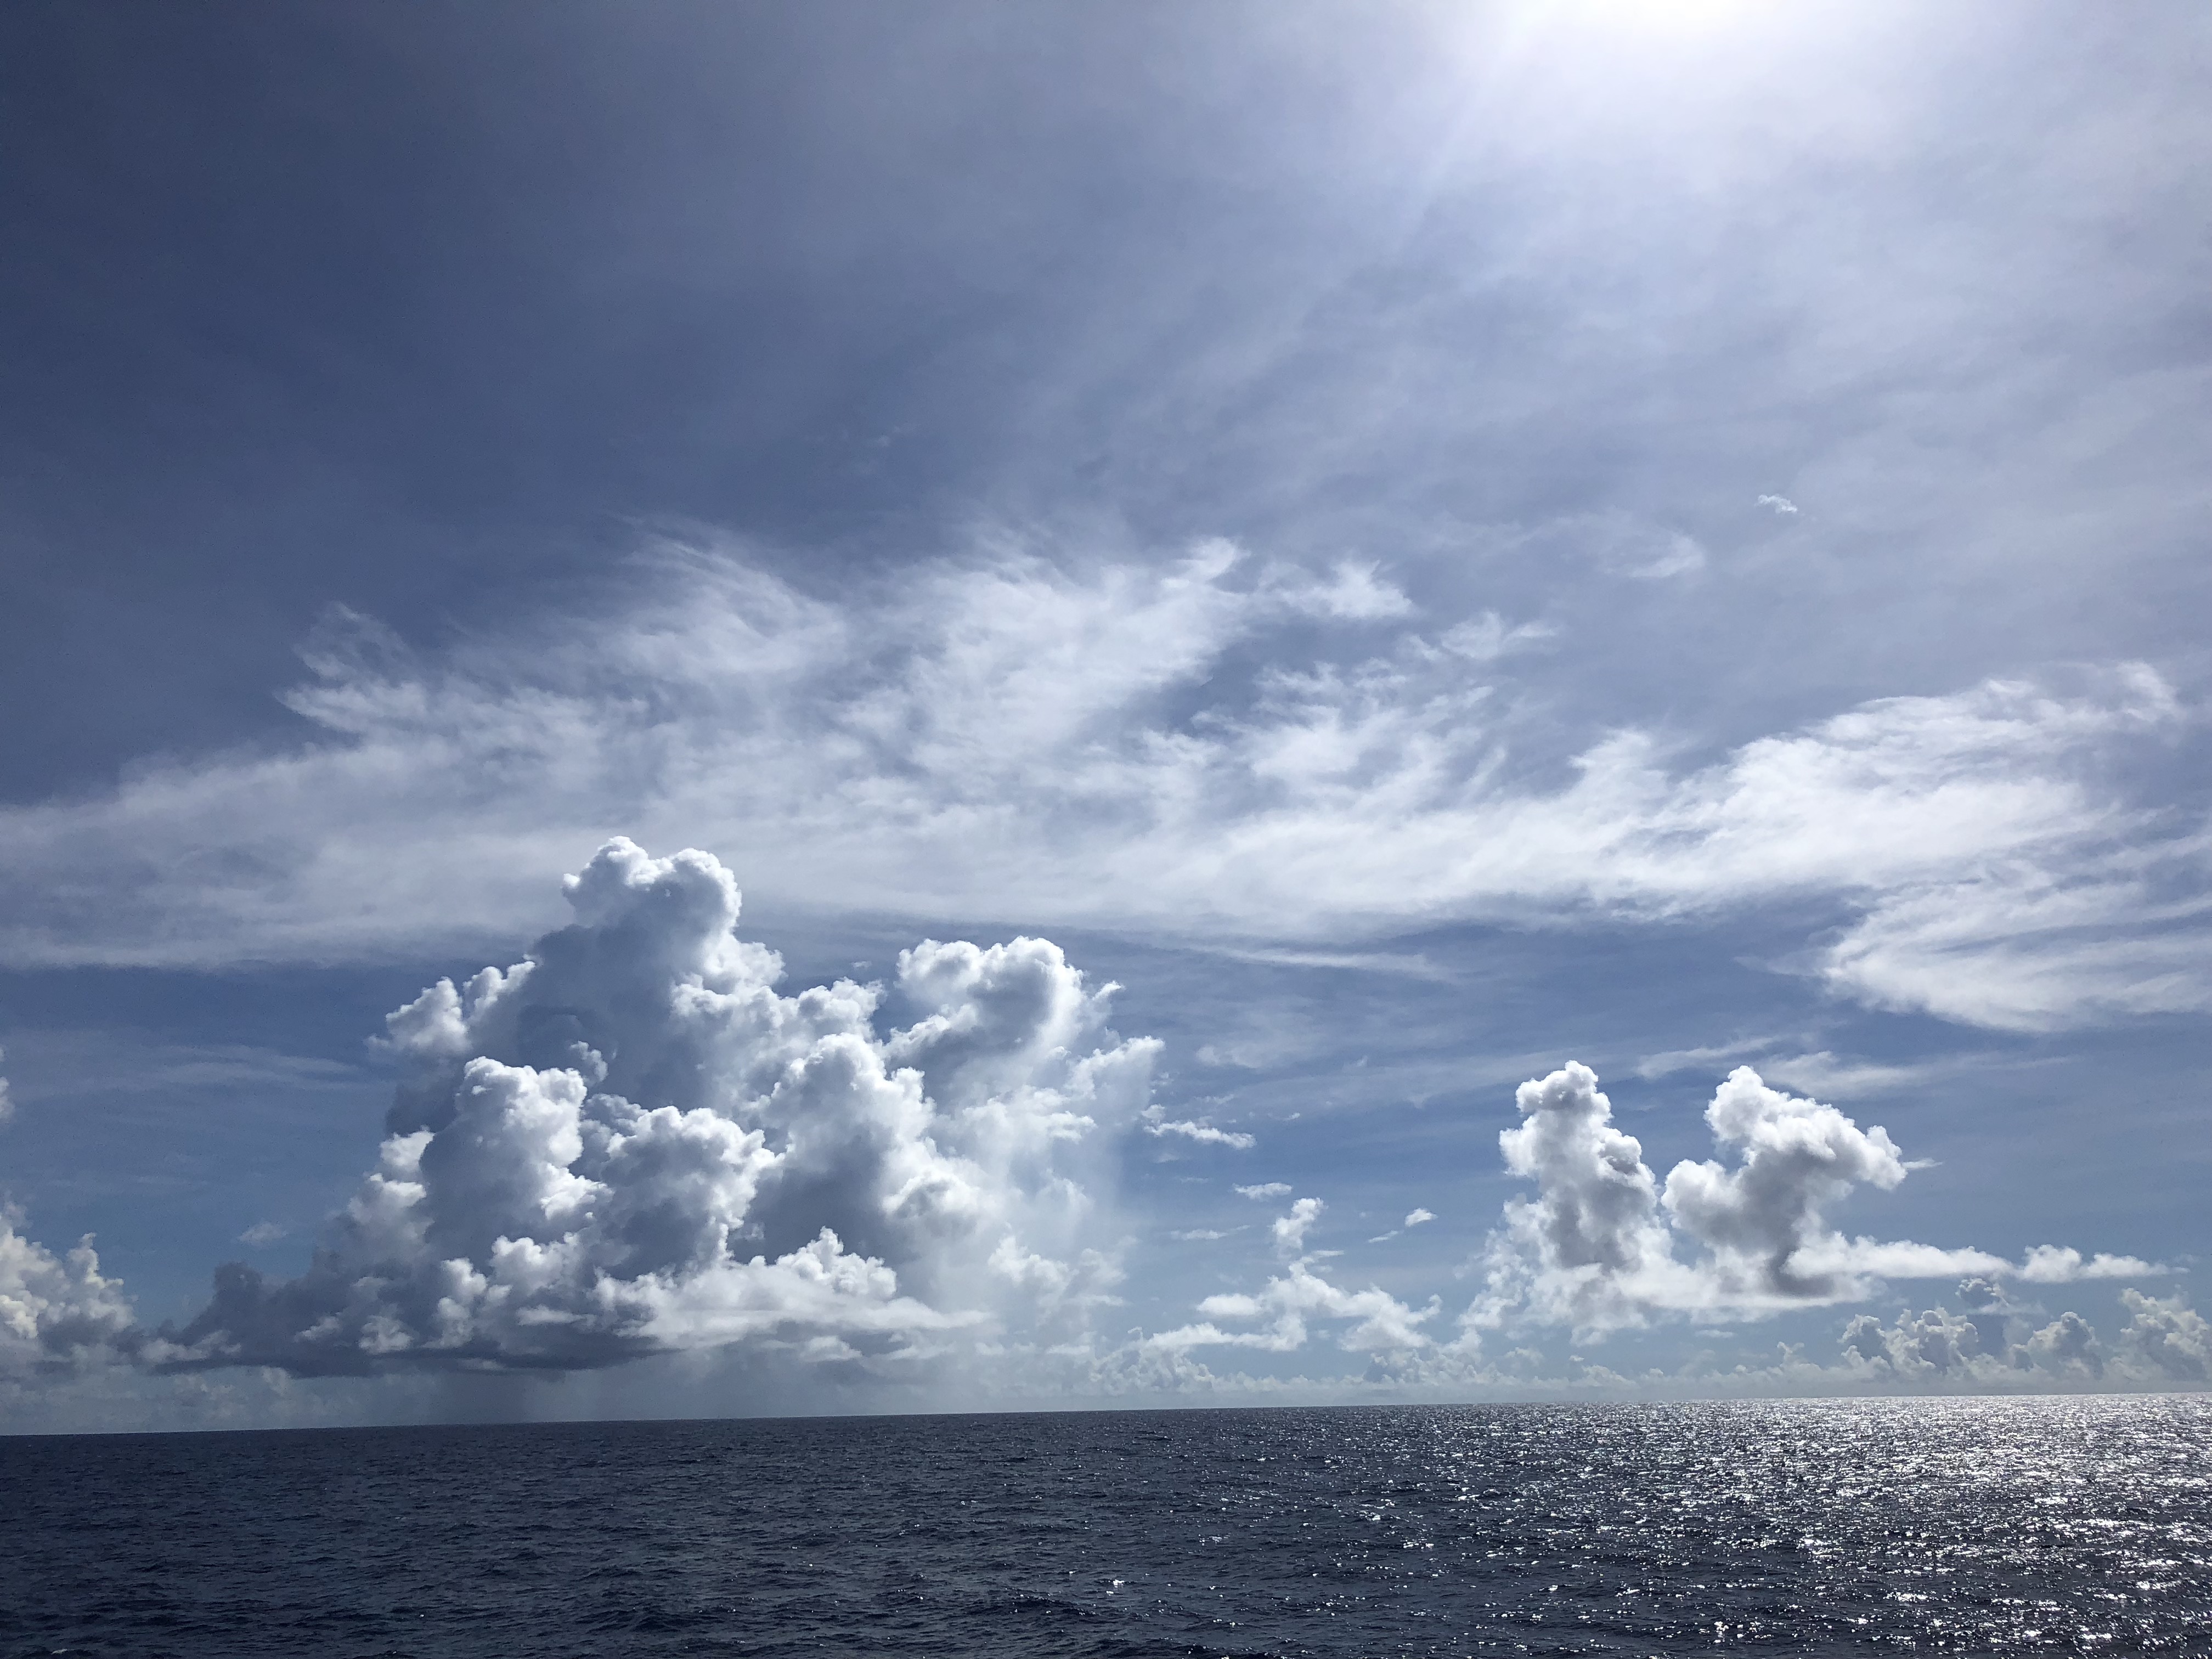
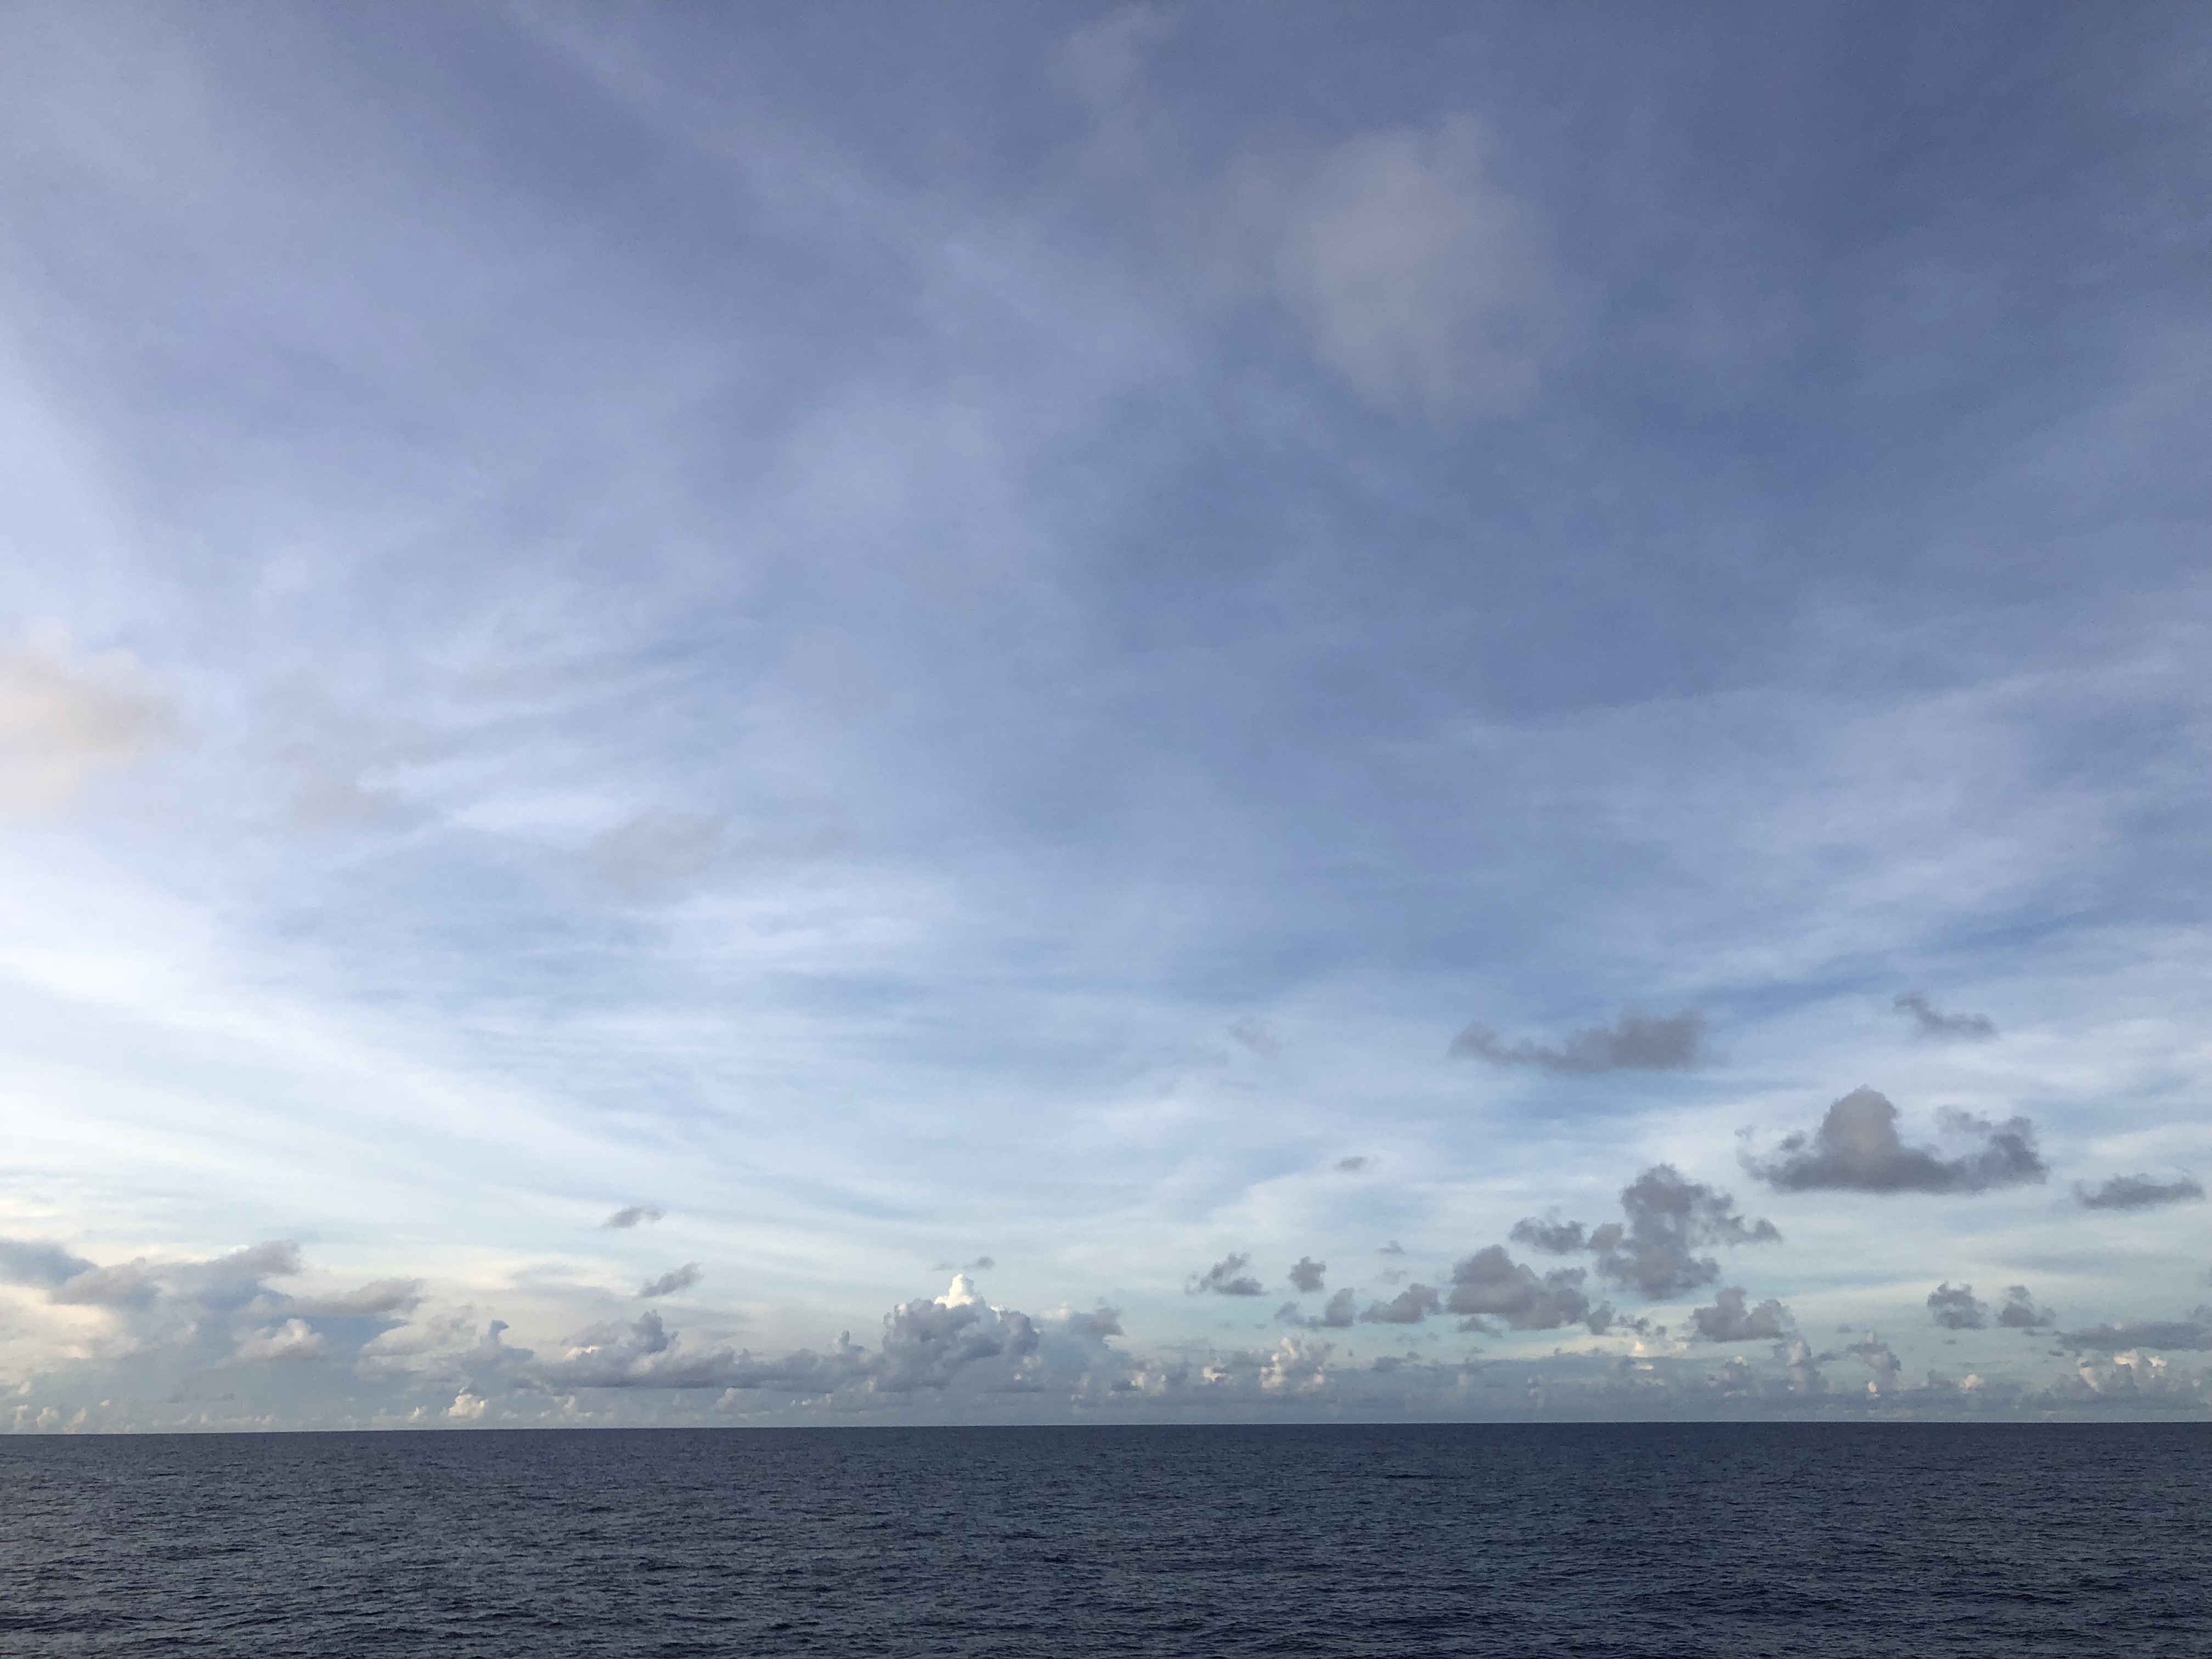
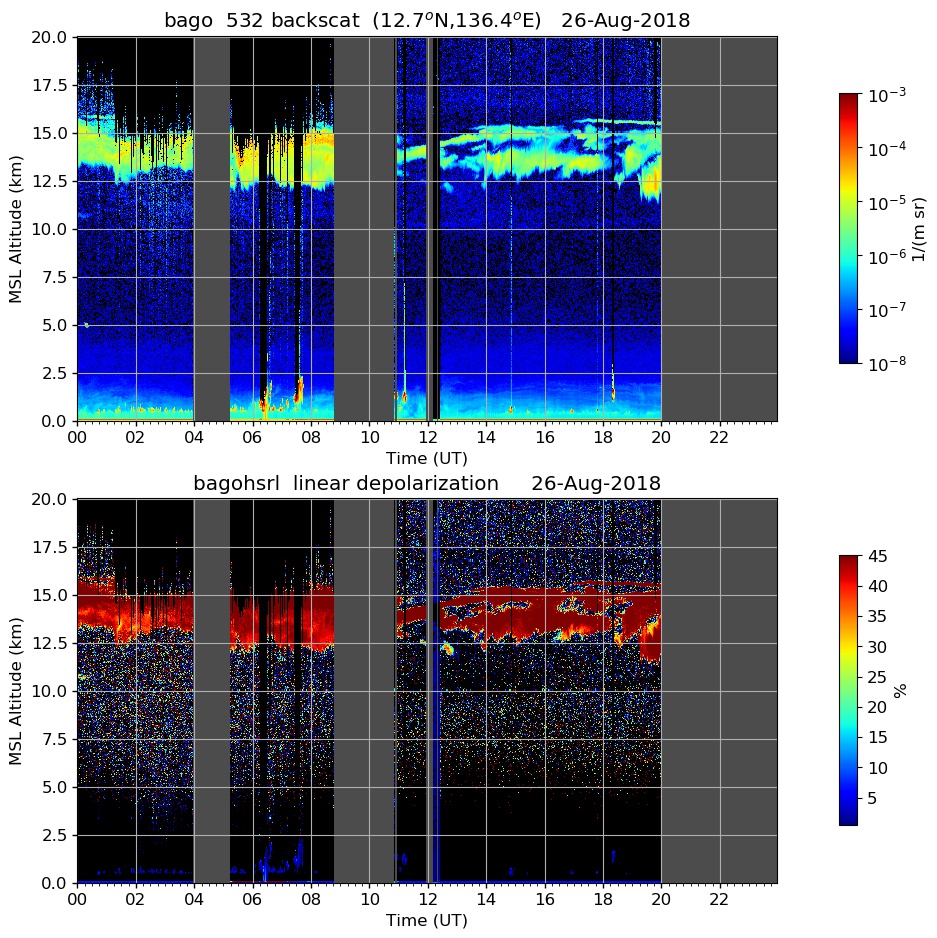
Isolated, shallow convection similar to that seen in Figure 2 persisted throughout the day, and cirrus cloud persisted between 12 and 16 km as detected by lidar (Figure 3). A typical PPI like the one seen in Figure 4 captured the convection as detected by SEAPOL. The 00 UTC sounding (Figure 5) observed weak winds throughout the column, and 58 mm total precipitable water. The total 850-200 mb shear was a whopping 2 kts. By the 21 UTC sounding (Figure 6), the upper atmosphere had dried out considerably, but TPW was still near 54 mm and stronger easterlies or northeasterlies were observed in the upper troposphere.
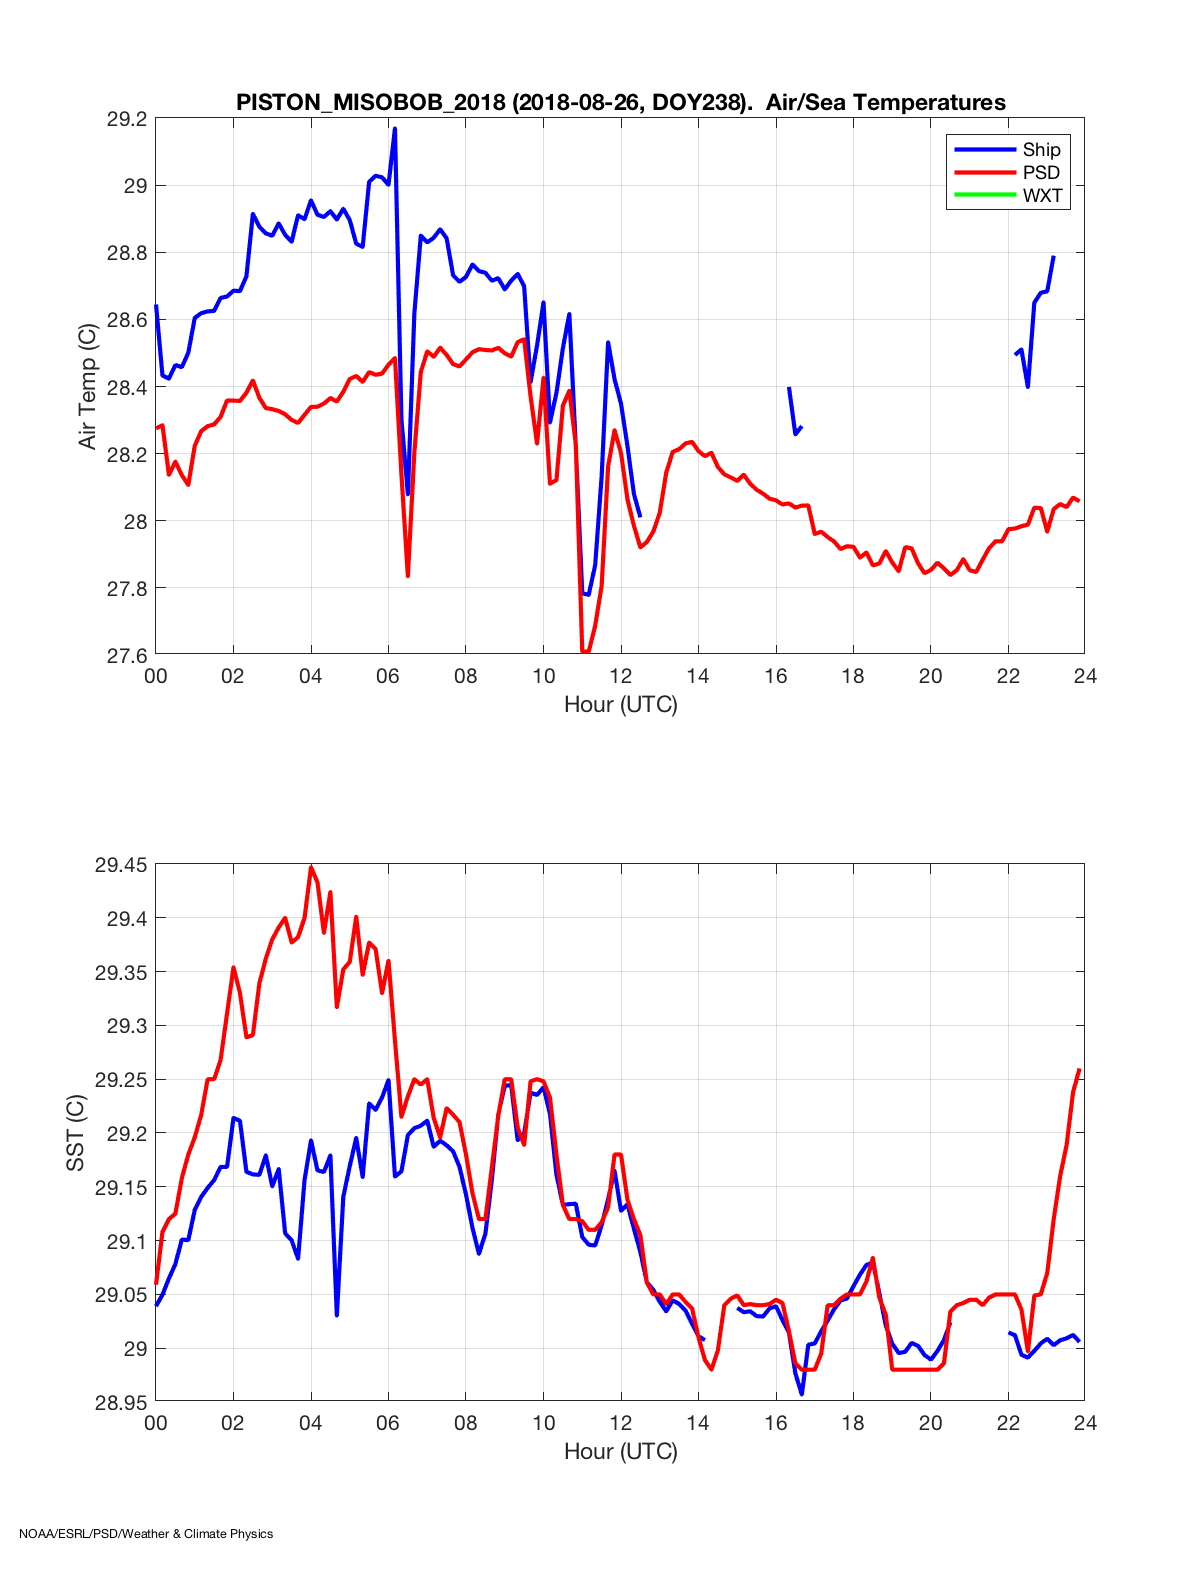
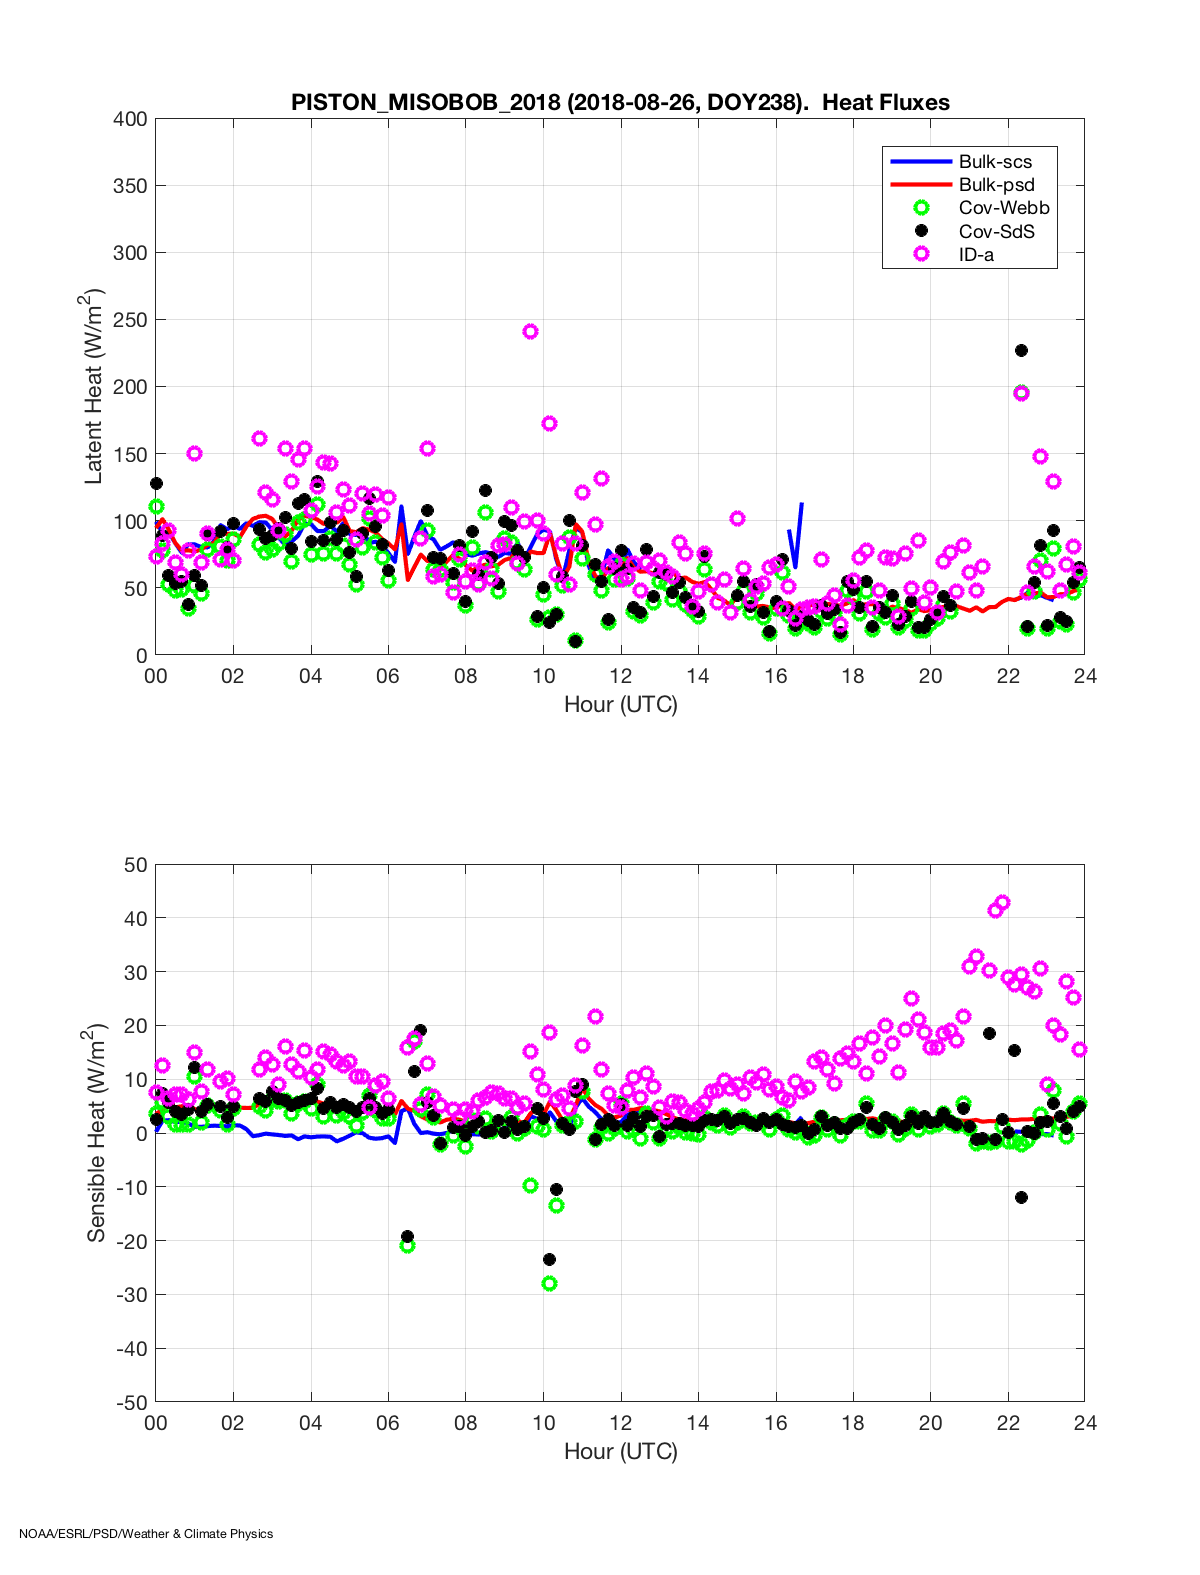
SST anomalies have been slightly negative in the vicinity of the ship over the past few days, but the magnitude of the negative anomaly seems to be lessening (Figure 7). SST at the ship ranged between 29–30C throughout the day (Figure 8); however, surface heat fluxes in the low-wind regime were quite low (Figure 9).
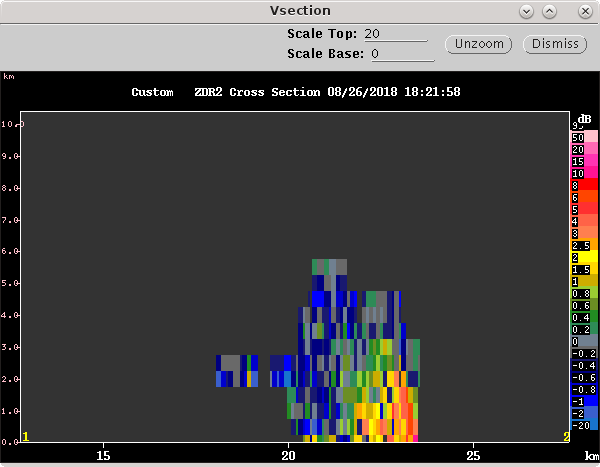
An additional example of a small cell with a high ZDR core is shown in Figure 10. Other than the high ZDR in a short-lived cell, there was nothing particularly remarkable about this cell.