August 27, 2018
A Slightly Less Convectively Suppressed Day
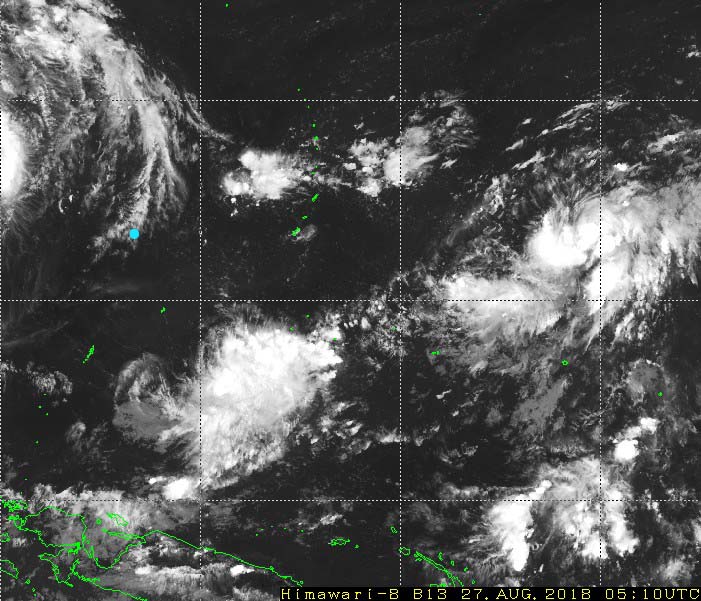
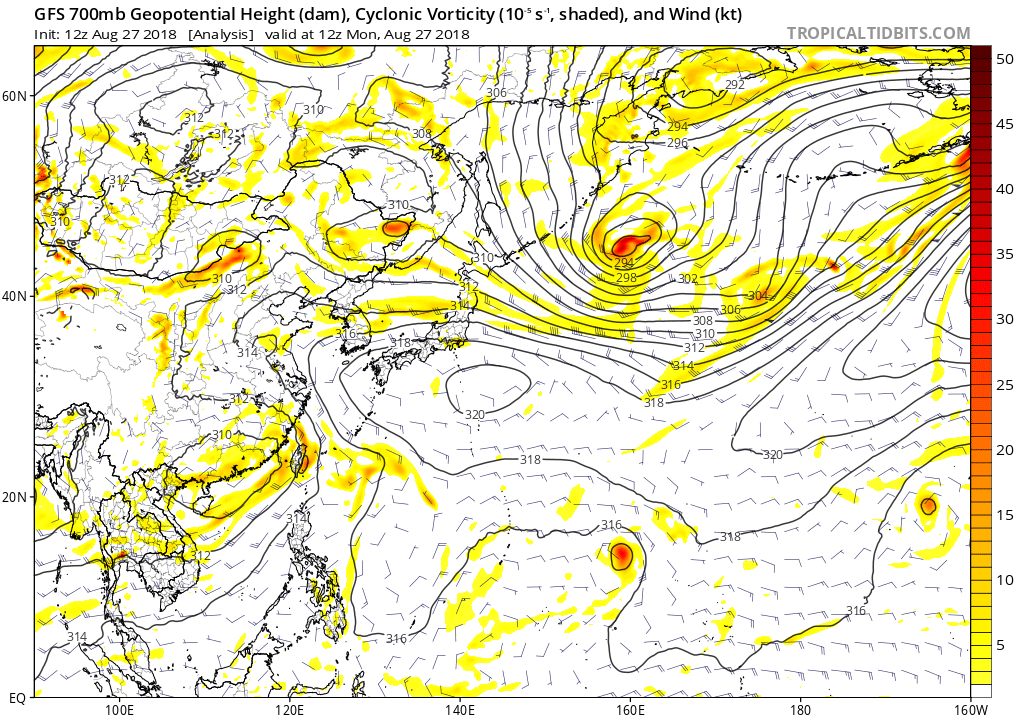
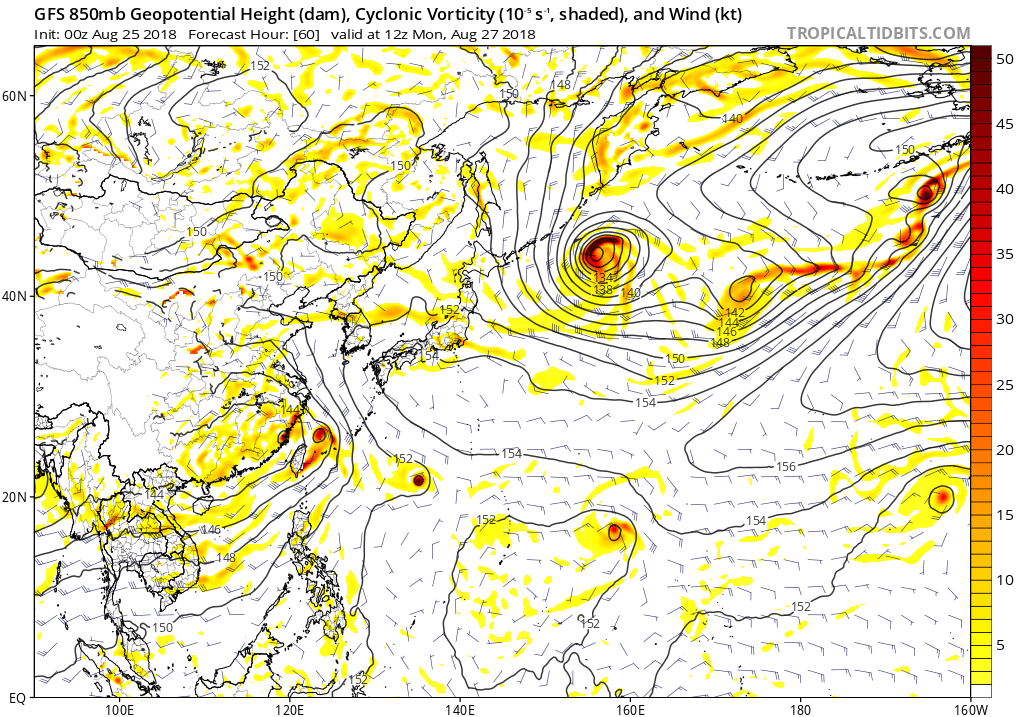
August 27 started much like August 26 ended. Scattered isolated convection persisted through the domain during the morning and early afternoon. The 0500 Himawari image (Figure 1; blue dot is approximate location of the Thompson) showed the ship on the southern end of an area of high cloud. To the east-northeast, between 140E and 150E, a small area of convection was moving generally toward the ship an would cause some precipitation at the ship during the night. To the southeast between the equator and 10N, a larger complex of convection continued to move westward and would miss the ship well to the south. Figure 2 depicts the 12 UTC GFS analysis, and a 60 hour forecast of that time. The fields shown are not the same - 700 hPa in the analysis, 850 hPa in the forecast --- but the differences were the same in the 850 hPa analysis fields at 00Z and 12Z (not shown). The ship was located east of the ridge axis where low-level northerlies prevailed. The 60-hour forecast verified well at the large scale, even depicting two shortwaves within the broader trough approaching from the east (features whose development had been associated with distinct areas of convection seen in satellite imagery in preceding days), but was too aggressive in strengthening the vorticity maxima - both the one to the east that would later become typhoon Jebi, and the one to the north (near the Thompson's longitude, a bit north of 20N).
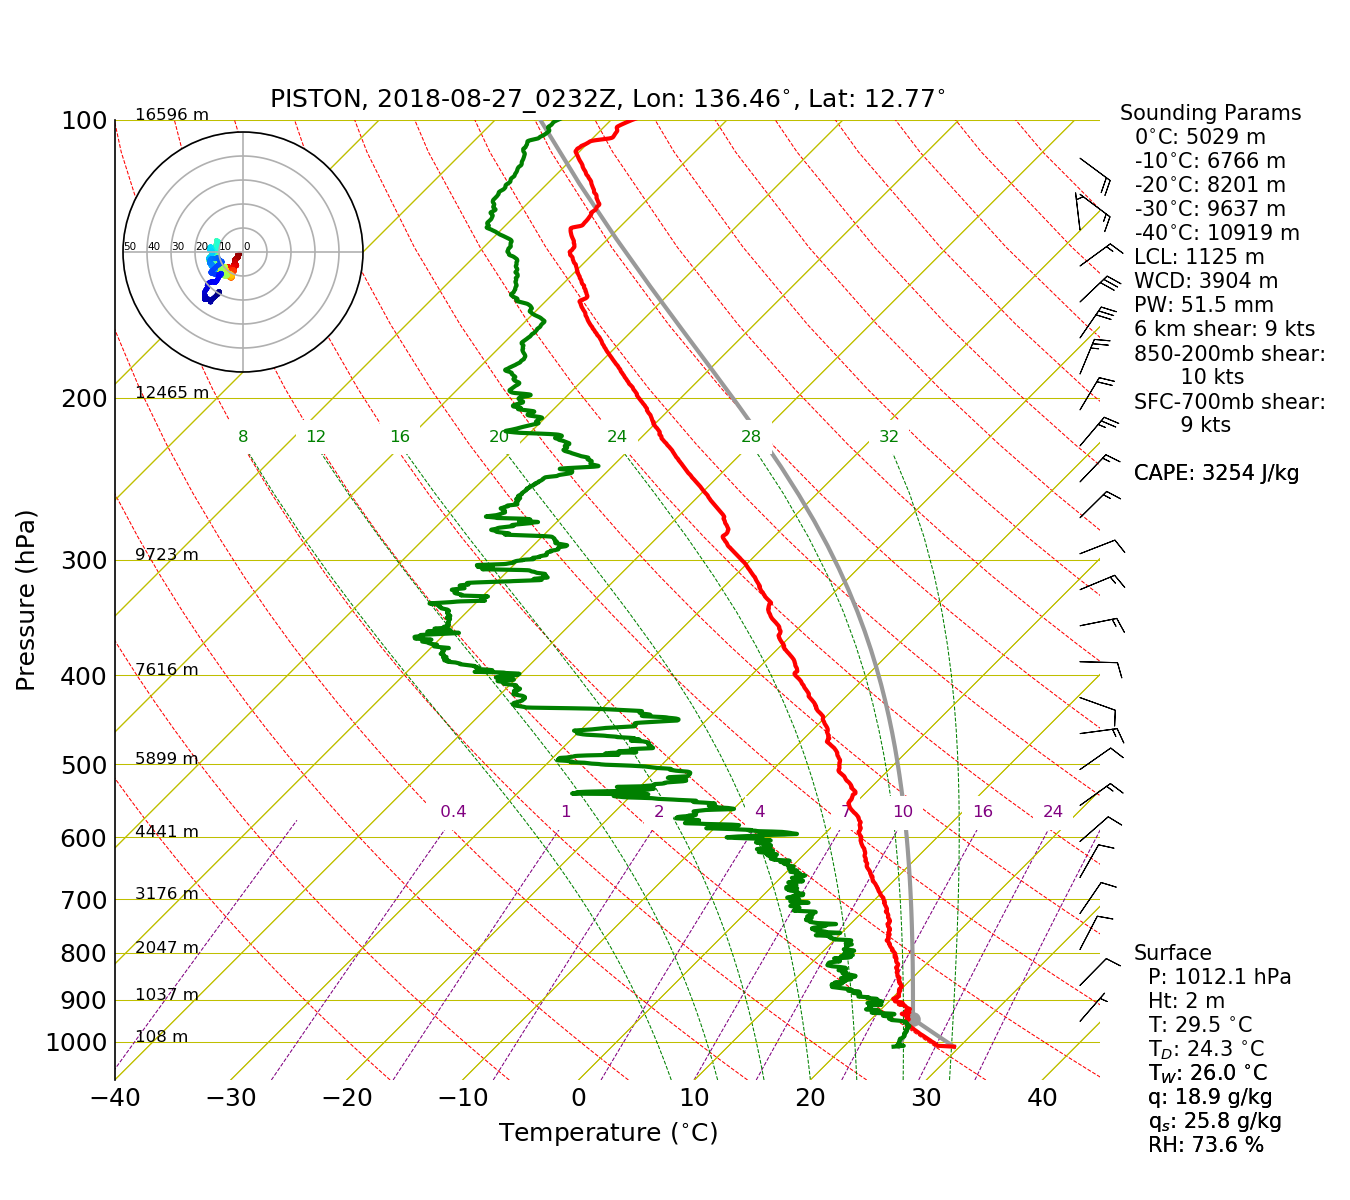
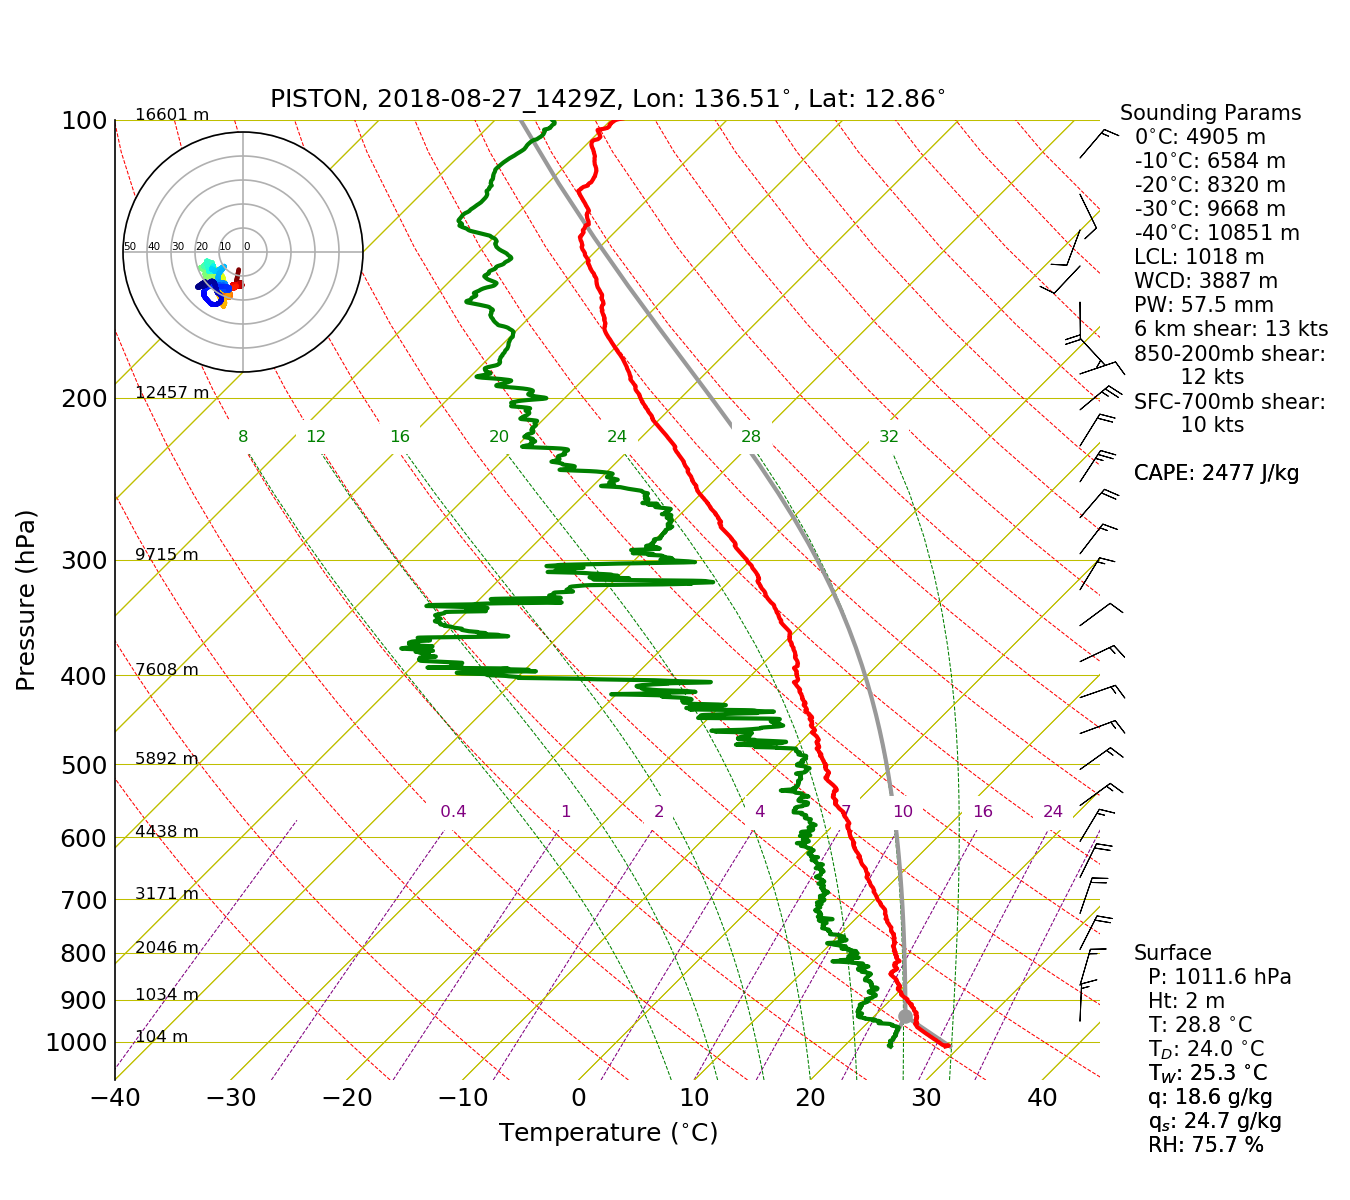
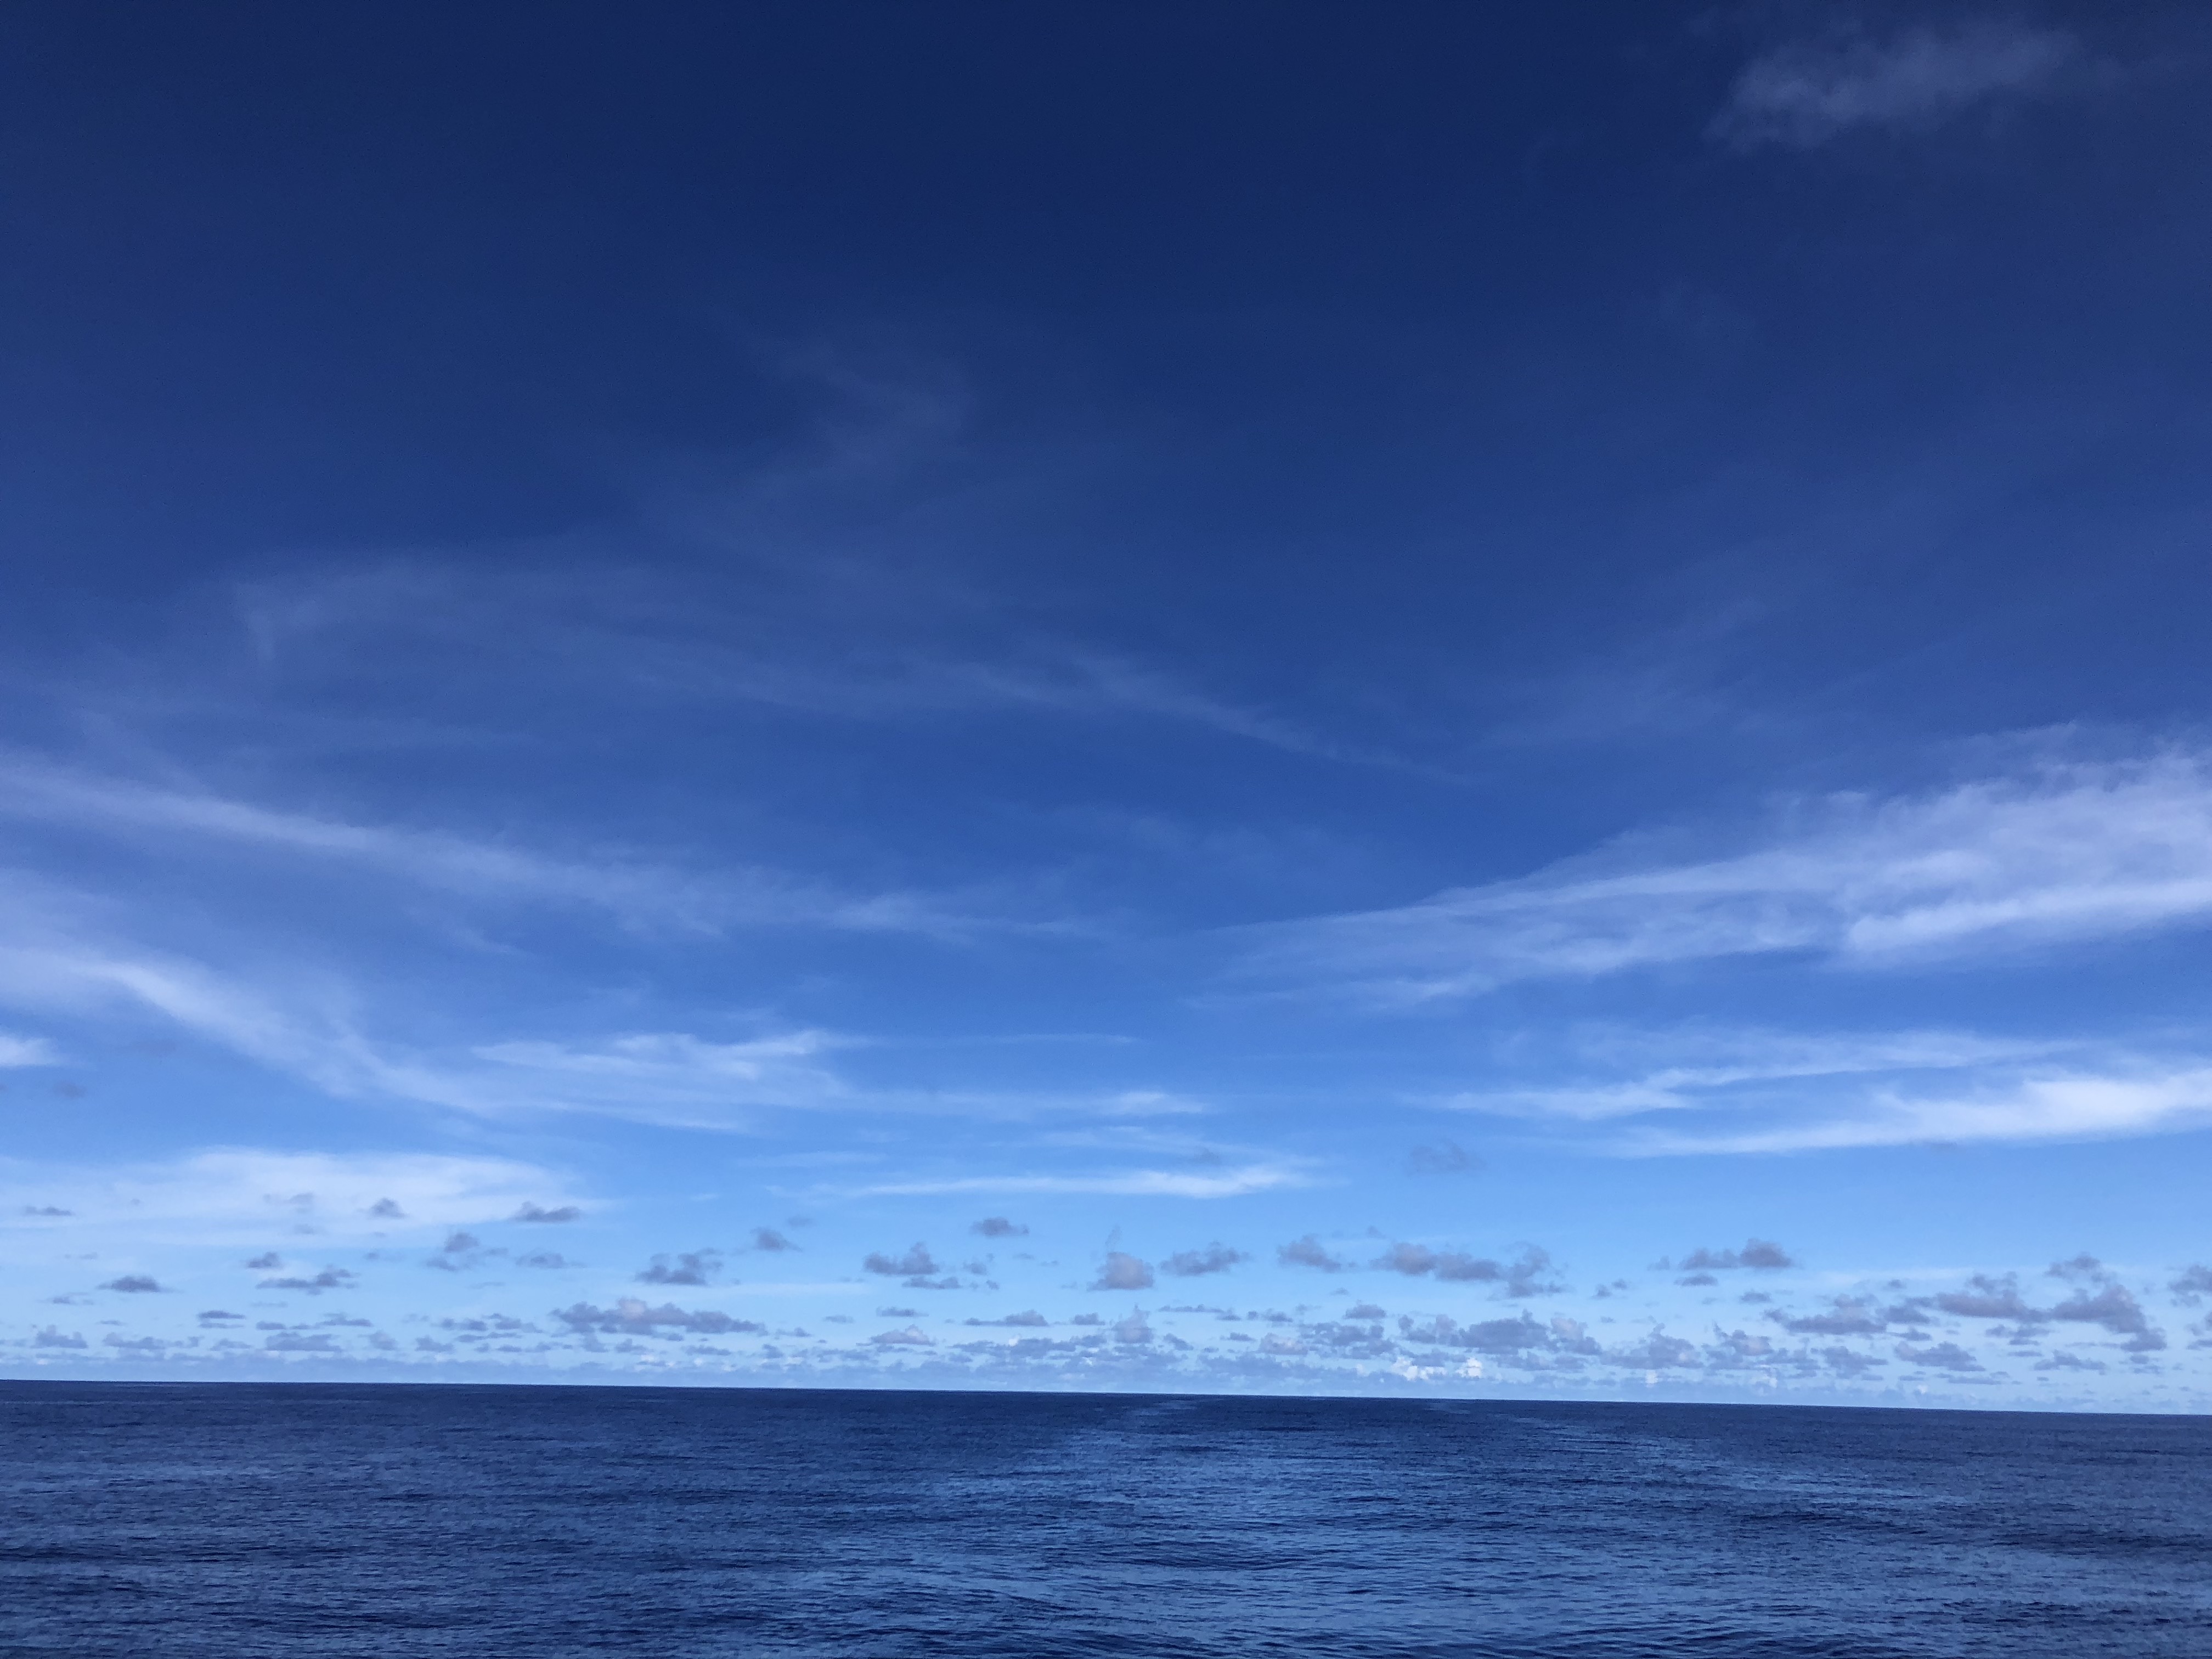
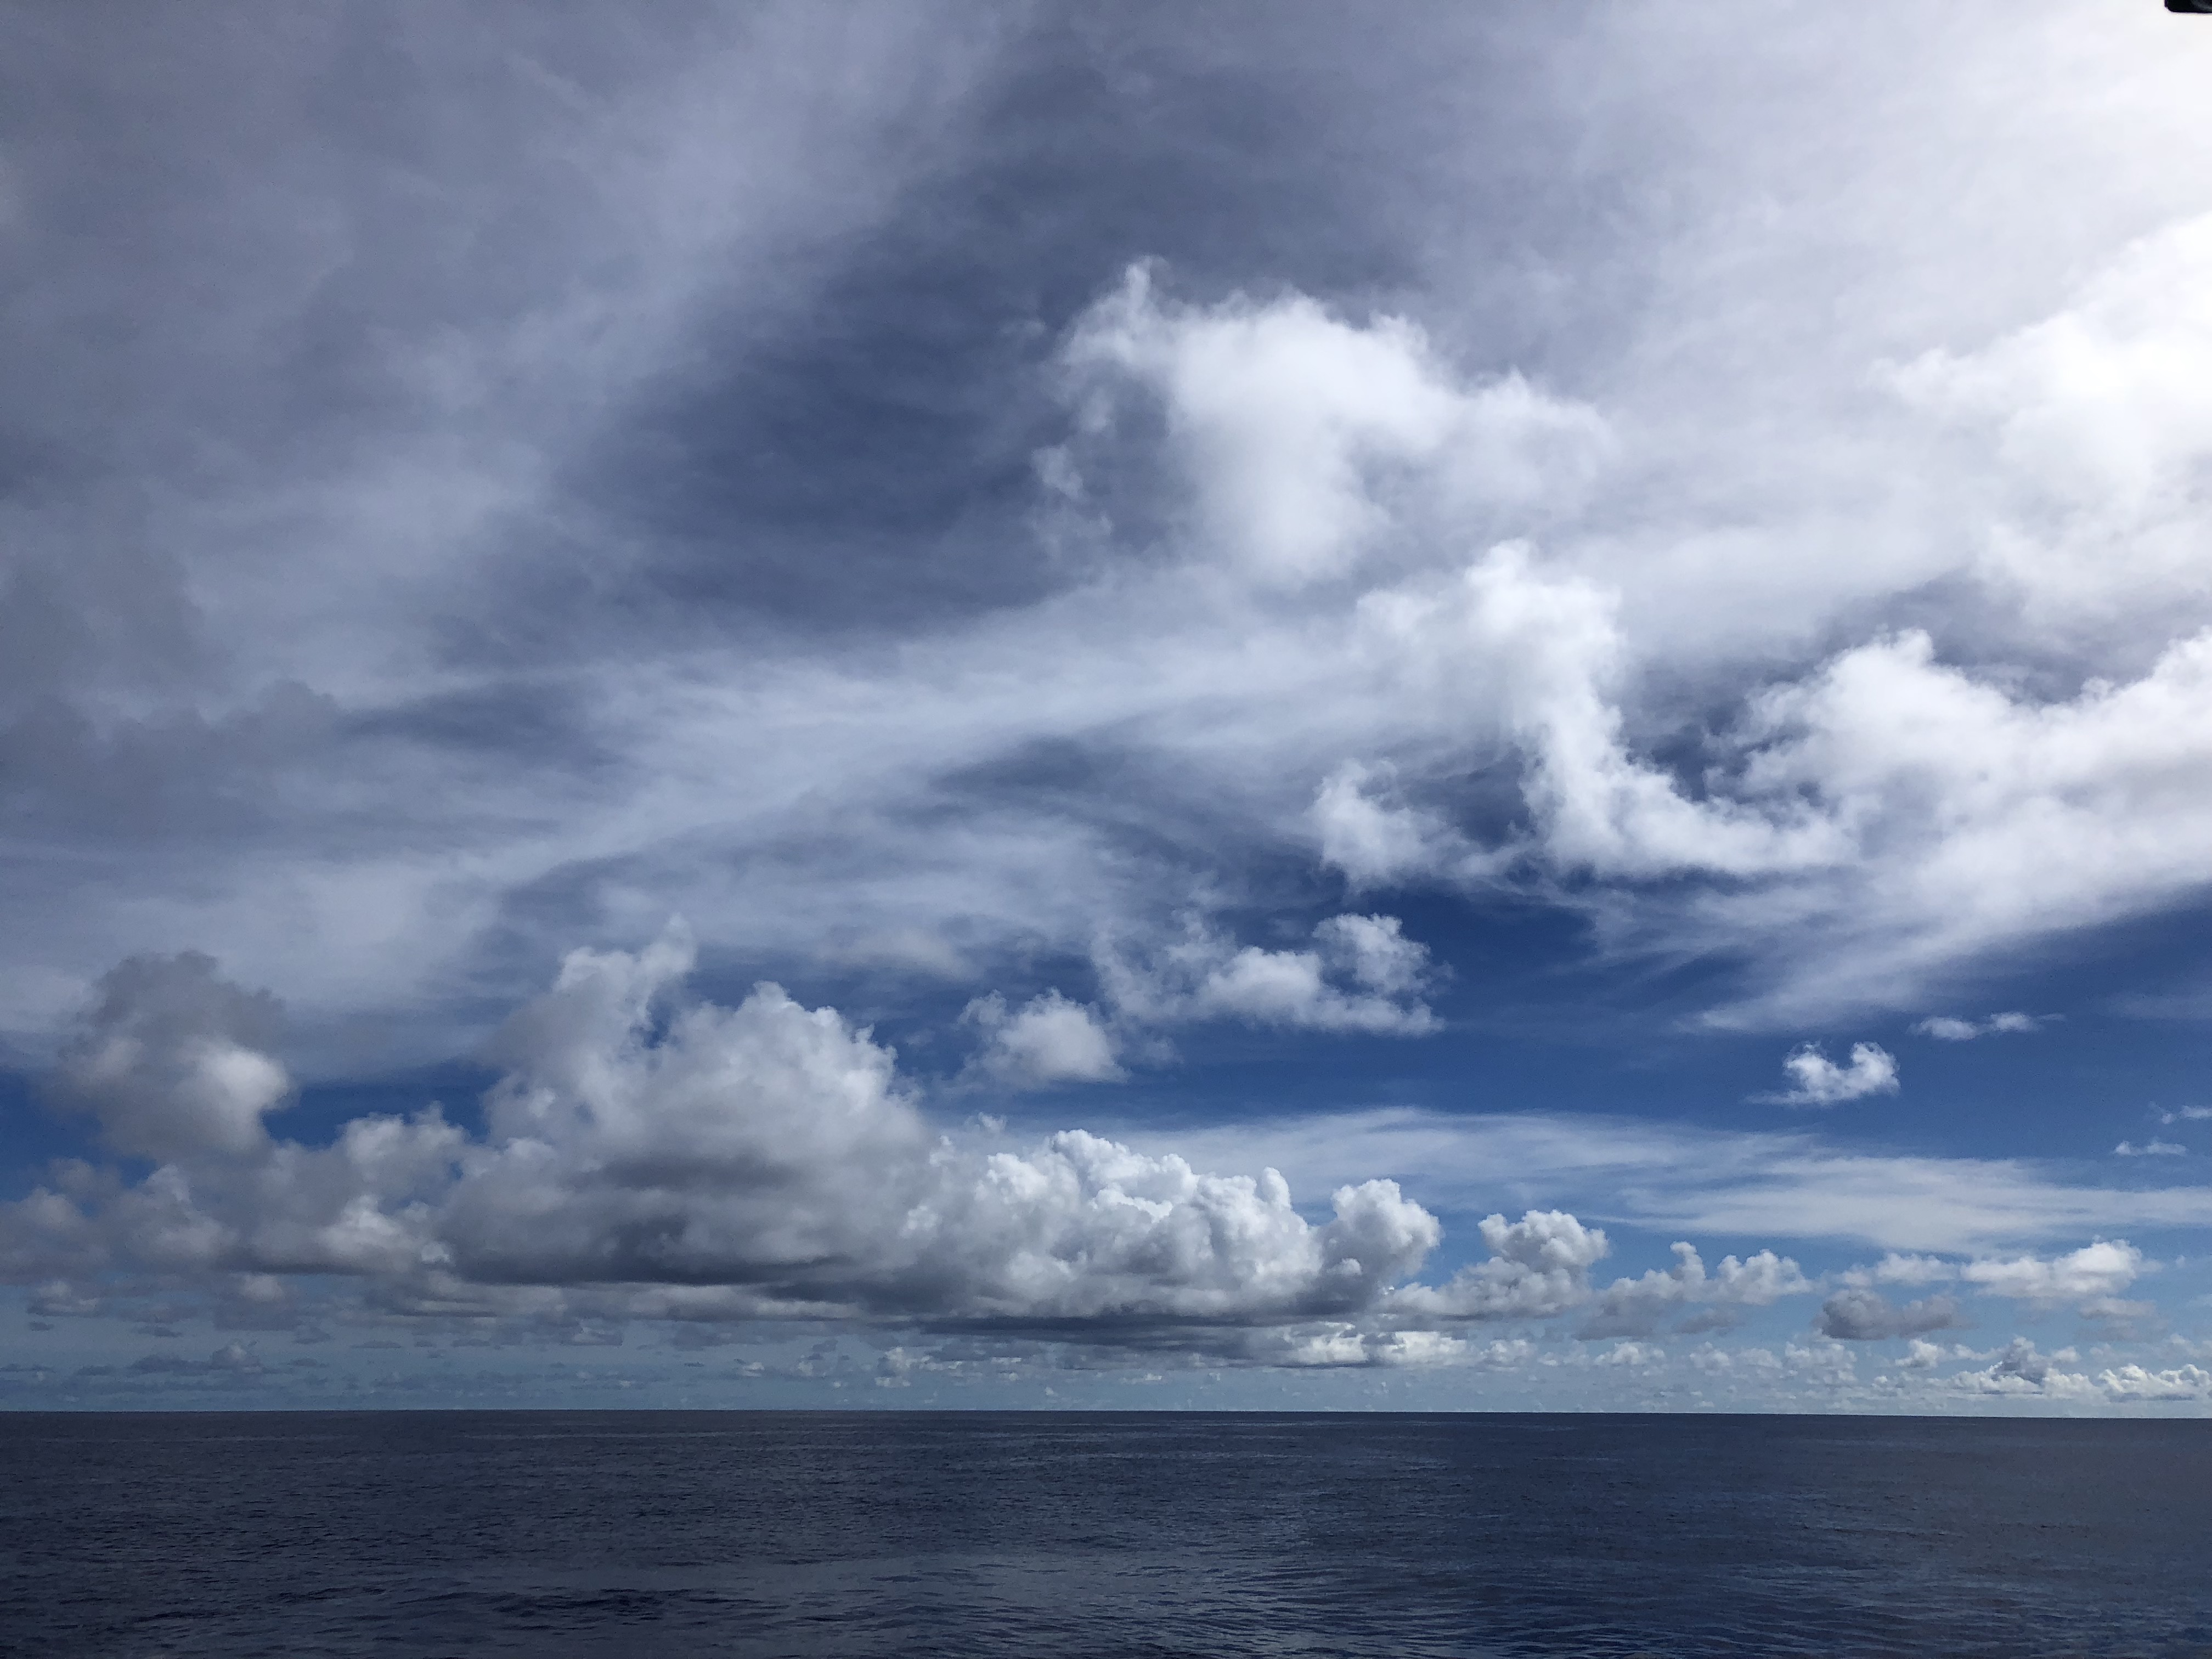
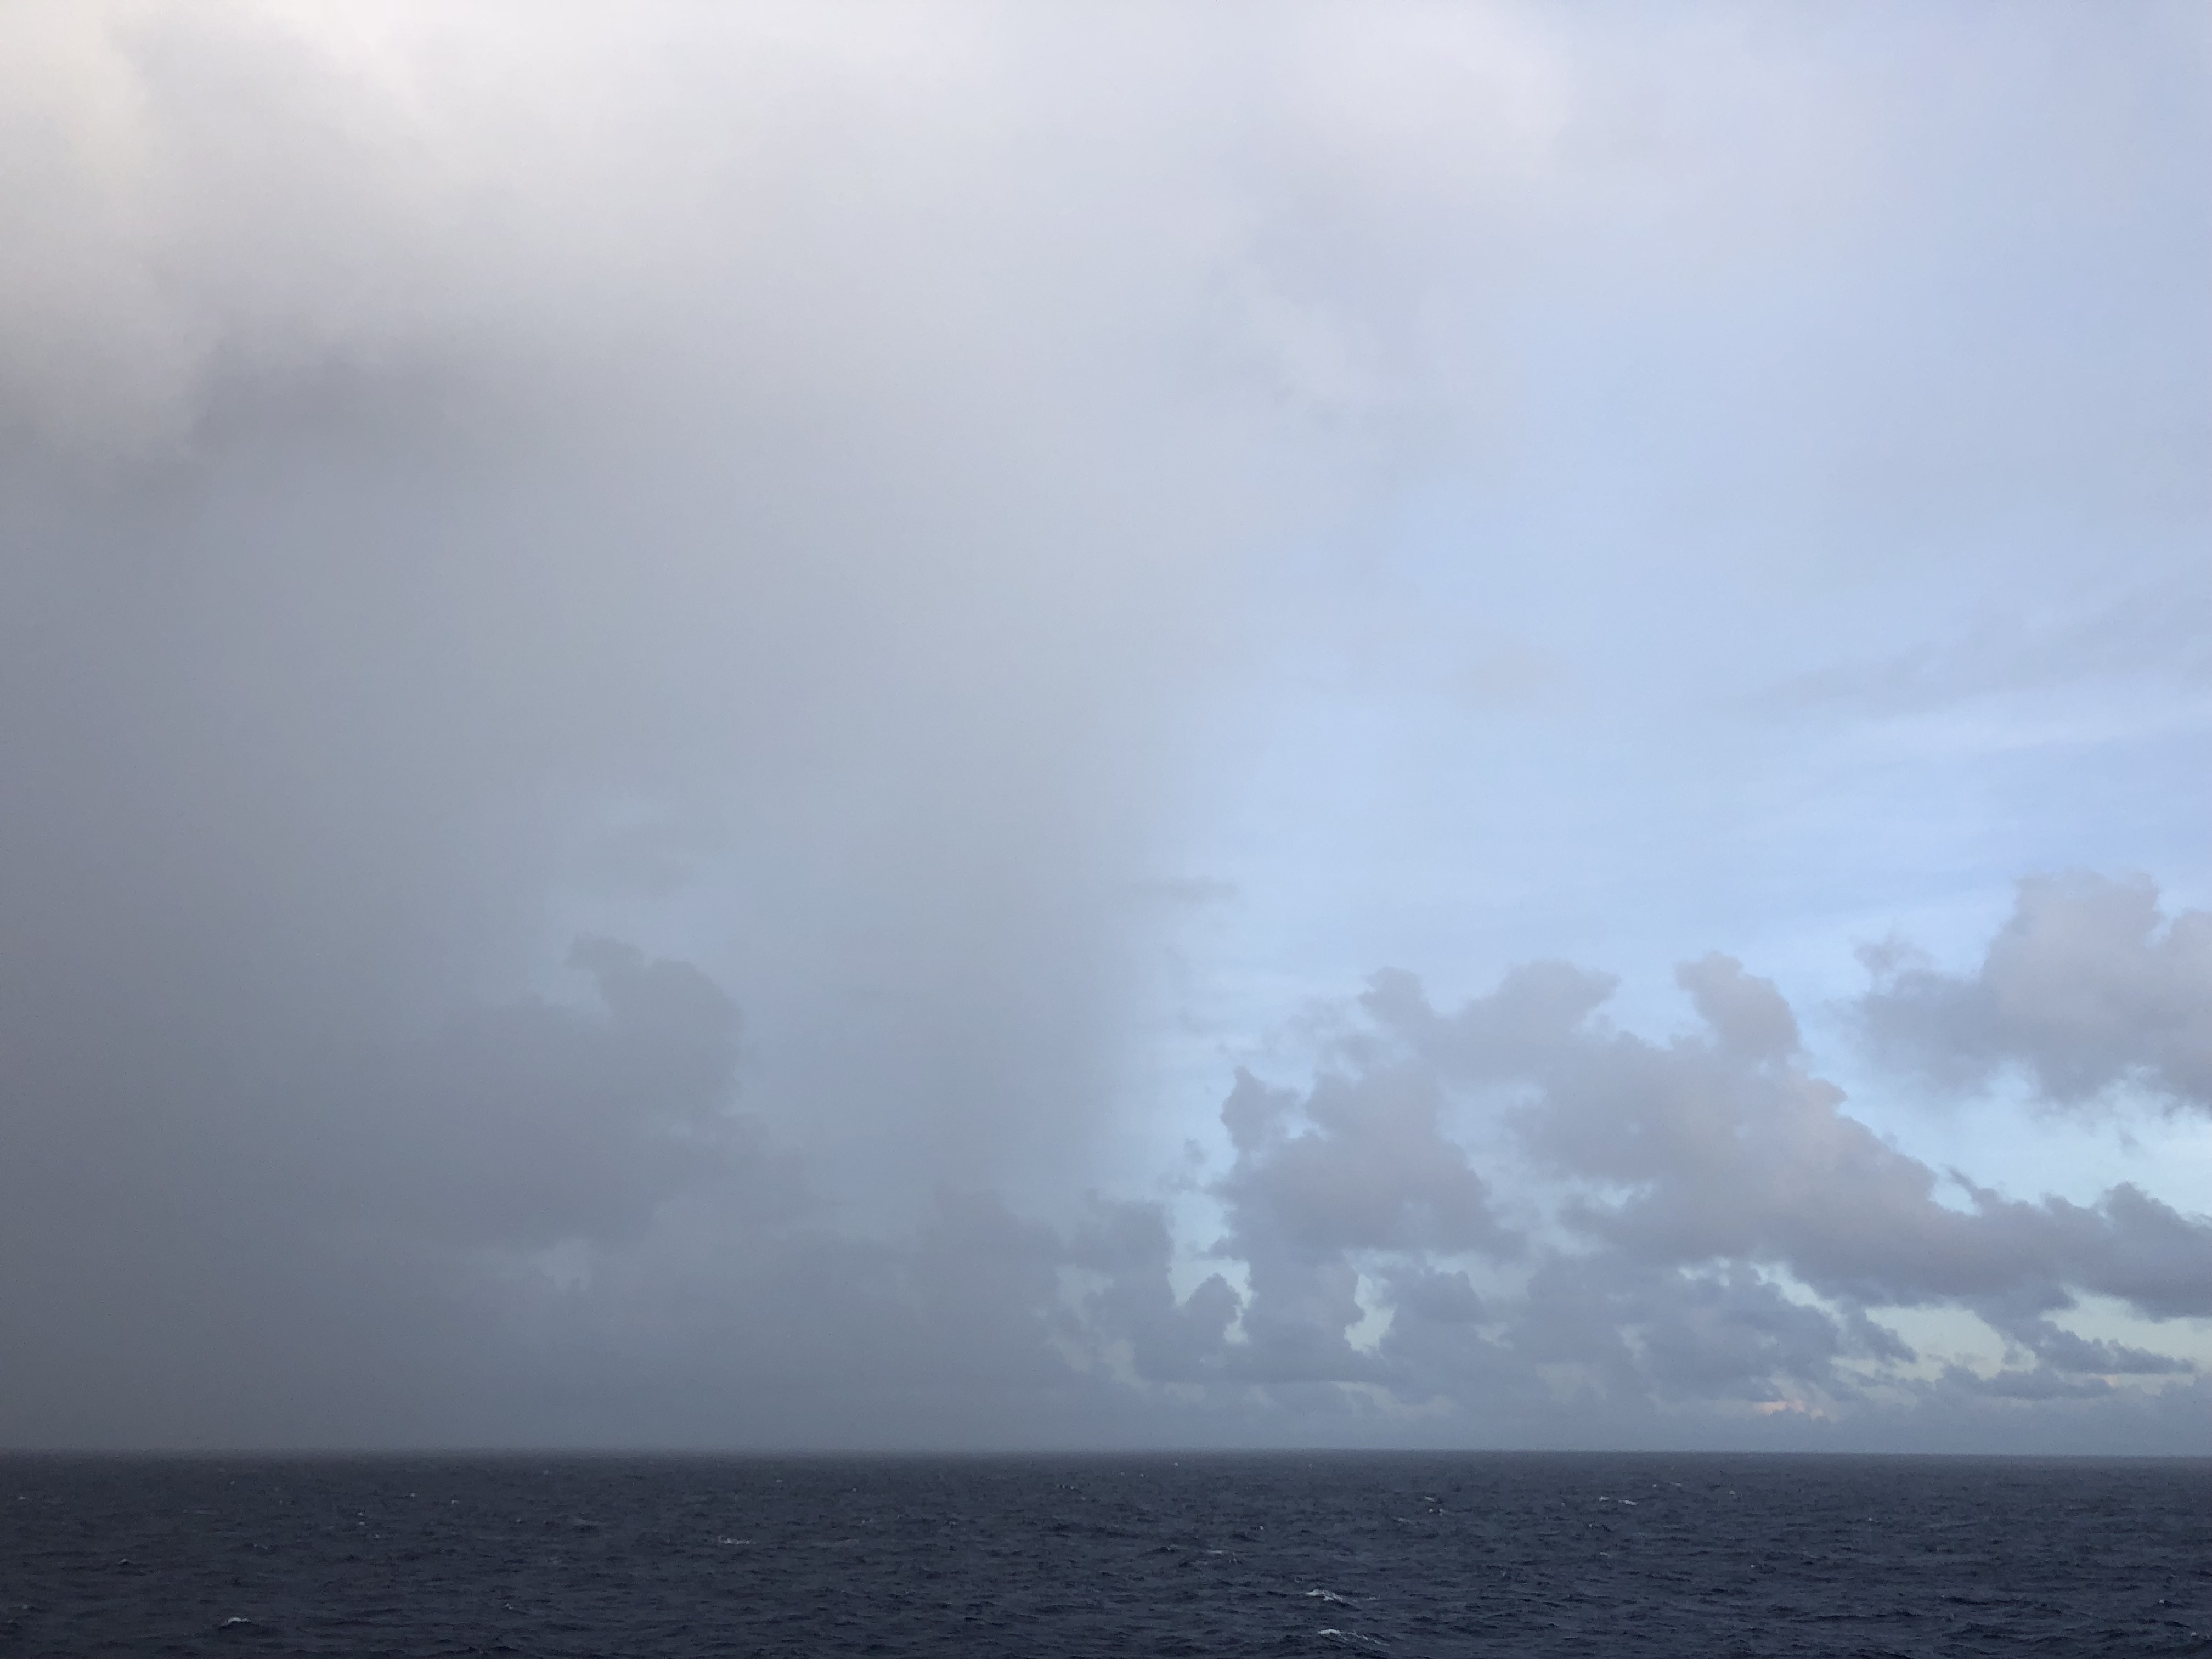
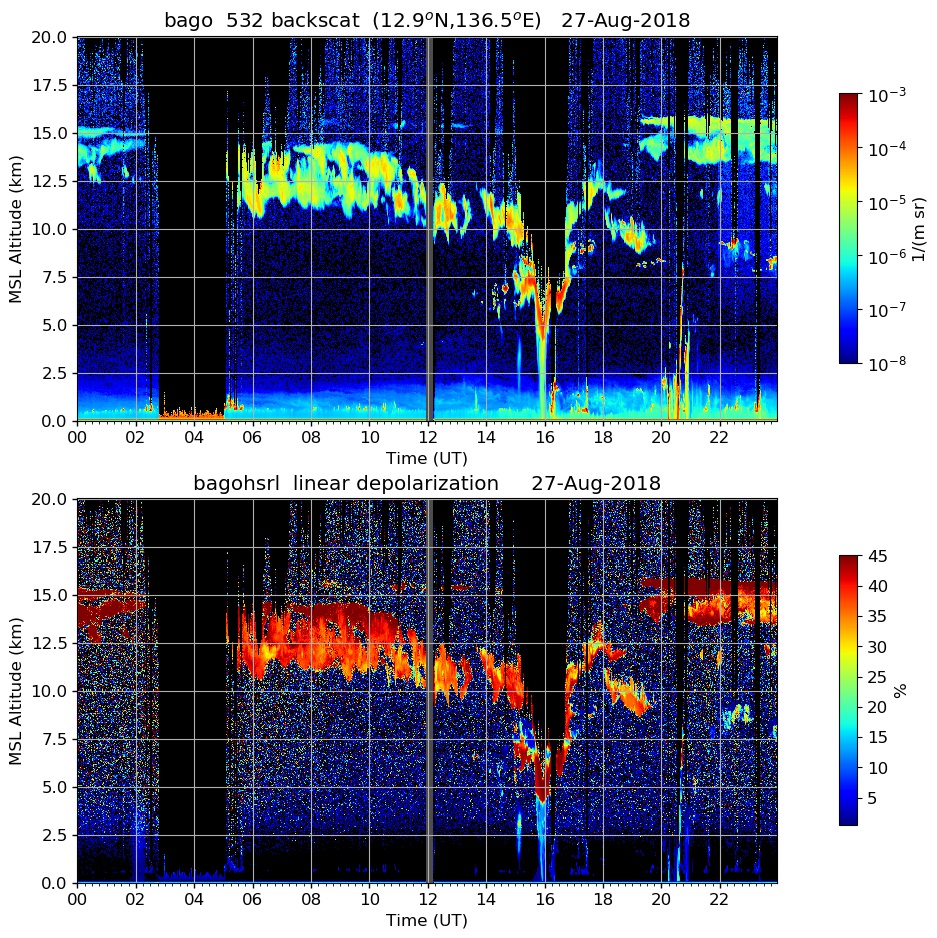
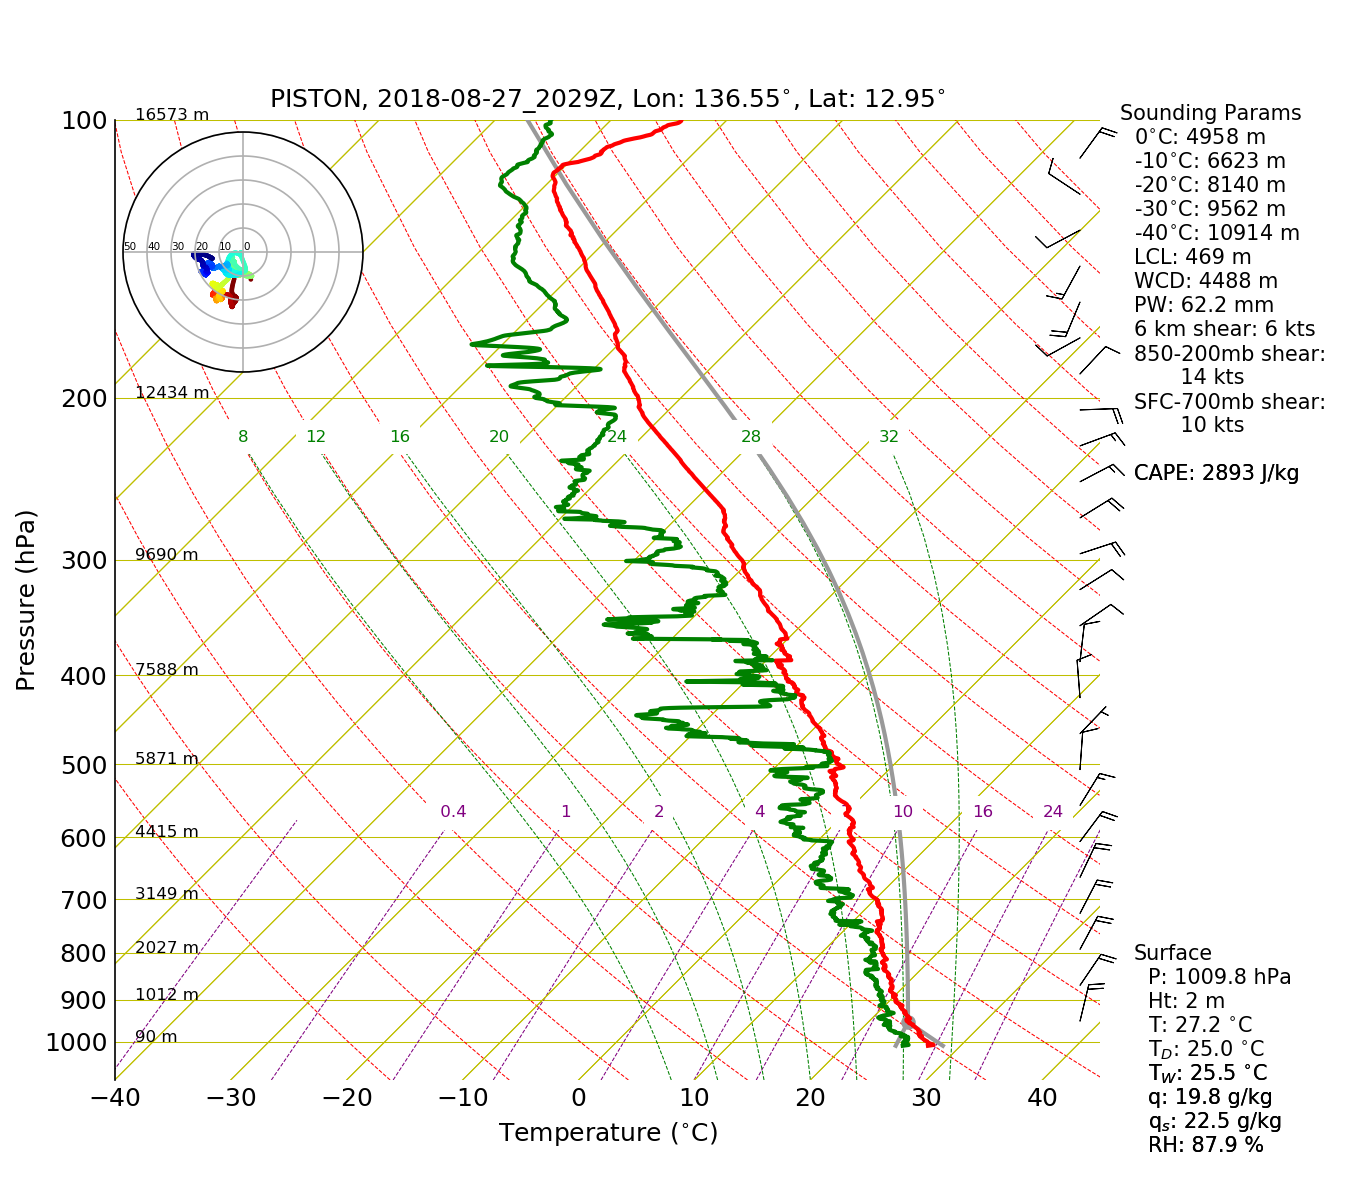
The ship was located on the northern edge of a pocket of dry air extending from the equator to near 15N between 130E and 140E (Figure 3). The 03 UTC sounding (Figure 4) reflected the lack of deep convection over a ~36 hour period. Dry air was present aloft, and drying of the lower-troposphere had begun as well. TPW was down to 51.5 mm. However, by the 15 UTC sounding, the dry layer was confined to between 300 and 400 mb (Figure 5). Cloud photos taken at 00, 03, 06, 09, and 21 UTC (Figure 6) depict the evolution of the cloud population during the day. Scattered cirrus accompanied shallow low-level convection in the morning, and cirrostratus became more prevalent later in the day as humidity in the mid- to upper-troposphere recovered. HSRL backscatter indicated that the clouds were located between 11 and 15 km until 12 UTC, but after rain in the nighttime, cirrus were present between 14 and 16 km (Figure 7). The 21 UTC sounding (Figure 8) shows a moister atmosphere with TPW of around 62 mm.
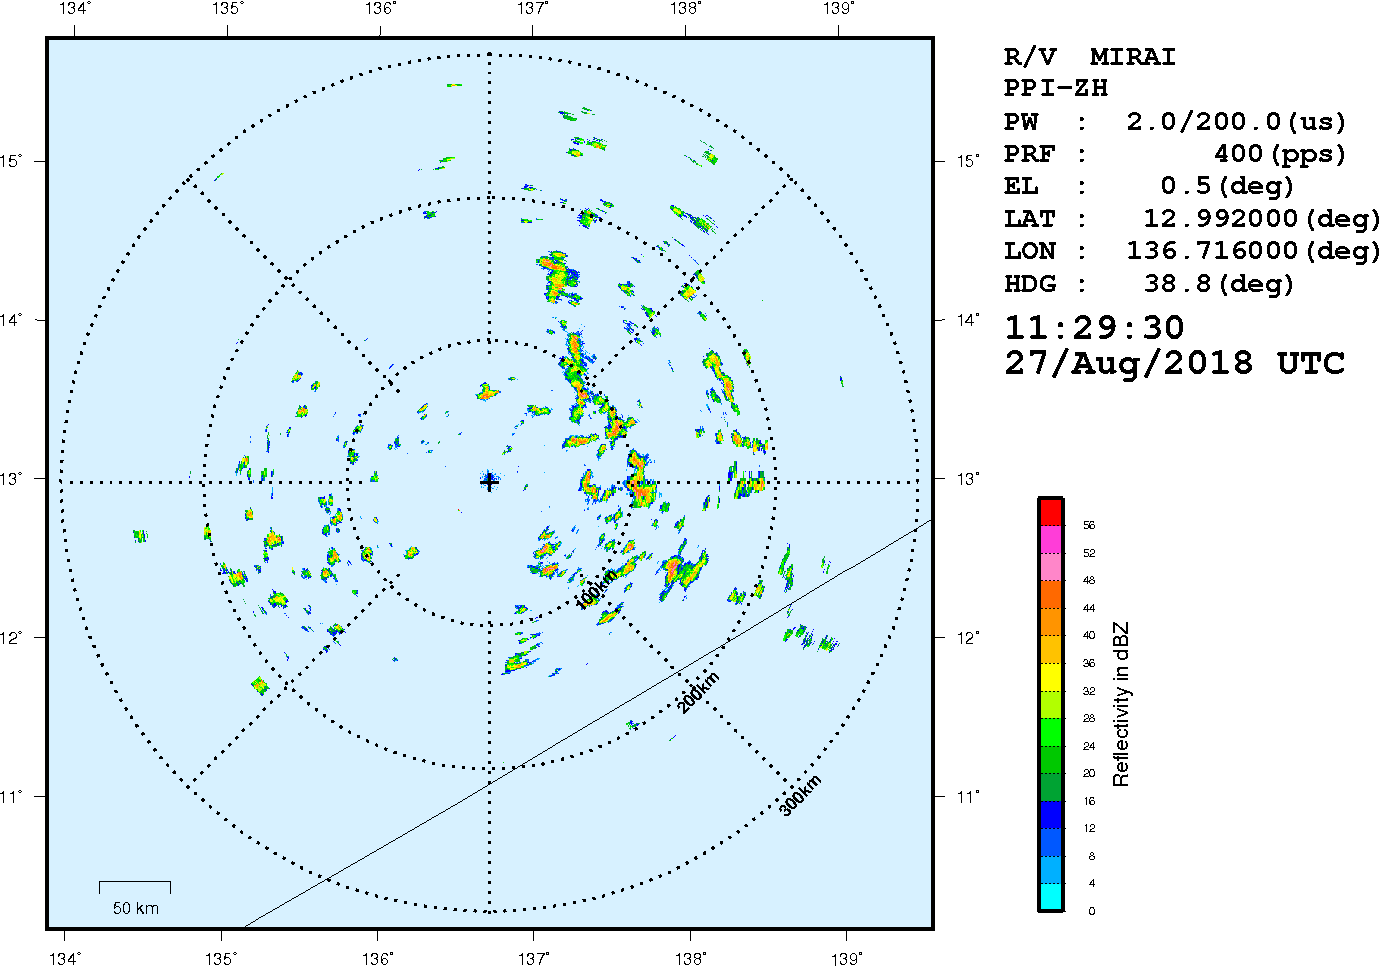
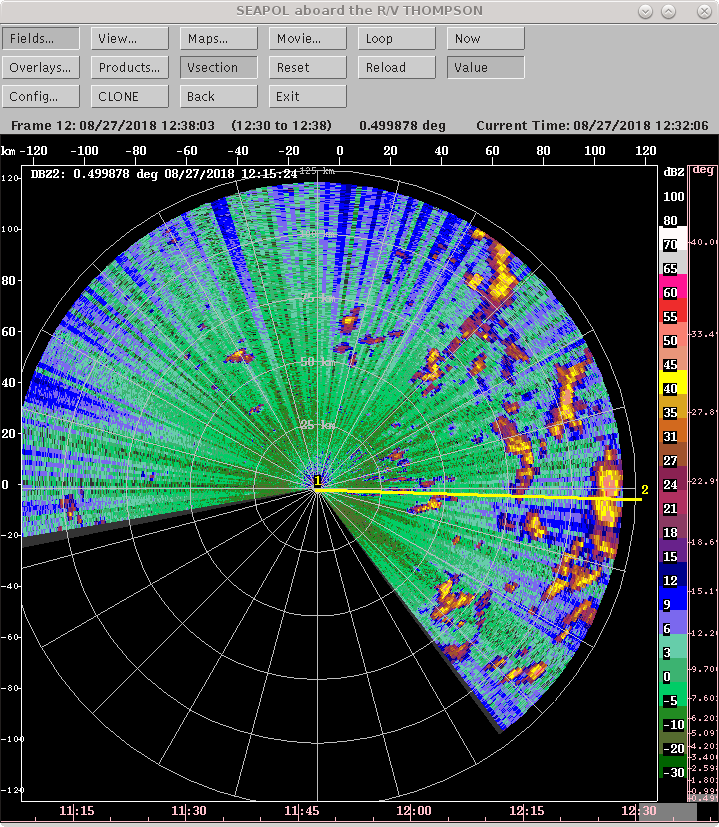
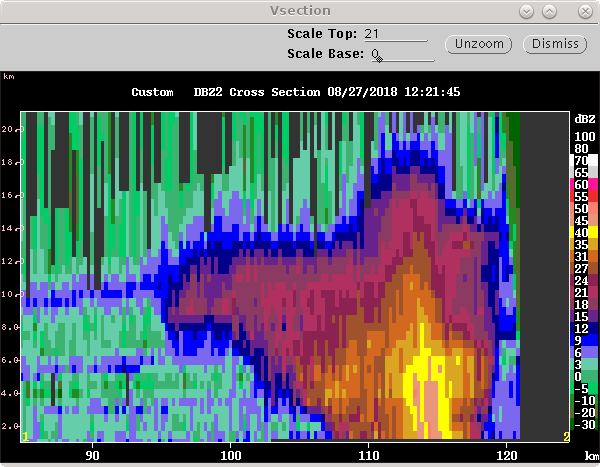
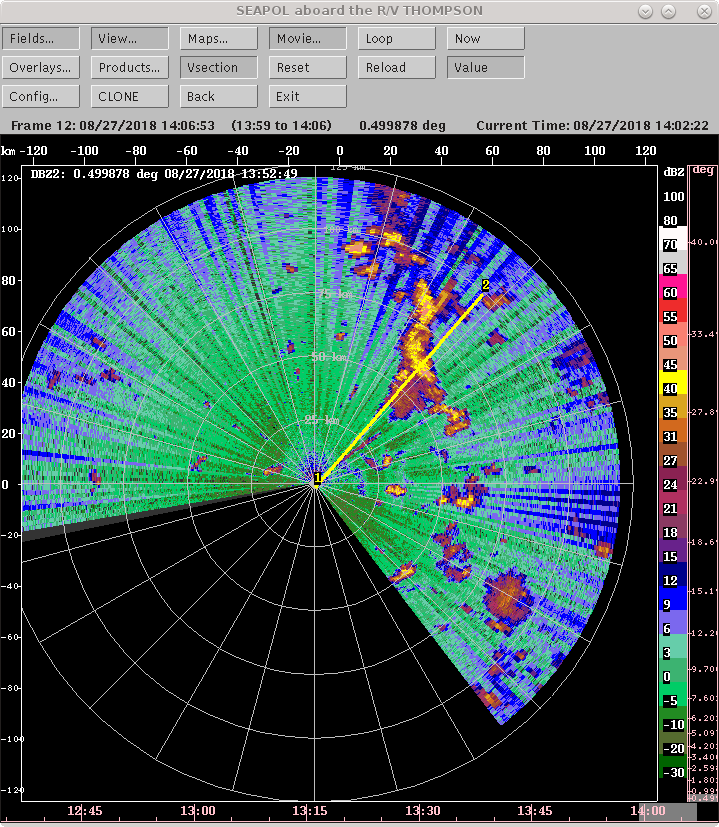
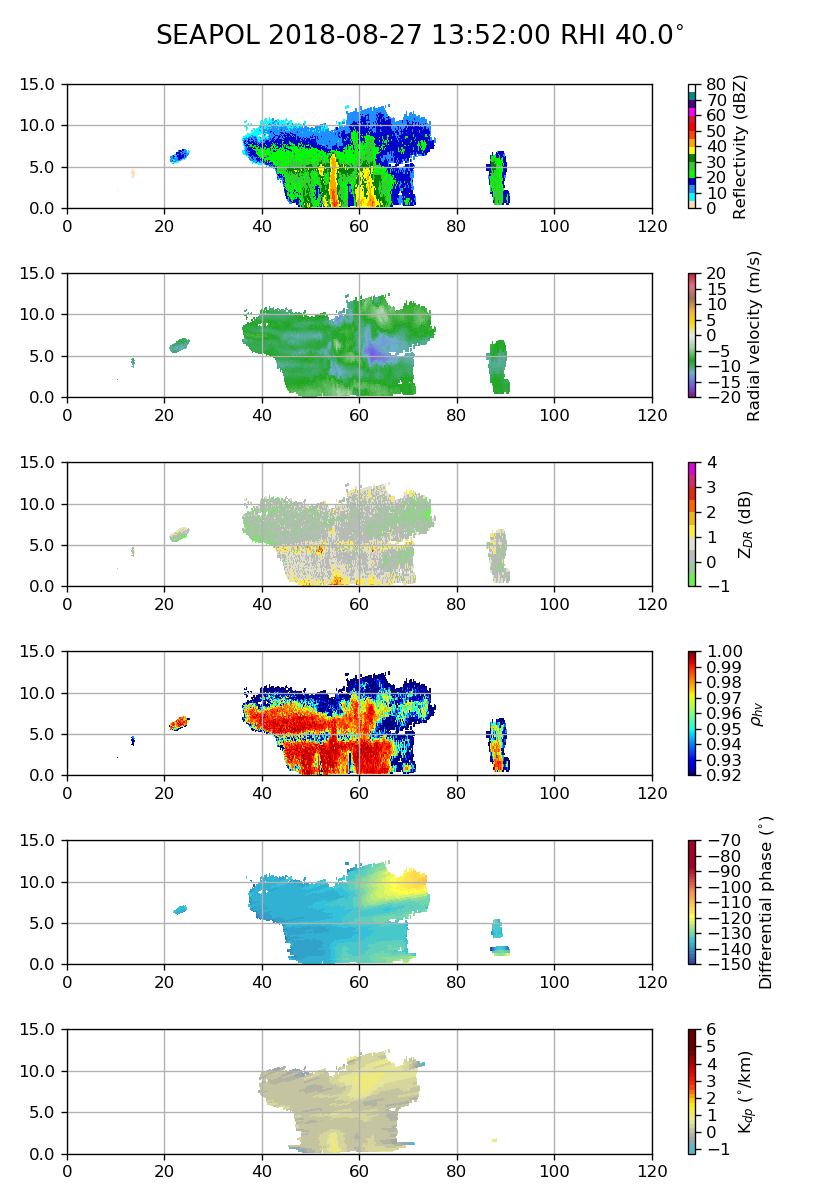
Precipitation echoes with larger areal coverage became visible in the eastern part of the SEAPOL domain around 10 UTC. IR satellite imagery from 1620 UTC is shown in Figure 9. At this time, the precipitation described below had passed through. The Thompson (blue dot) was between two small areas of meridionally oriented cold cloud tops. Without successive images, which are hard to retrieve on the ship in the field, it is difficult to tell how these small features evolved, but one could spectulate that may have been excited by a gravity wave propagating away from the larger region of convection farther to the east. The long range surveillance scan from the Mirai (Figure 10) showed widespread isolated convection to the northeast of the radar sites. Some of the convection grew to be quite deep, but individual cells were nonetheless short-lived. One example of a particularly deep echo that penetrated to near 19 km is shown in Figure 11. By the following volume scan, however, the same echo appeared to have no top above 14 km. Much of the convection quickly decayed into remnant stratiform precipitation as it moved south-southeastward. One echo approached the dual-Doppler domain around 14 UTC. The echo developed into a convective line about 35 km long with a small leading region of stratiform rainfall (Figure 12). An RHI through the stratiform region at 1352 UTC is provided in Figure 13. A convective core is seen to penetrate through a stratiform region, and mid-level inflow is seen in the rear of the echo. However, by the time the echo moved through the dual-Doppler sectors, it had largely decayed. Scattered isolated convection remained in the domain through the remainder of 27 August.
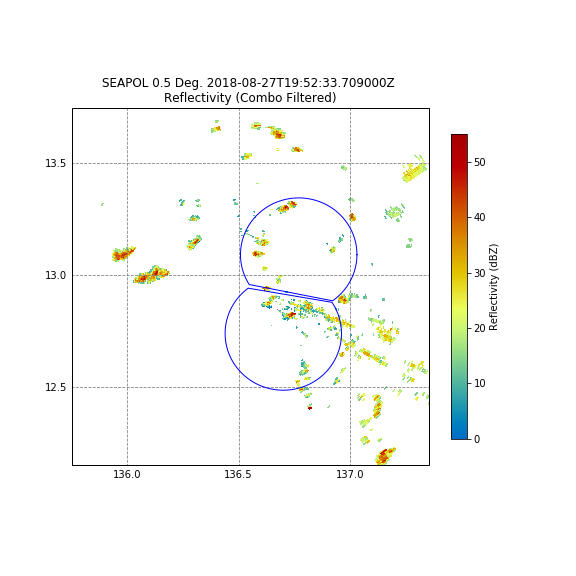
An example of isolated convection in the dual-Doppler lobes with Mirai is shown in Figure 14.