August 28, 2018
Storm Chasing on a Boat: A Developing Mesoscale Convective System
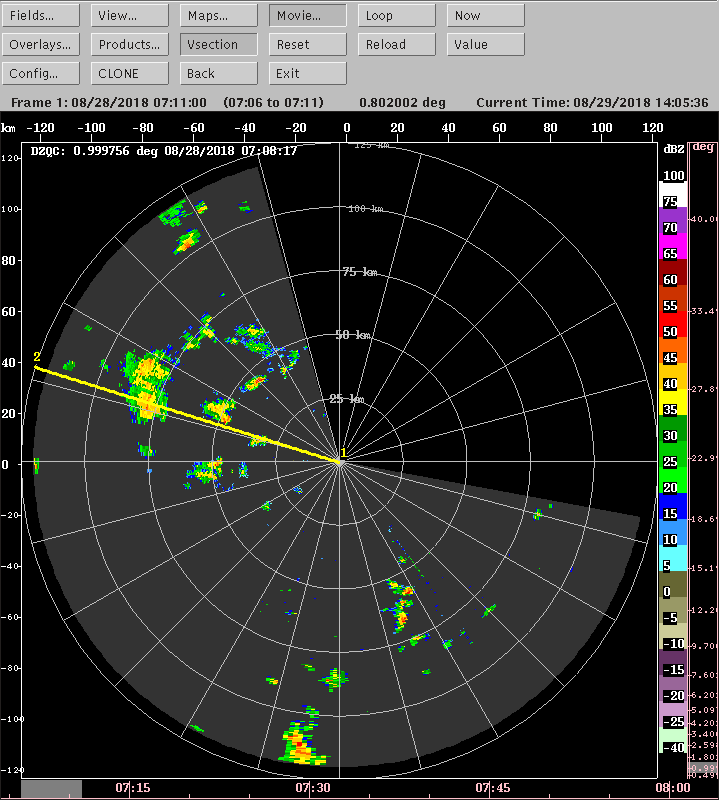
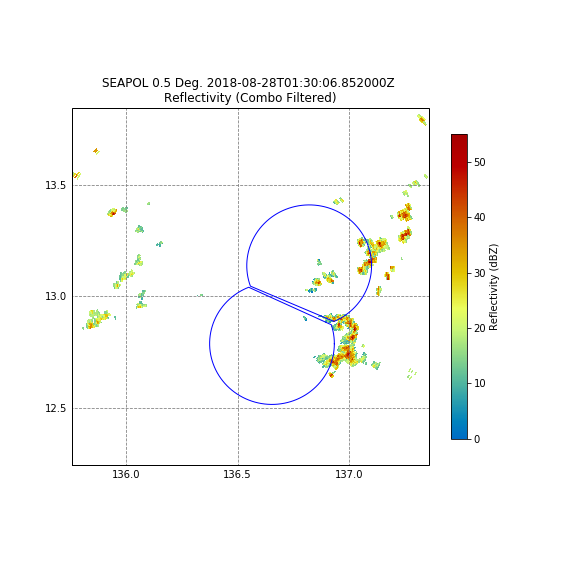
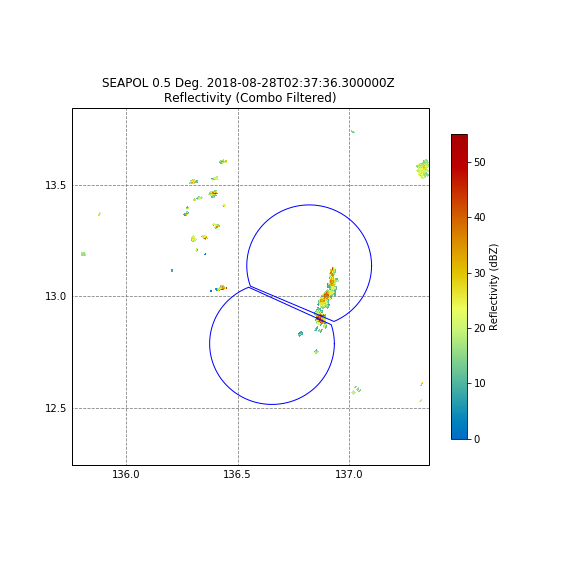
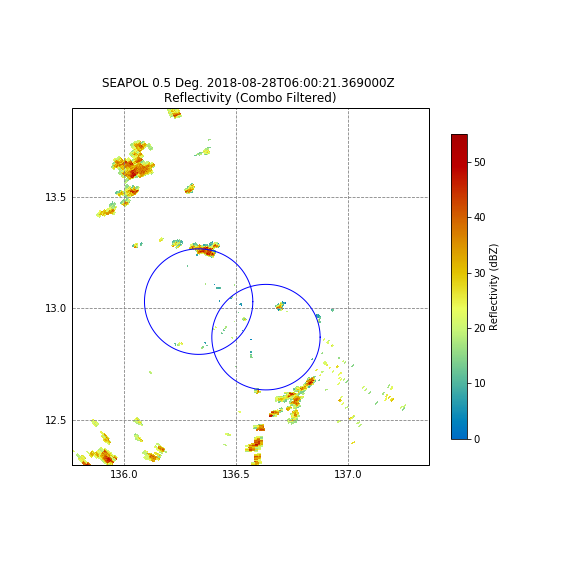
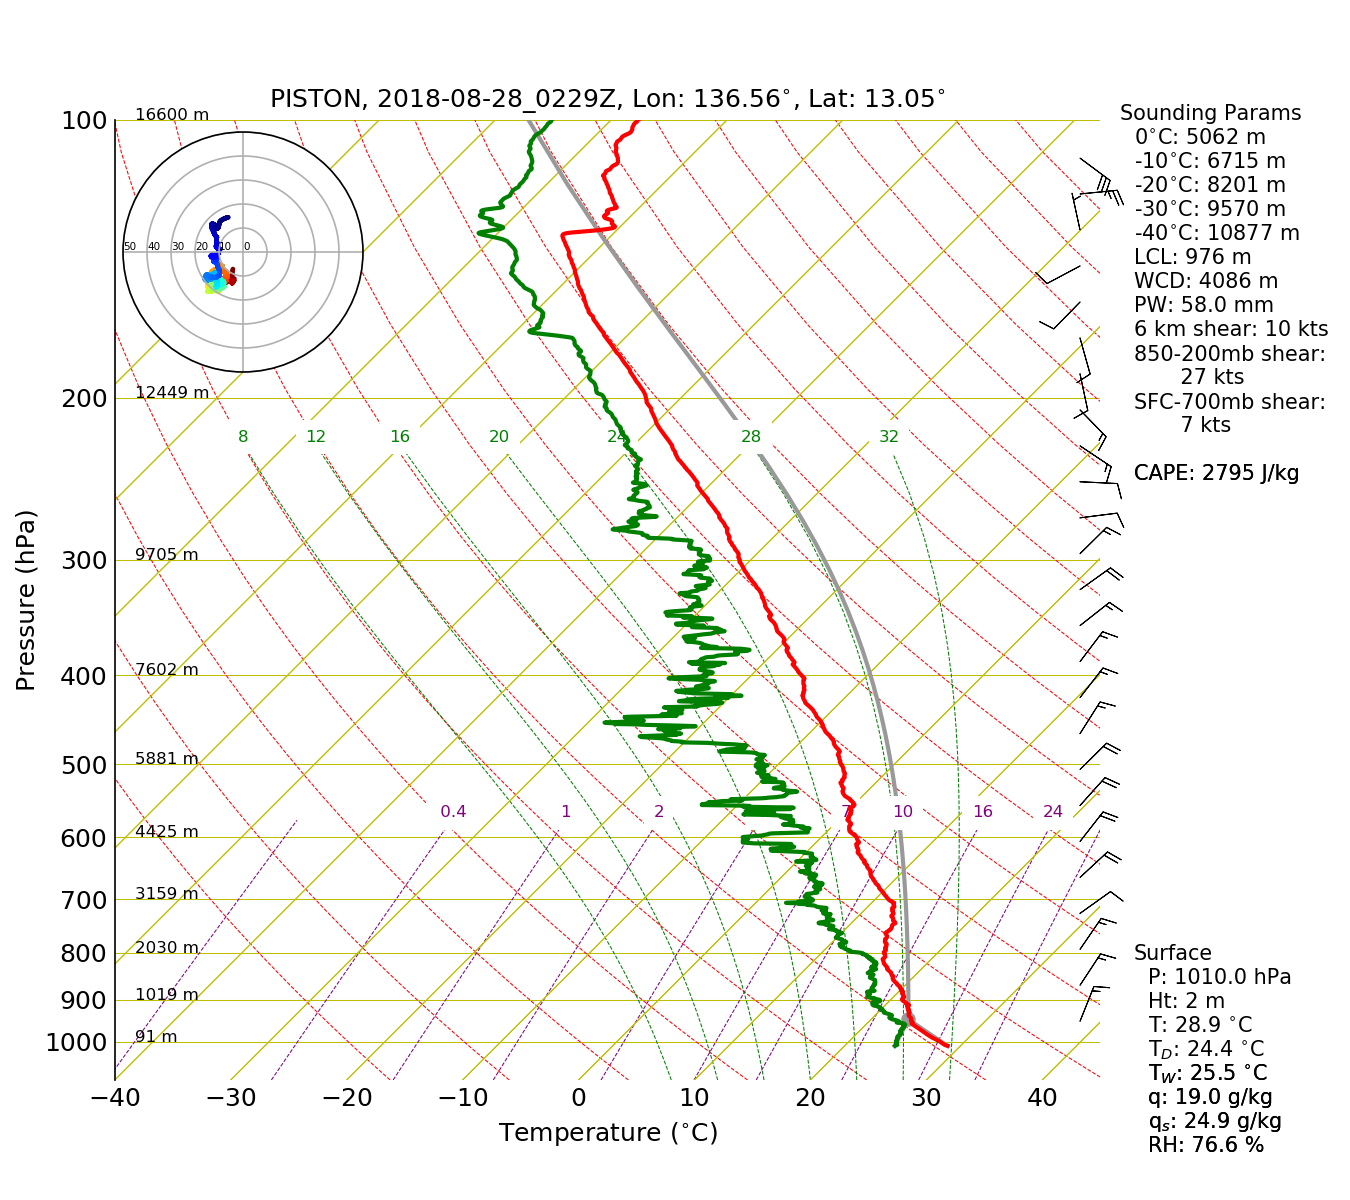
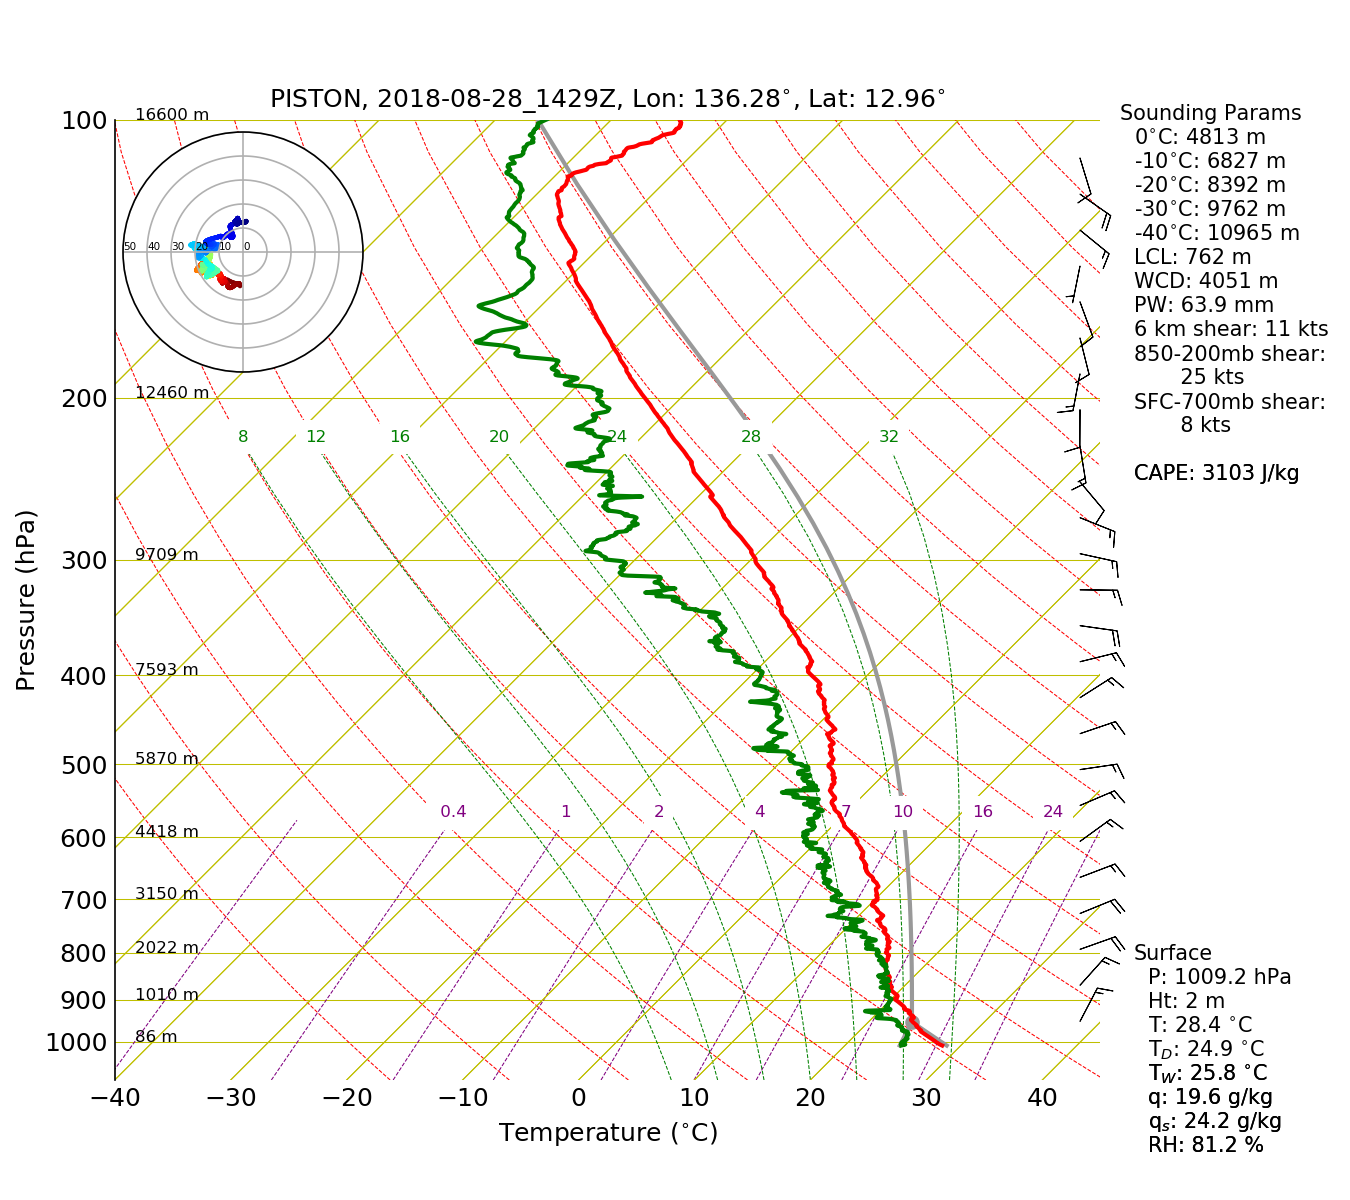
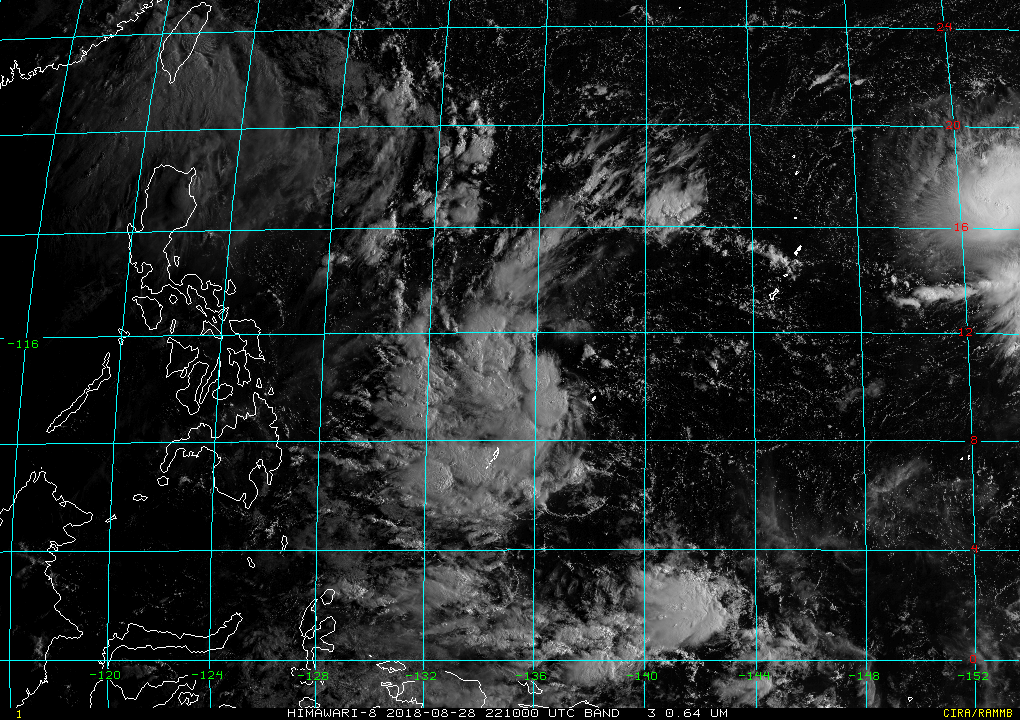
Scott Powell, Timothy Lang, Adam Sobel, Simon de Szoeke, Eric MaloneyScattered isolated convection continued during the first half of August 28, the final day of dual-Doppler operations with the R/V Mirai. A few echoes grew into deep convection that were sheared by southeasterly flow (Figure 1). A few others grew into targets viable for dual-Doppler analysis (Figure 2). Dual-Doppler observations ended at 12 UTC as both ships left the area (around 13N, 136.5E), then convection immediately exploded over the area as the Thompson cruised toward 12N, 134.75E. Morning visible imagery (Figure 3) showed developing convection to the northeast of the ship, and some of this southwestward moving convection passed within range of SEAPOL prior to 12 UTC. Much of this isolated convection passed by 12 UTC. Figure 4 is an IR image from 1550 UTC, showing several areas of deep convection: One near 13-14N, 136E, which would eventually expand to cover the ship, and two larger areas of cold cloud tops to the south, closer to Palau. Figure 5 shows the soundings at 03, 09, 12, 15, and 21 UTC. An obvious moistening of the column occurs throughout the day: The 21 UTC launch was during stratiform precipitation (and still indicates a dry adiabatic mixed layer resulting in ~2500 J/kg CAPE). Despite the relative dryness indicated by the 09 UTC sounding (51.7mm TPW), long-lived convection and a broad stratiform region were able to develop at night. 15-20 kt northeasterly flow persisted at low-levels throughout the day, and easterlies persisted beneath light upper-tropospheric winds. 20-25 kt southeasterly winds began above 300 mb by 21 UTC. These winds were consistent with a large-scale pattern featuring Tropical Storm Jebi to the east-northeast around 155E, 18N, and a weaker low pressure system south of the ship near Palau. These two features had developed from the broad two-lobed trough evident in preceding days, and are evident in Figure 5a, which shows the 850 hPa GFS analysis at 12 UTC and the MIMIC total column water vapor at 16 UTC.
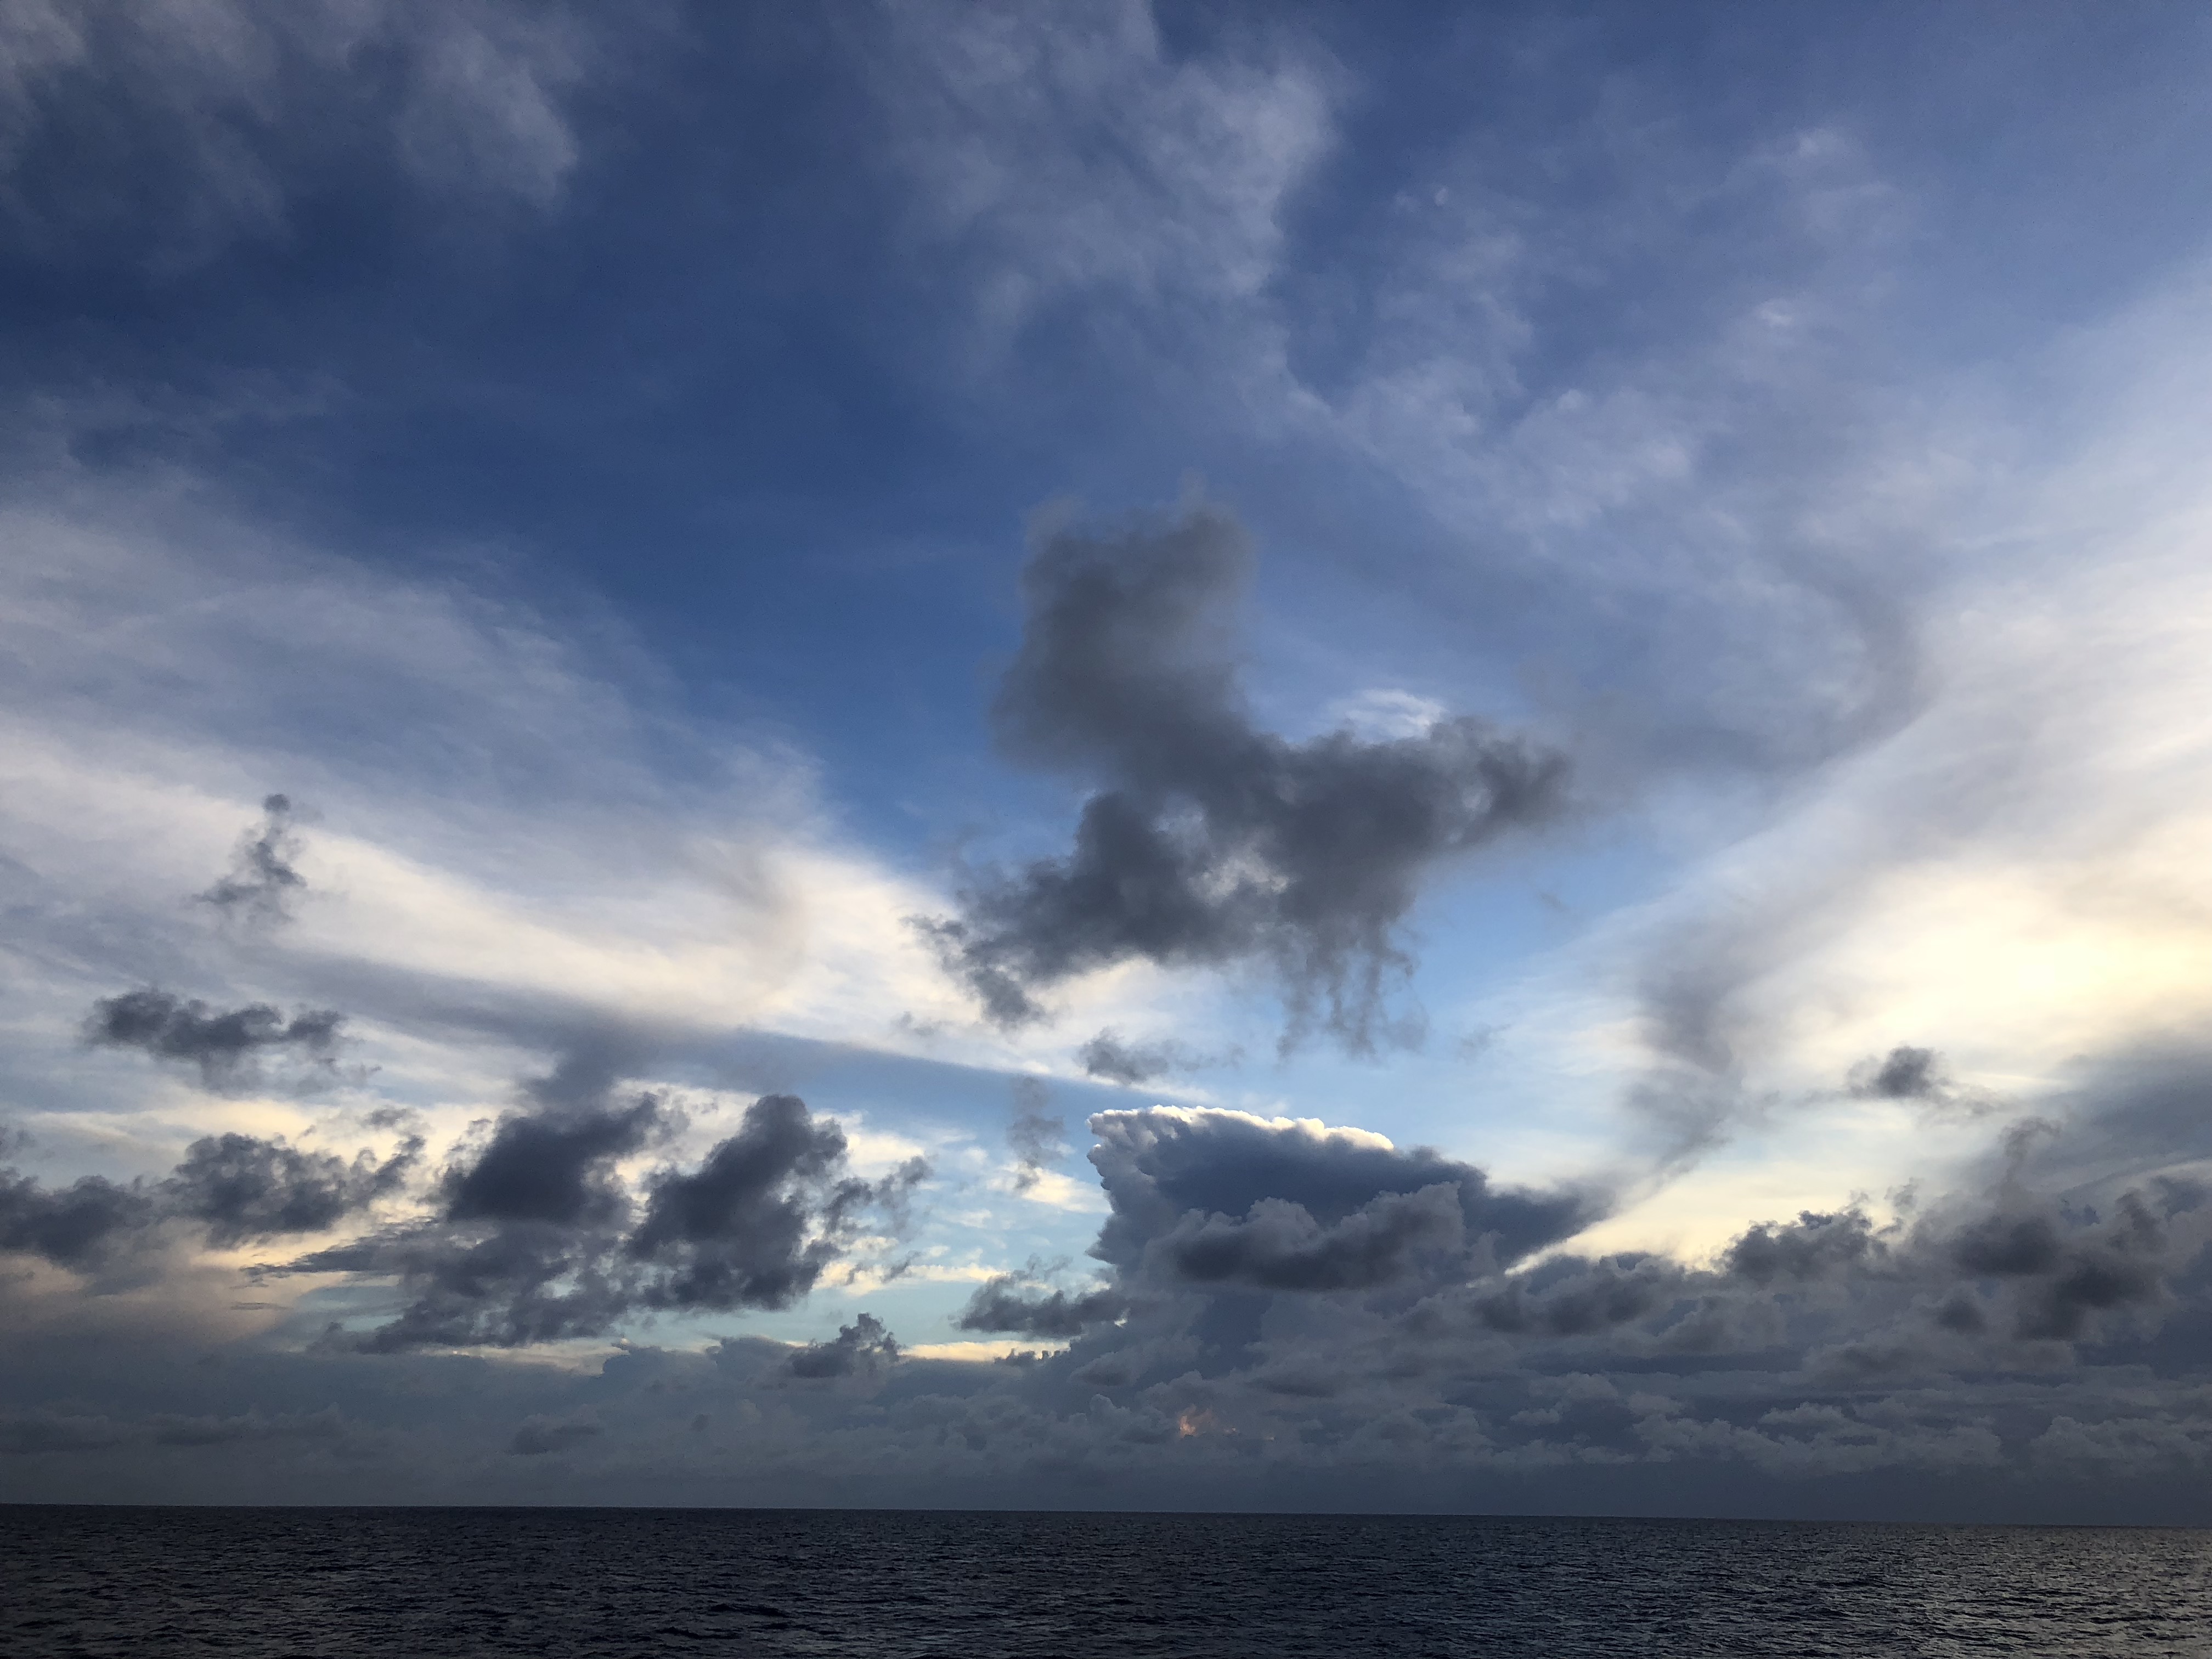
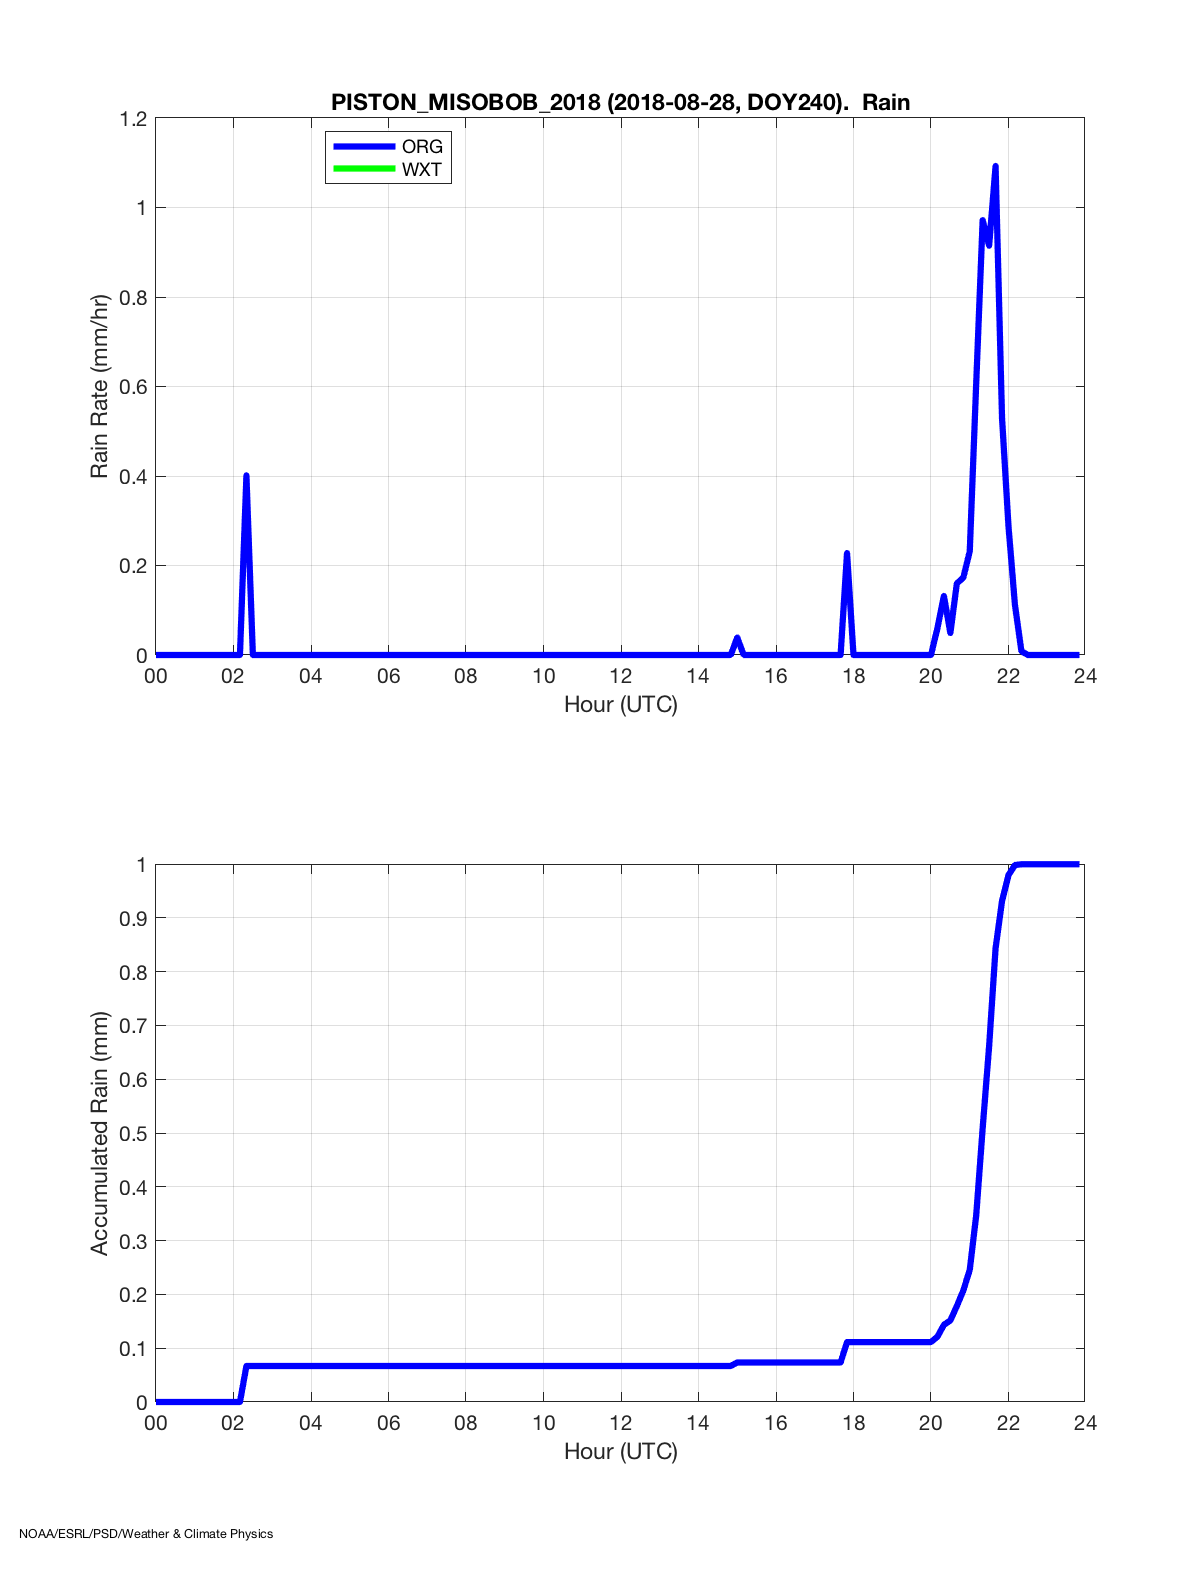
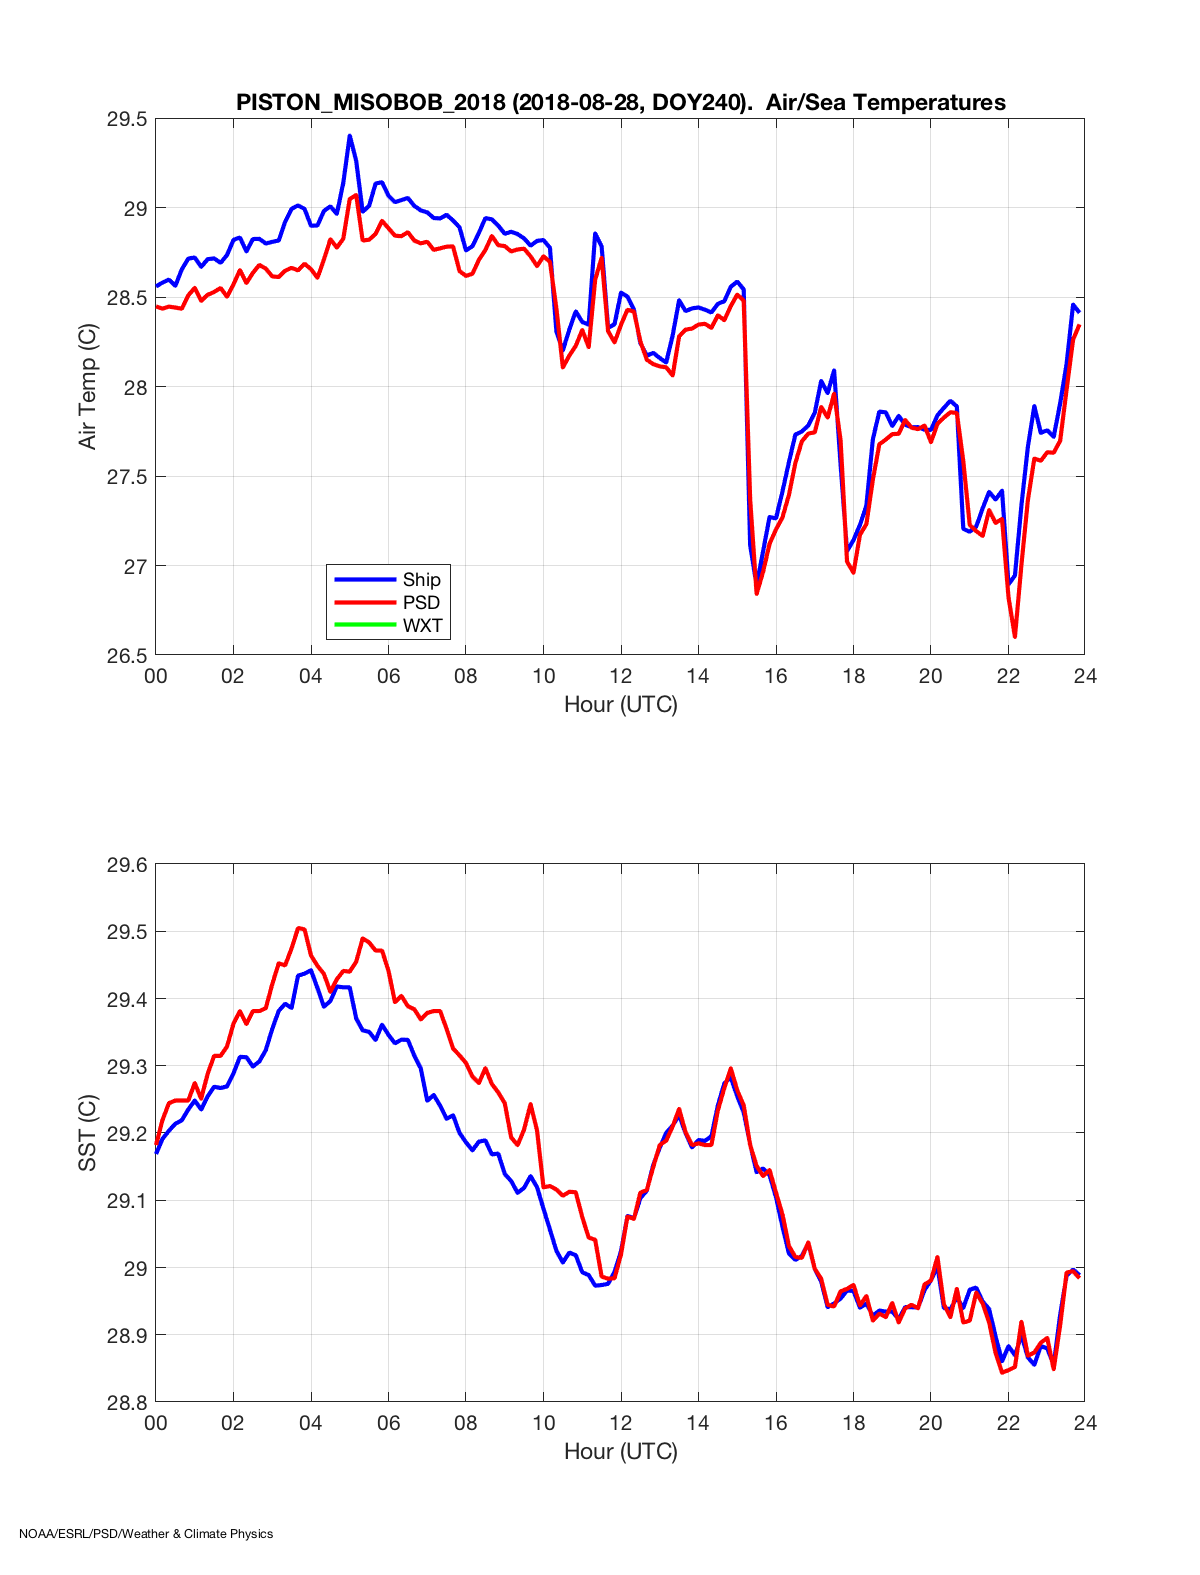
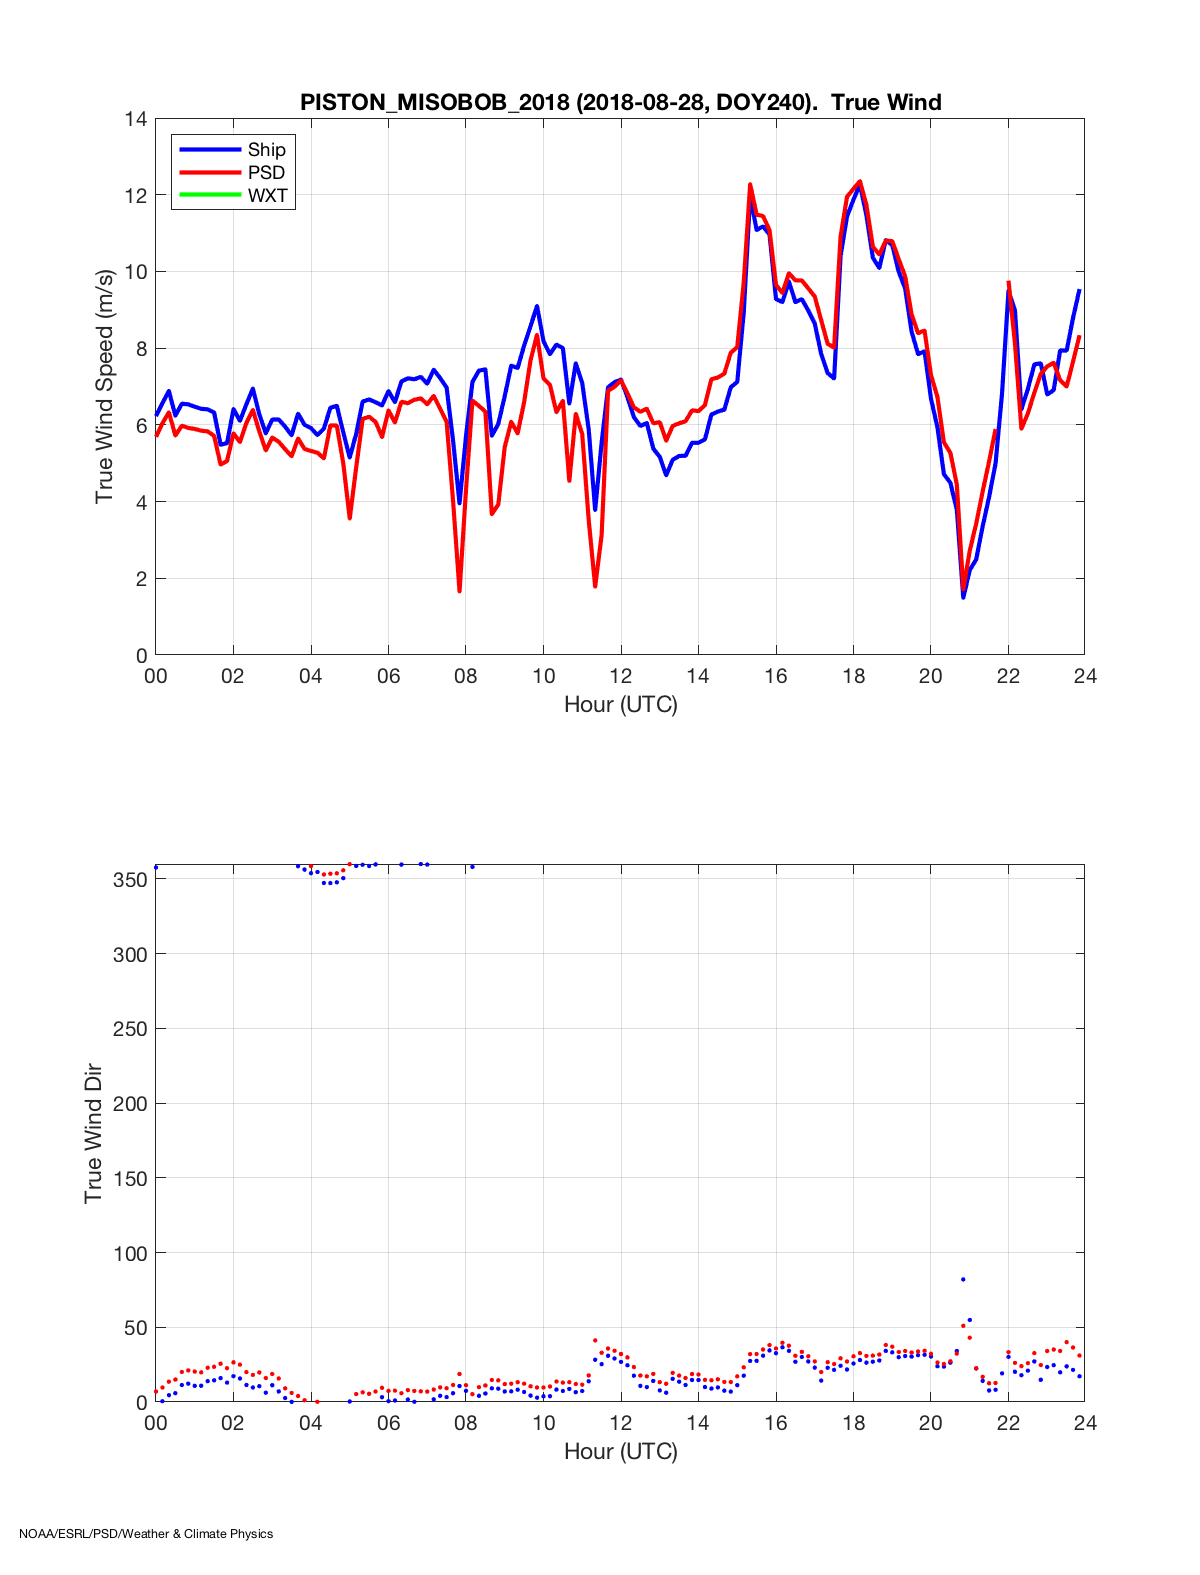
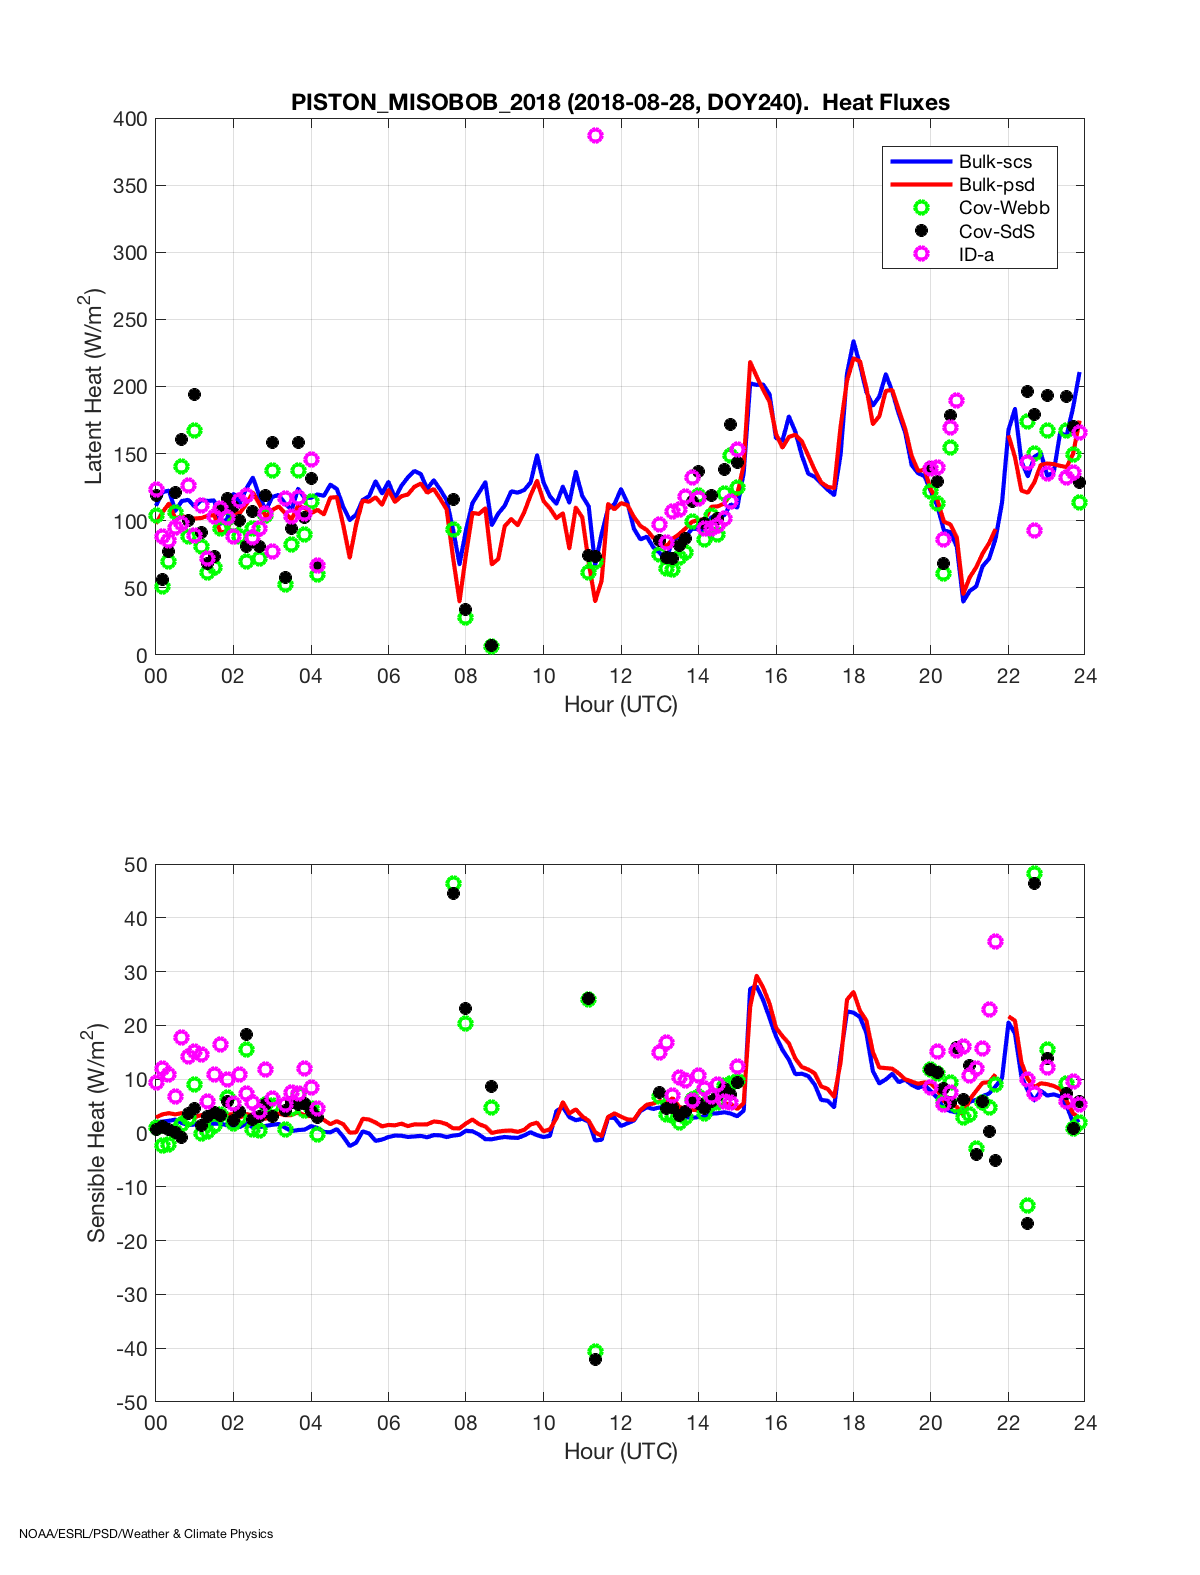
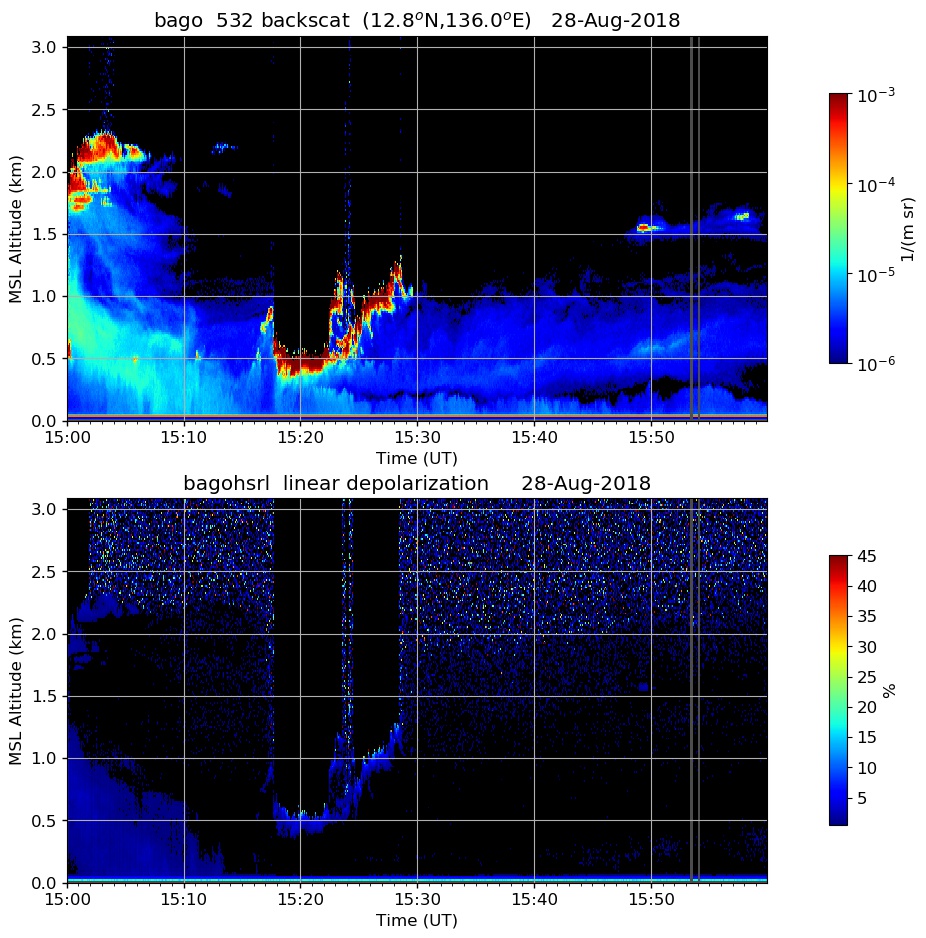
Figure 6 shows the cloud photos at the 03, 09, 12, 15, and 21 UTC soundings. During all daytime launches, mid-level and cirrus clouds were present above cumuli in the boundary layer. Most of the precipitation occurred during the night. My (SP) own visual account of the night, since it could not be photographed, was rapidly deepening moonlit cumulonimbus clouds all around the ship. Lightning accompanied one cell behind the ship for a few hours in the blind spot of SEAPOL. The cells were moving southwestward at about the same pace of the ship, and so one intense cell began to precipitate just a few miles in front of the bow and continued to do so for some time. Eventually, the convection began to move more quickly than the ship. Short-lived rain events occurred around 15 UTC and 18 UTC, followed by longer-lived rainfall starting around 20 UTC (Figure 7). Each of the precipitation occurrences, however small, were accompanied by a drop in air temperature (Figure 8). The first drop in temperature of about 1.5 C occured around 15 UTC, then the temperature recovered some before dropping again before 18 UTC, before recovering to 28 C yet again and dropping when persistent stratiform precipitation began. The first two events were accompanied by wind bursts and enhanced surface heat fluxes (Figure 9). After both events, the boundary layer appeared much cleaner than before either event. This is evident in backscatter from HSRL. For example, the erosol backscatter after the 15 UTC event was about one order of magnitude less than before it (Figure 10). The cleaning of the boundary layer after an apparent cold pool passage is qualitatively consistent with what we observed on August 22 during transit.
In the 12 UTC sounding in Figure 5, the boundary layer structure suggests a recovering cold pool: a cool, moist, stable layer, not well mixed in either potential temperature or specific humidity, similar to what was seen on the evening of August 22 (see fig. 4 in the August 22 summary), except that the temperature has recovered to 29C right at the surface, so that an unstable surface layer is apparent. This sounding, however, occurred before all the observations of surface cold pools and precipitation described above. This, plus the apparent recovery of the surface air, suggest that it was associated with convection in the larger area but not observed directly at the ship.
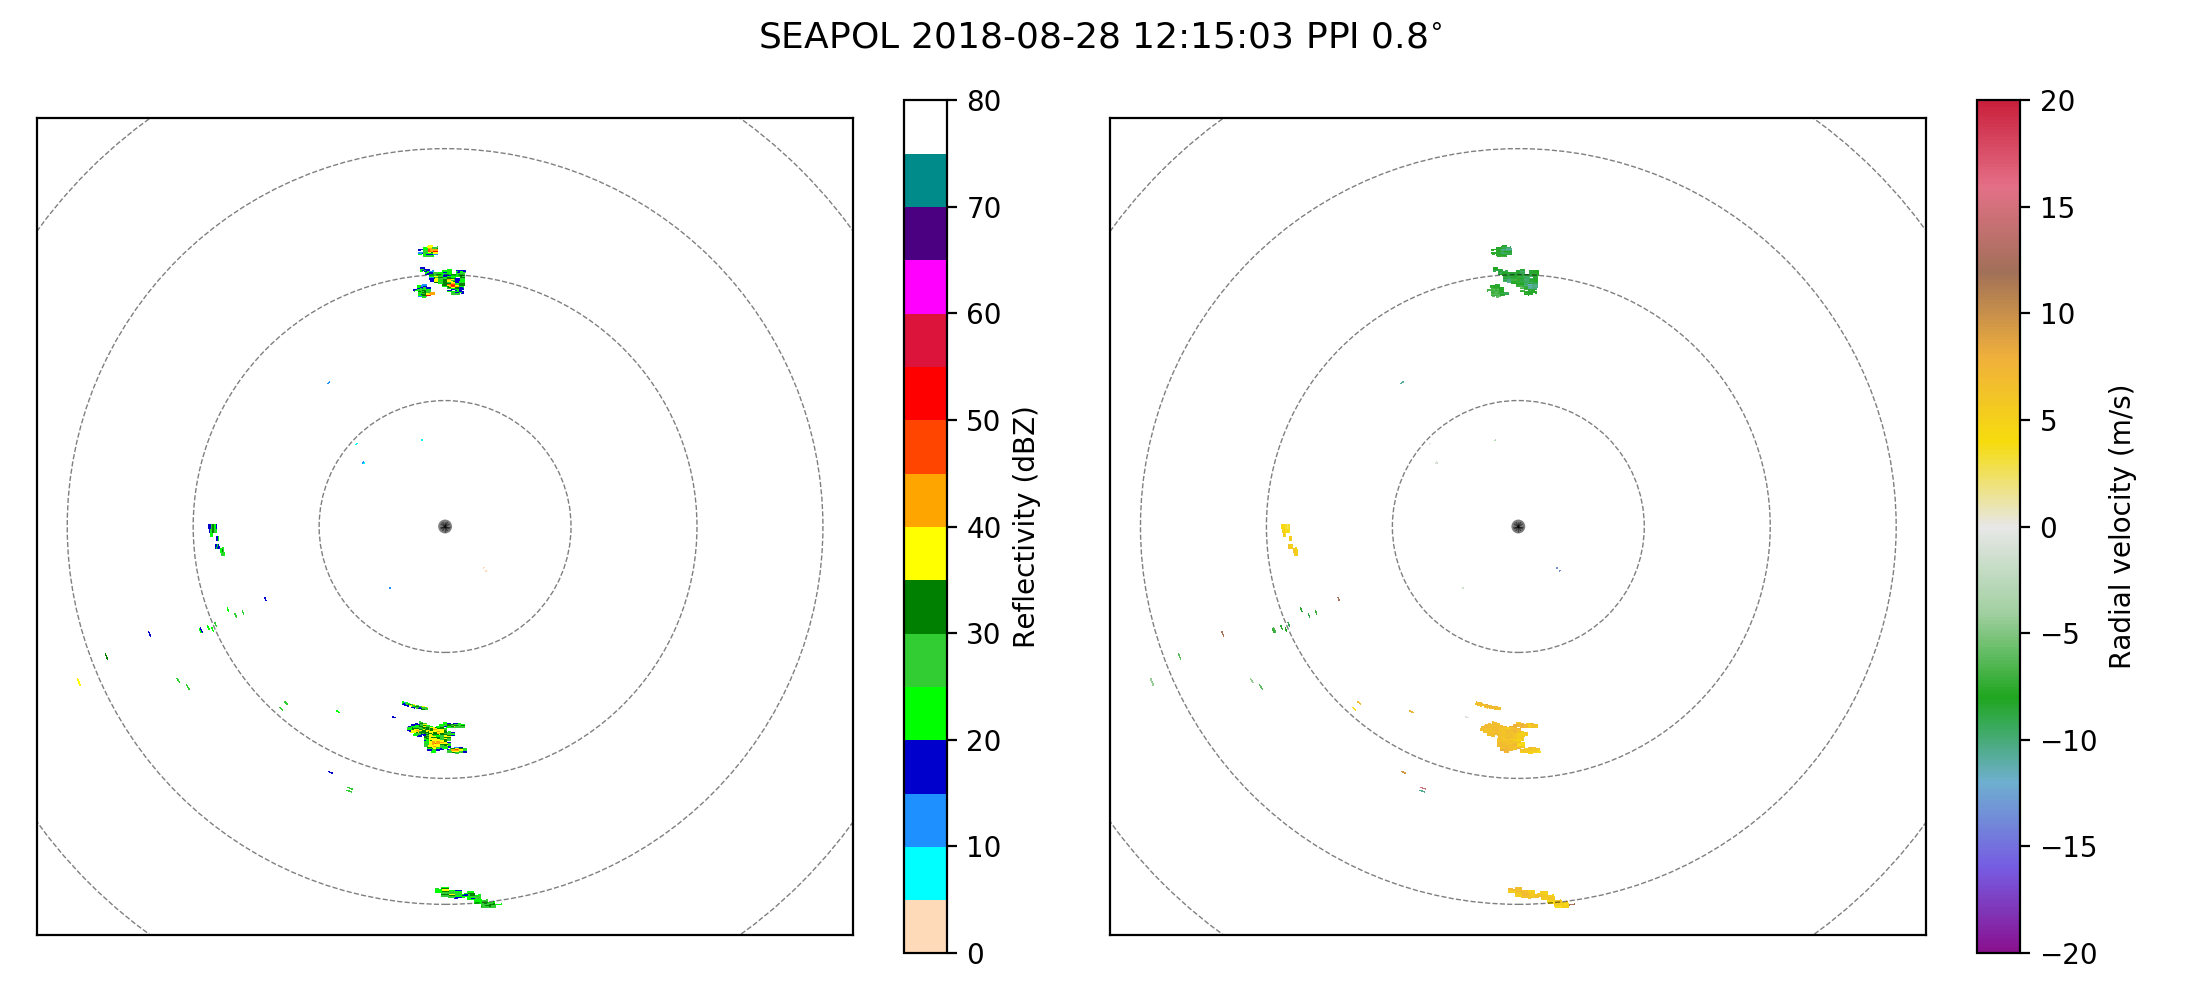
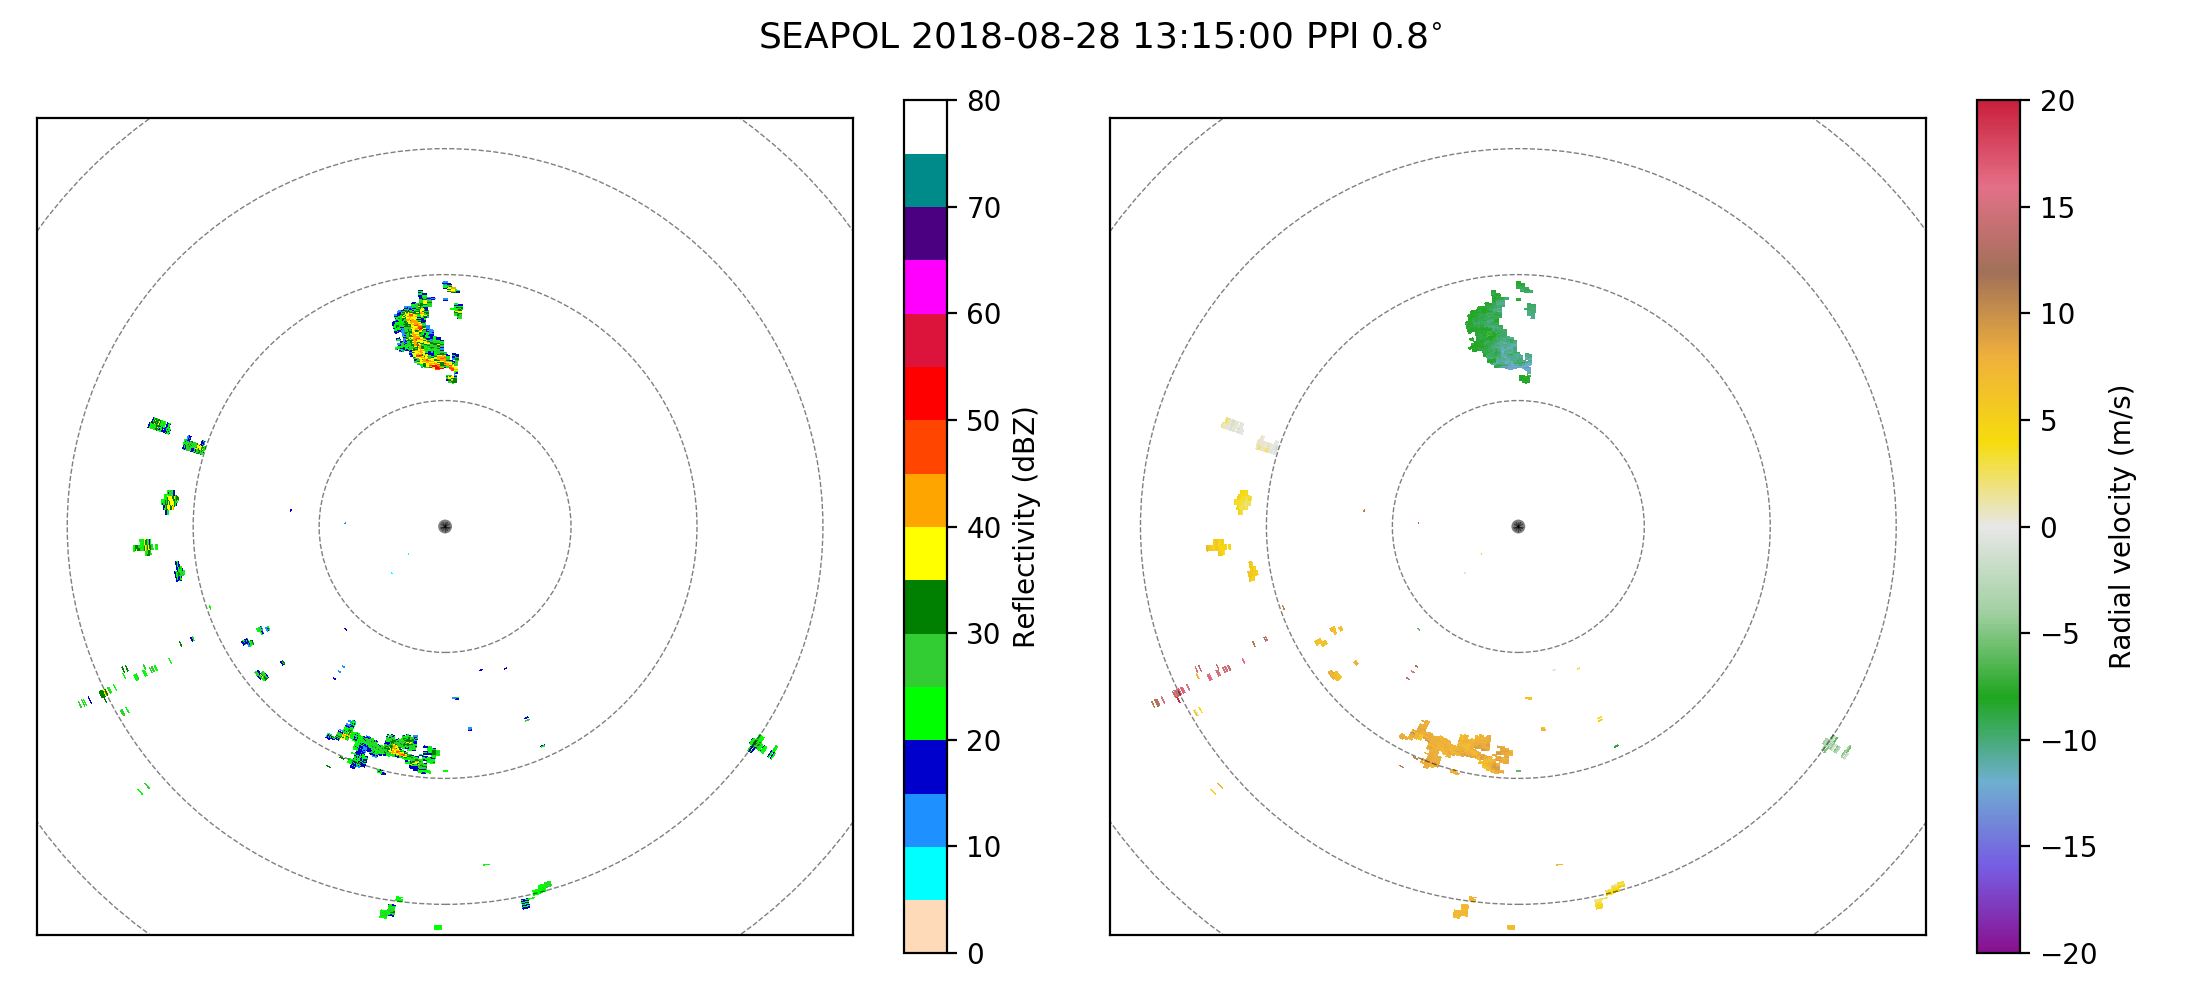
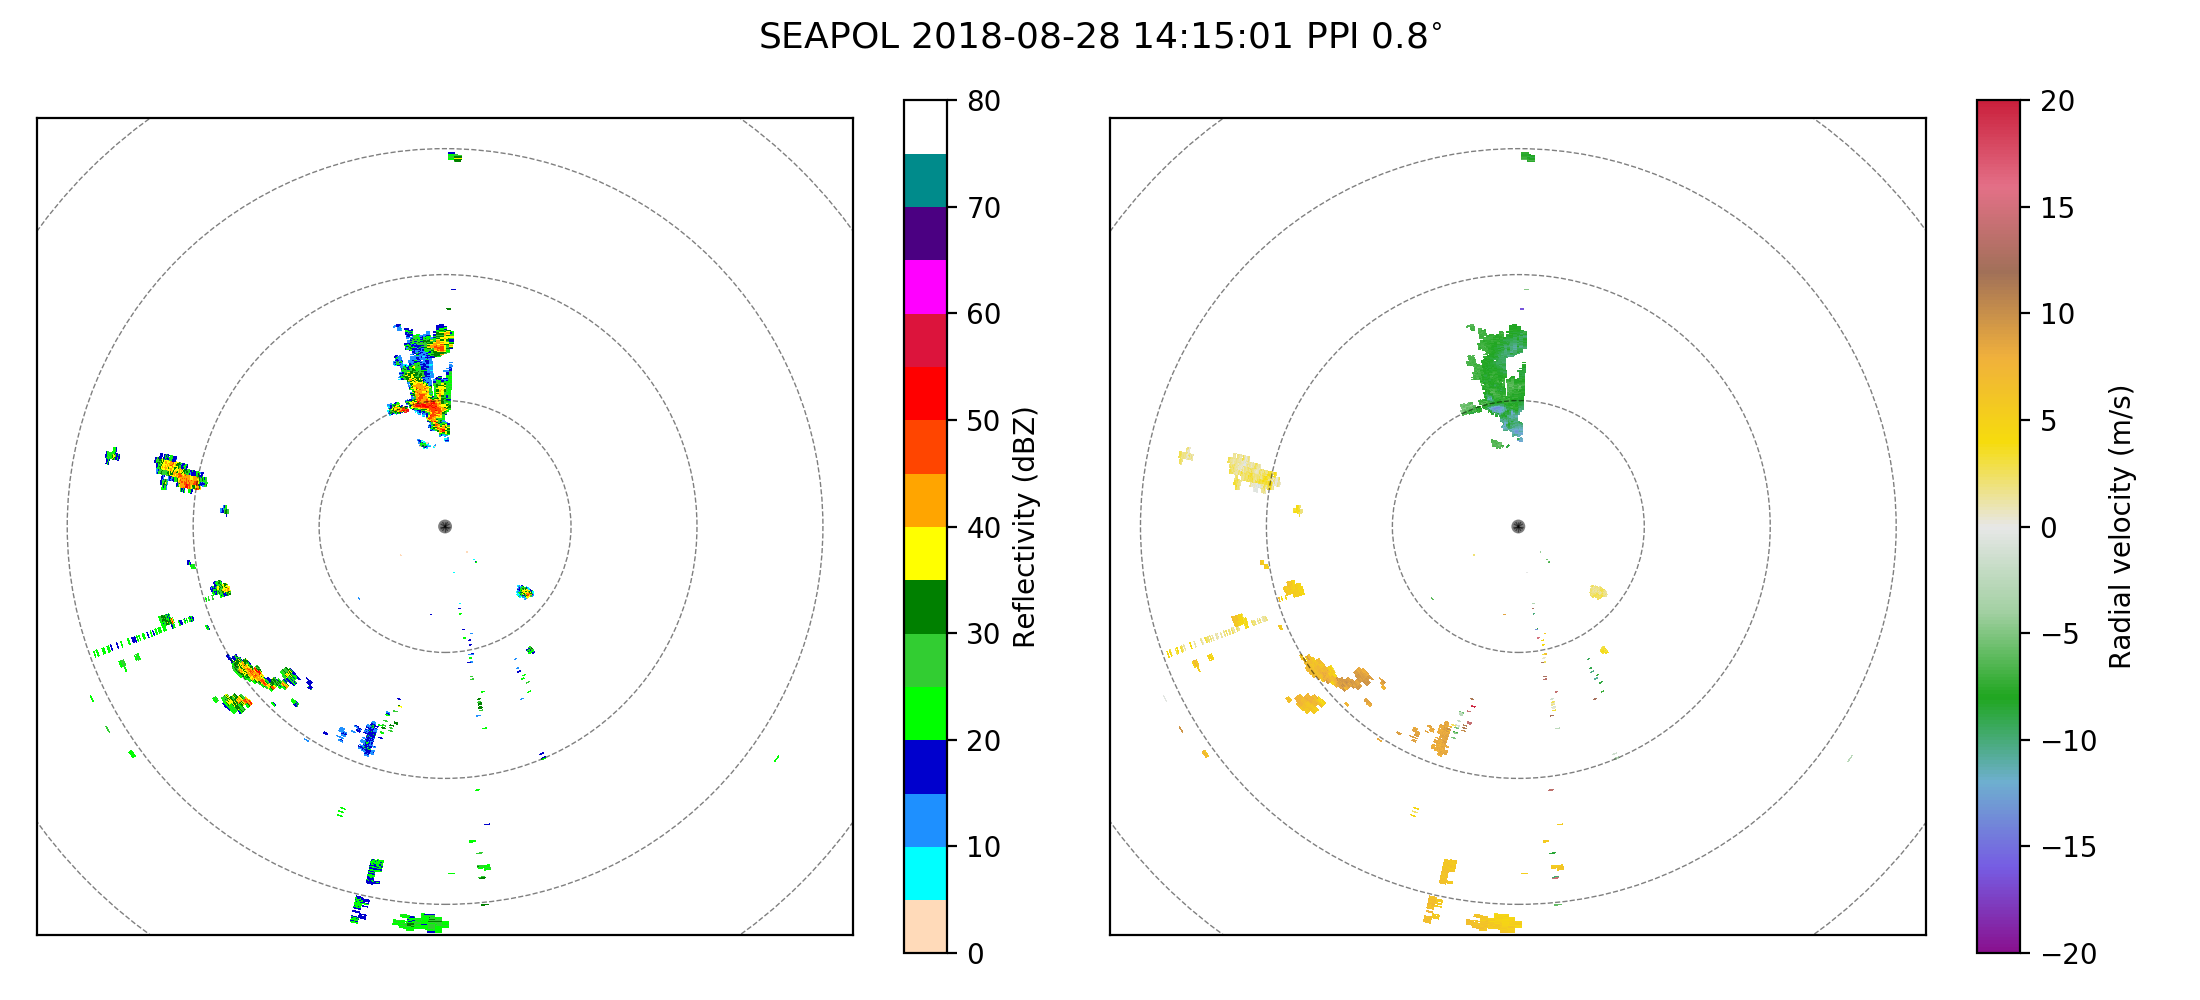
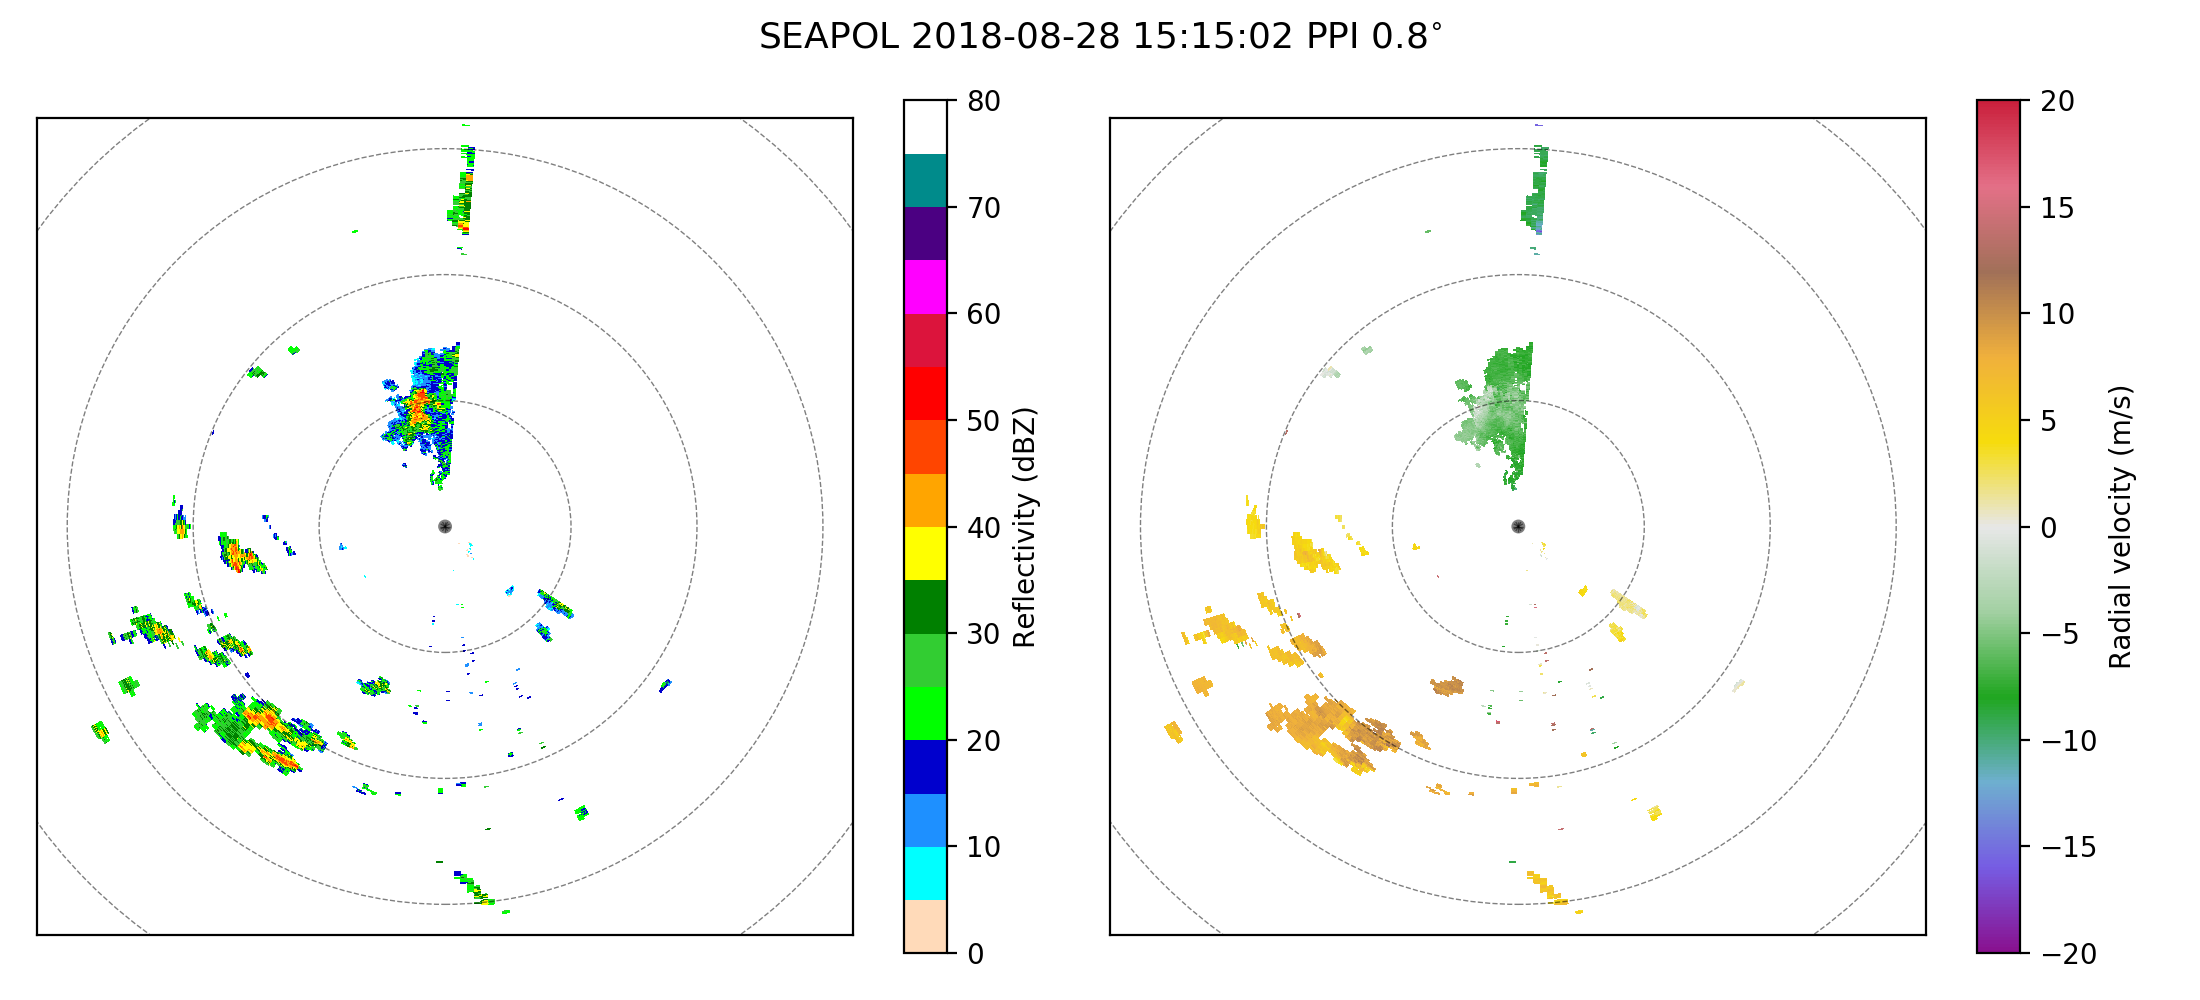
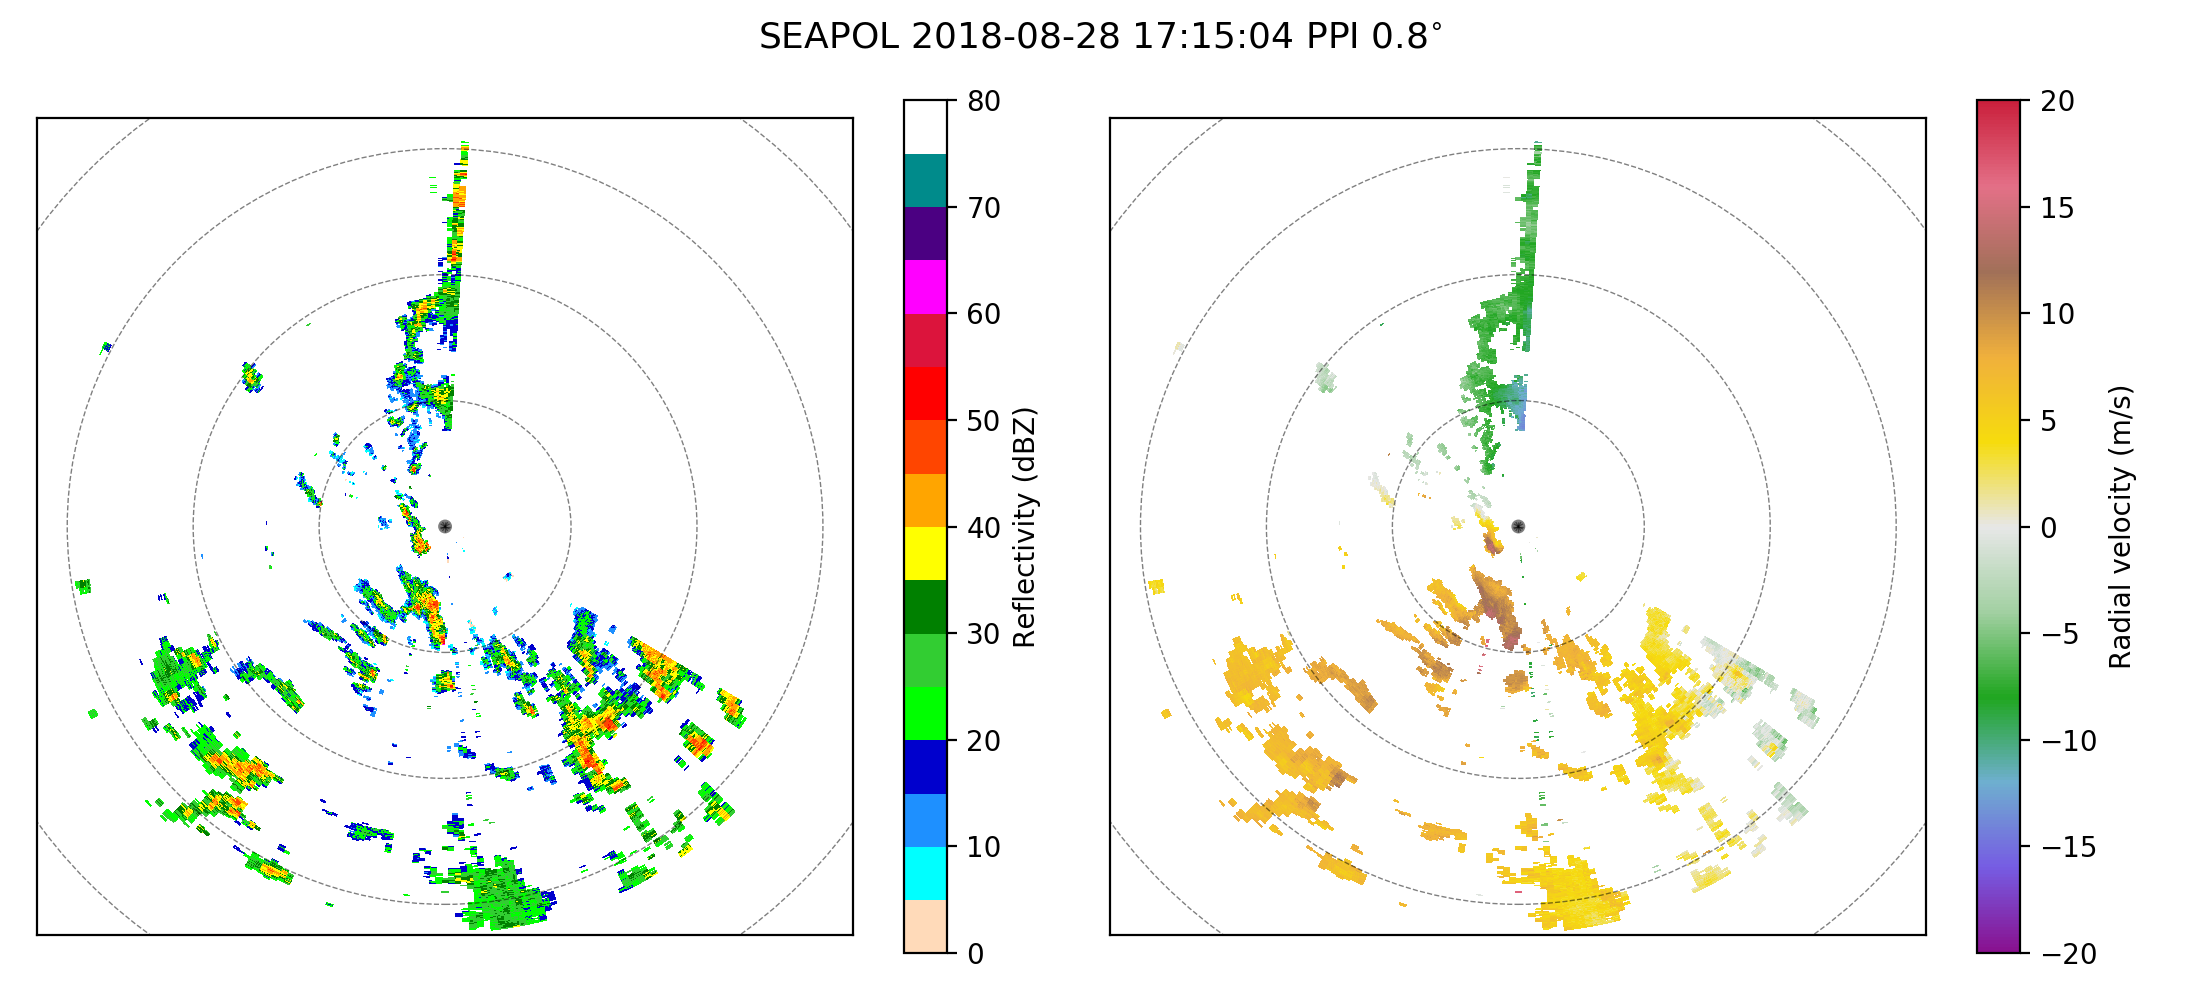
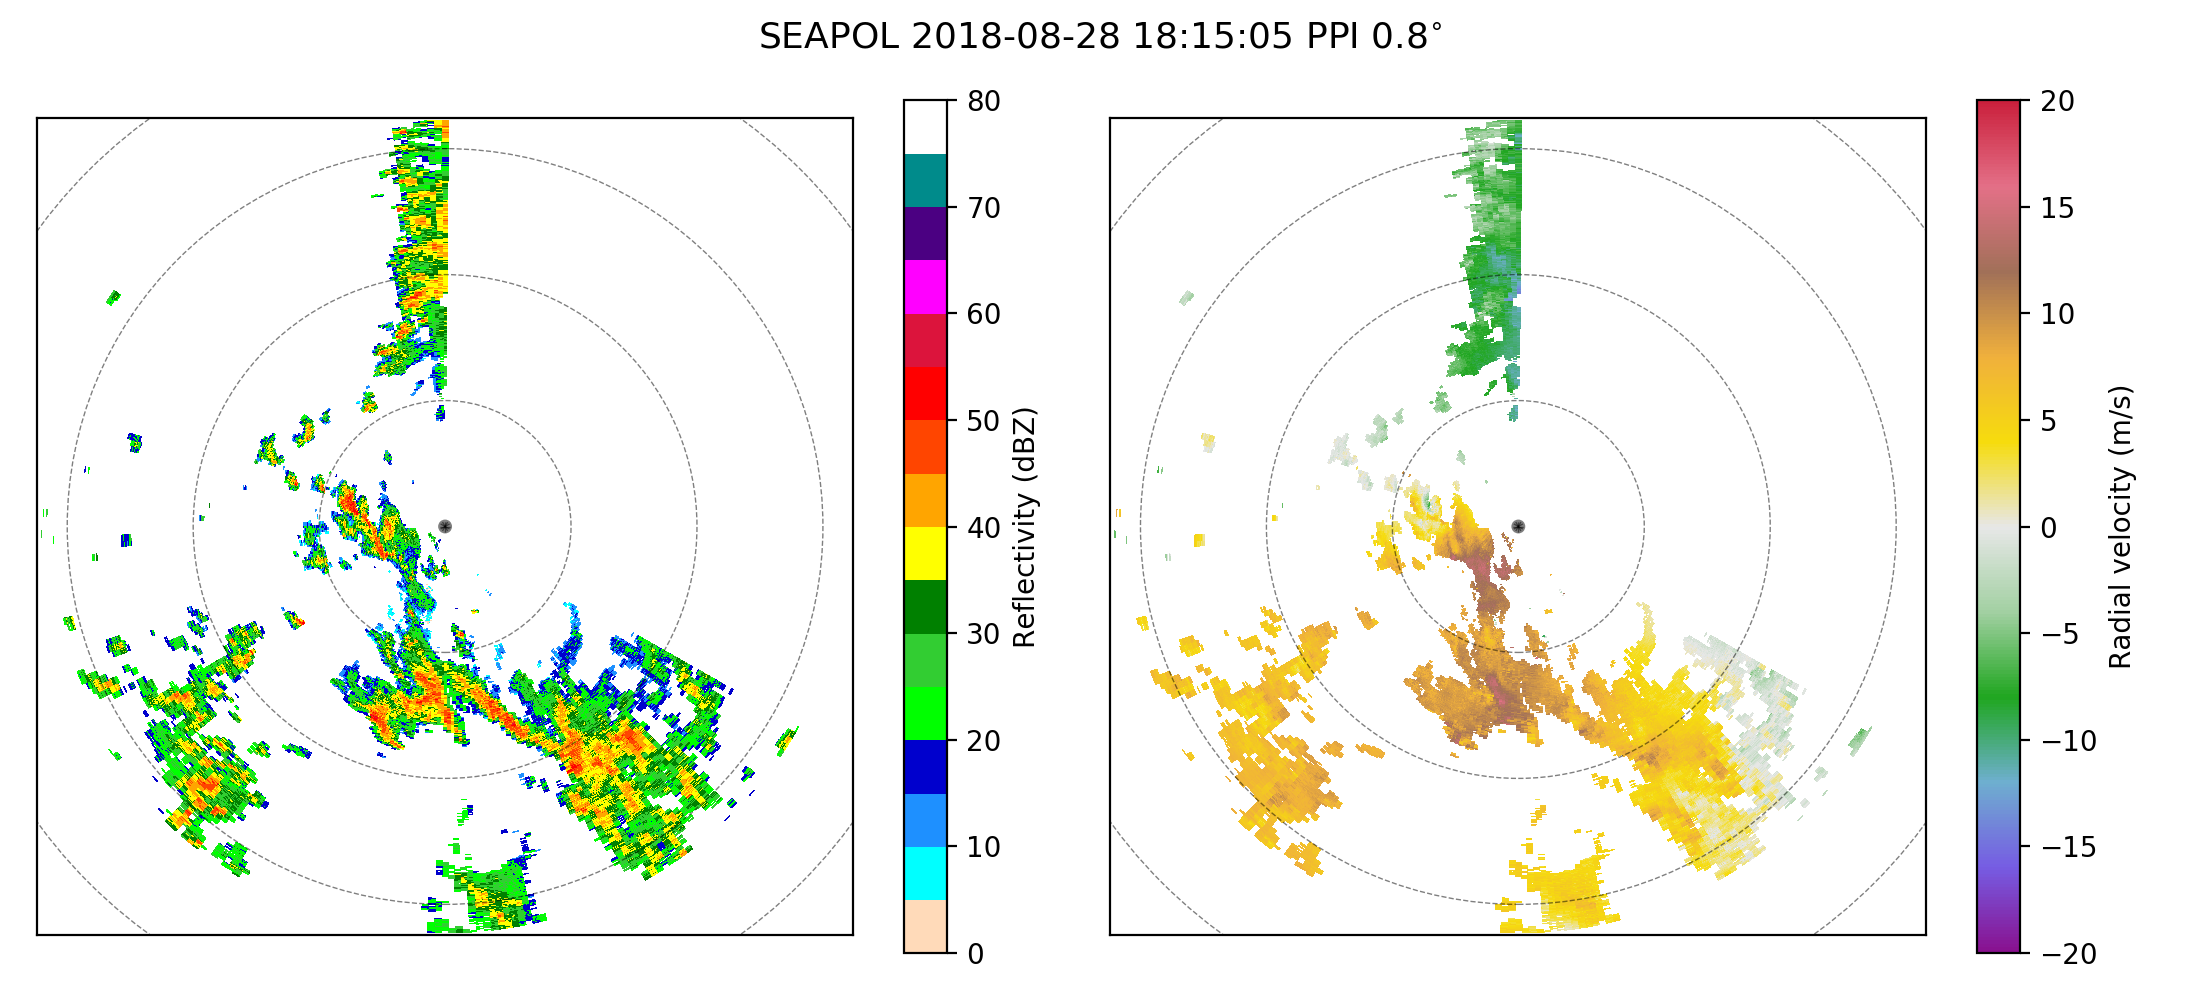
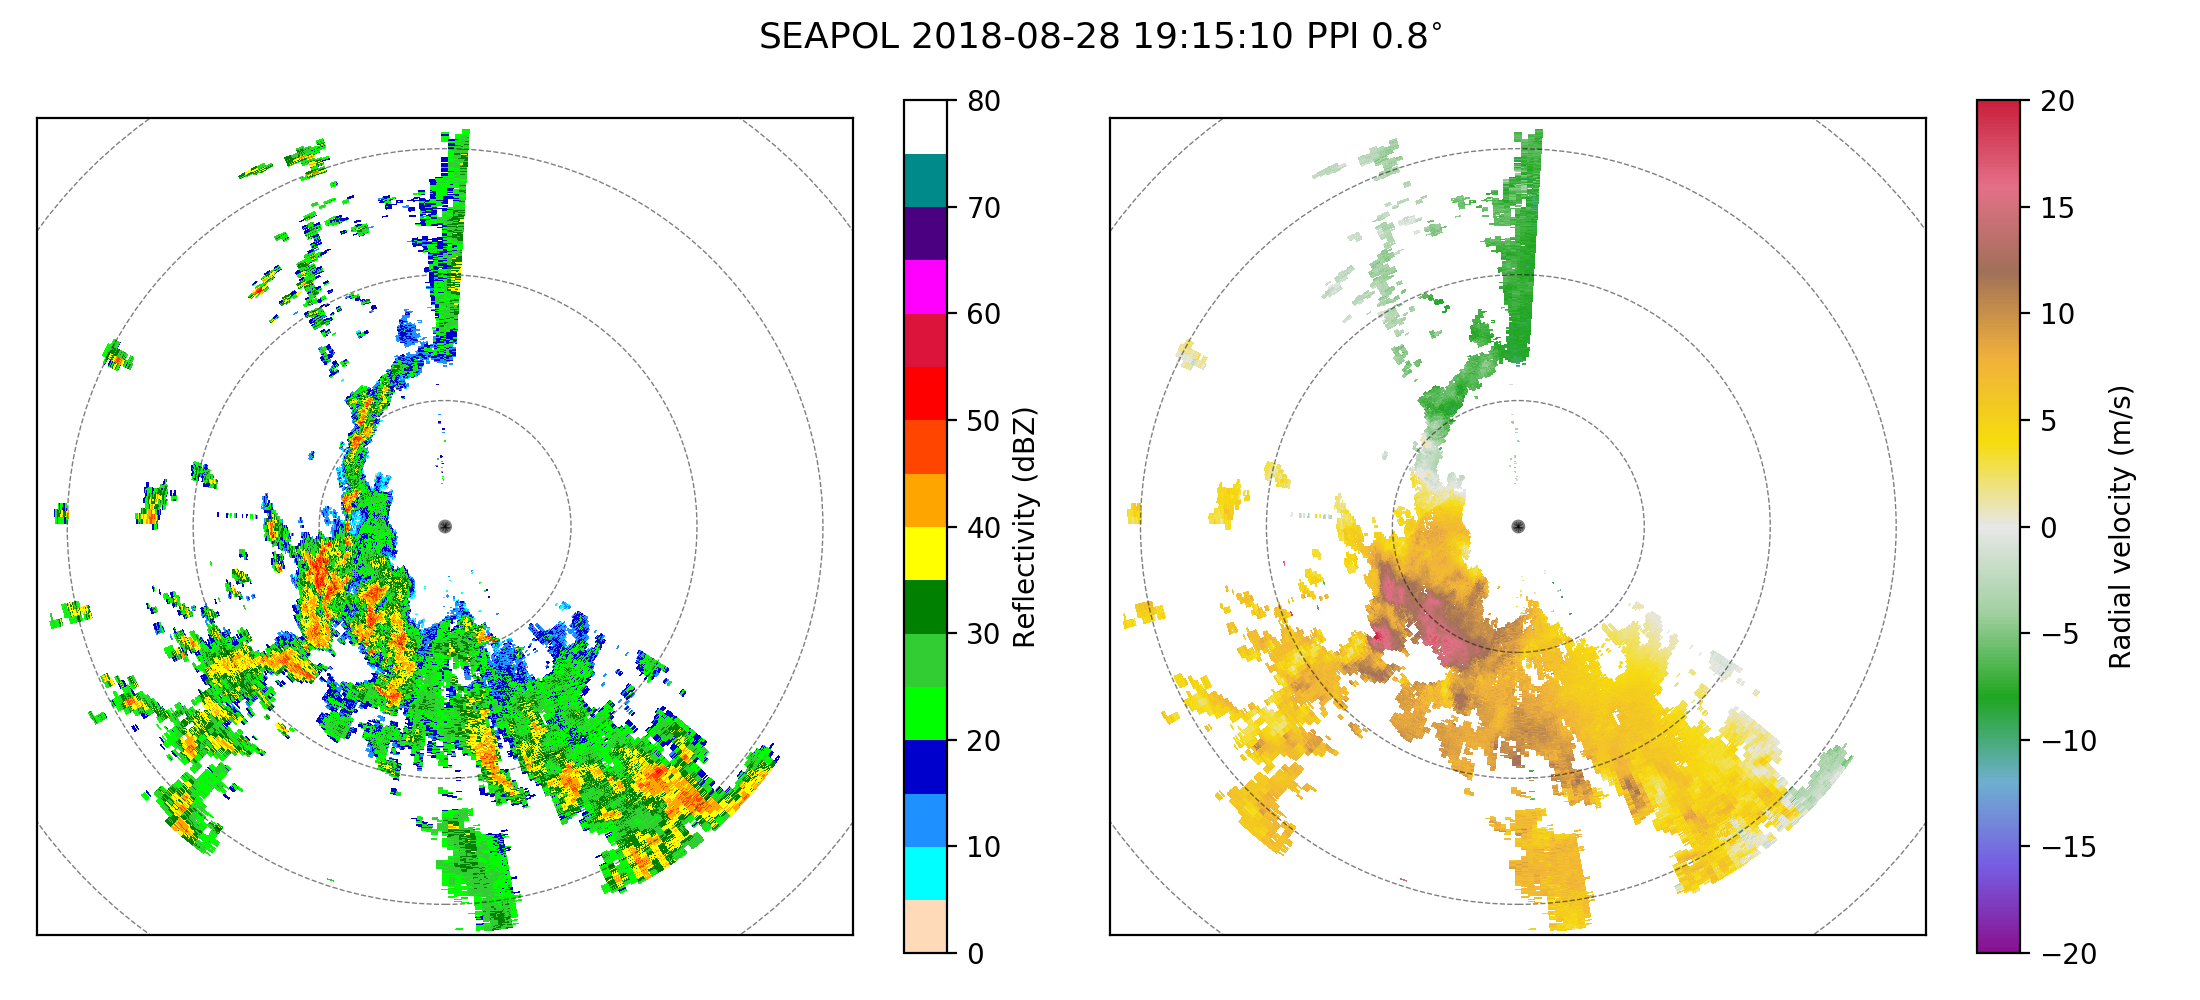
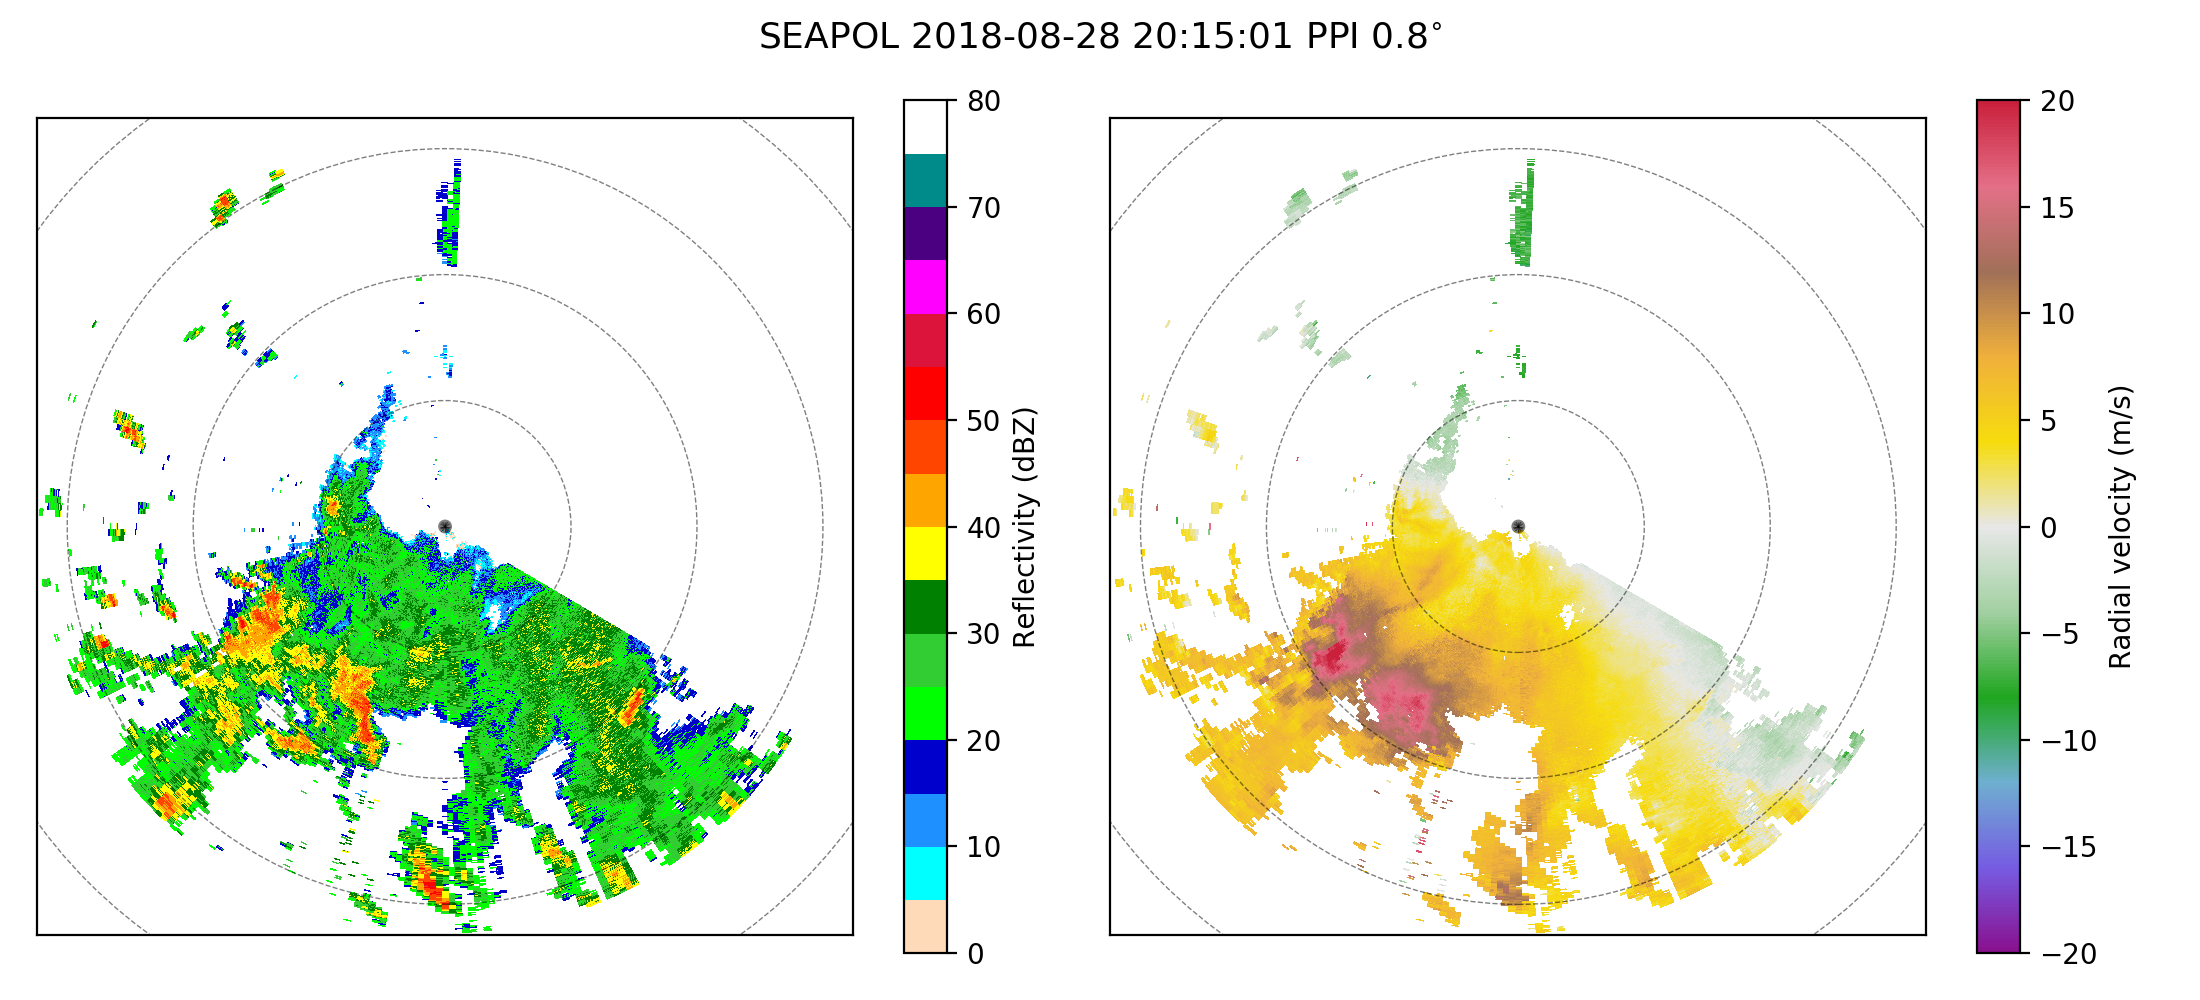
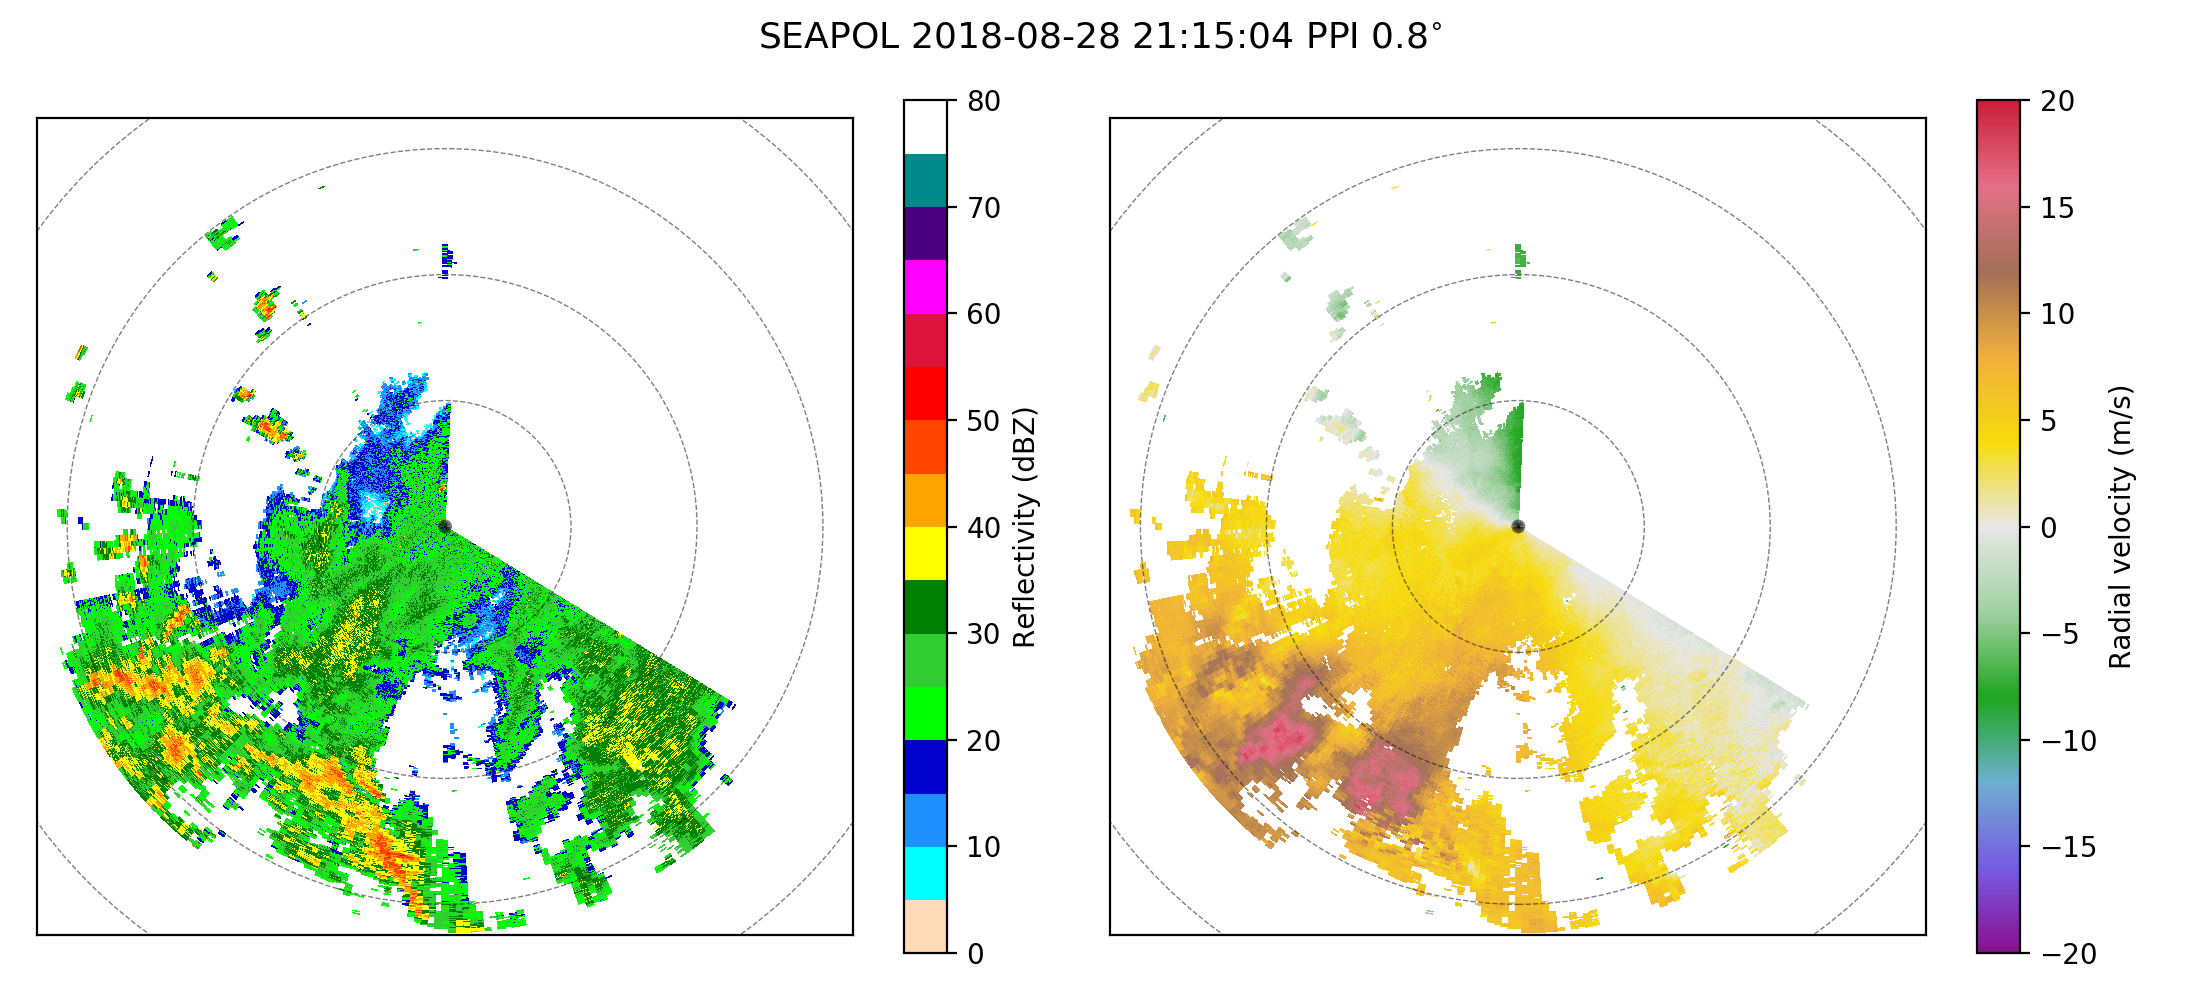
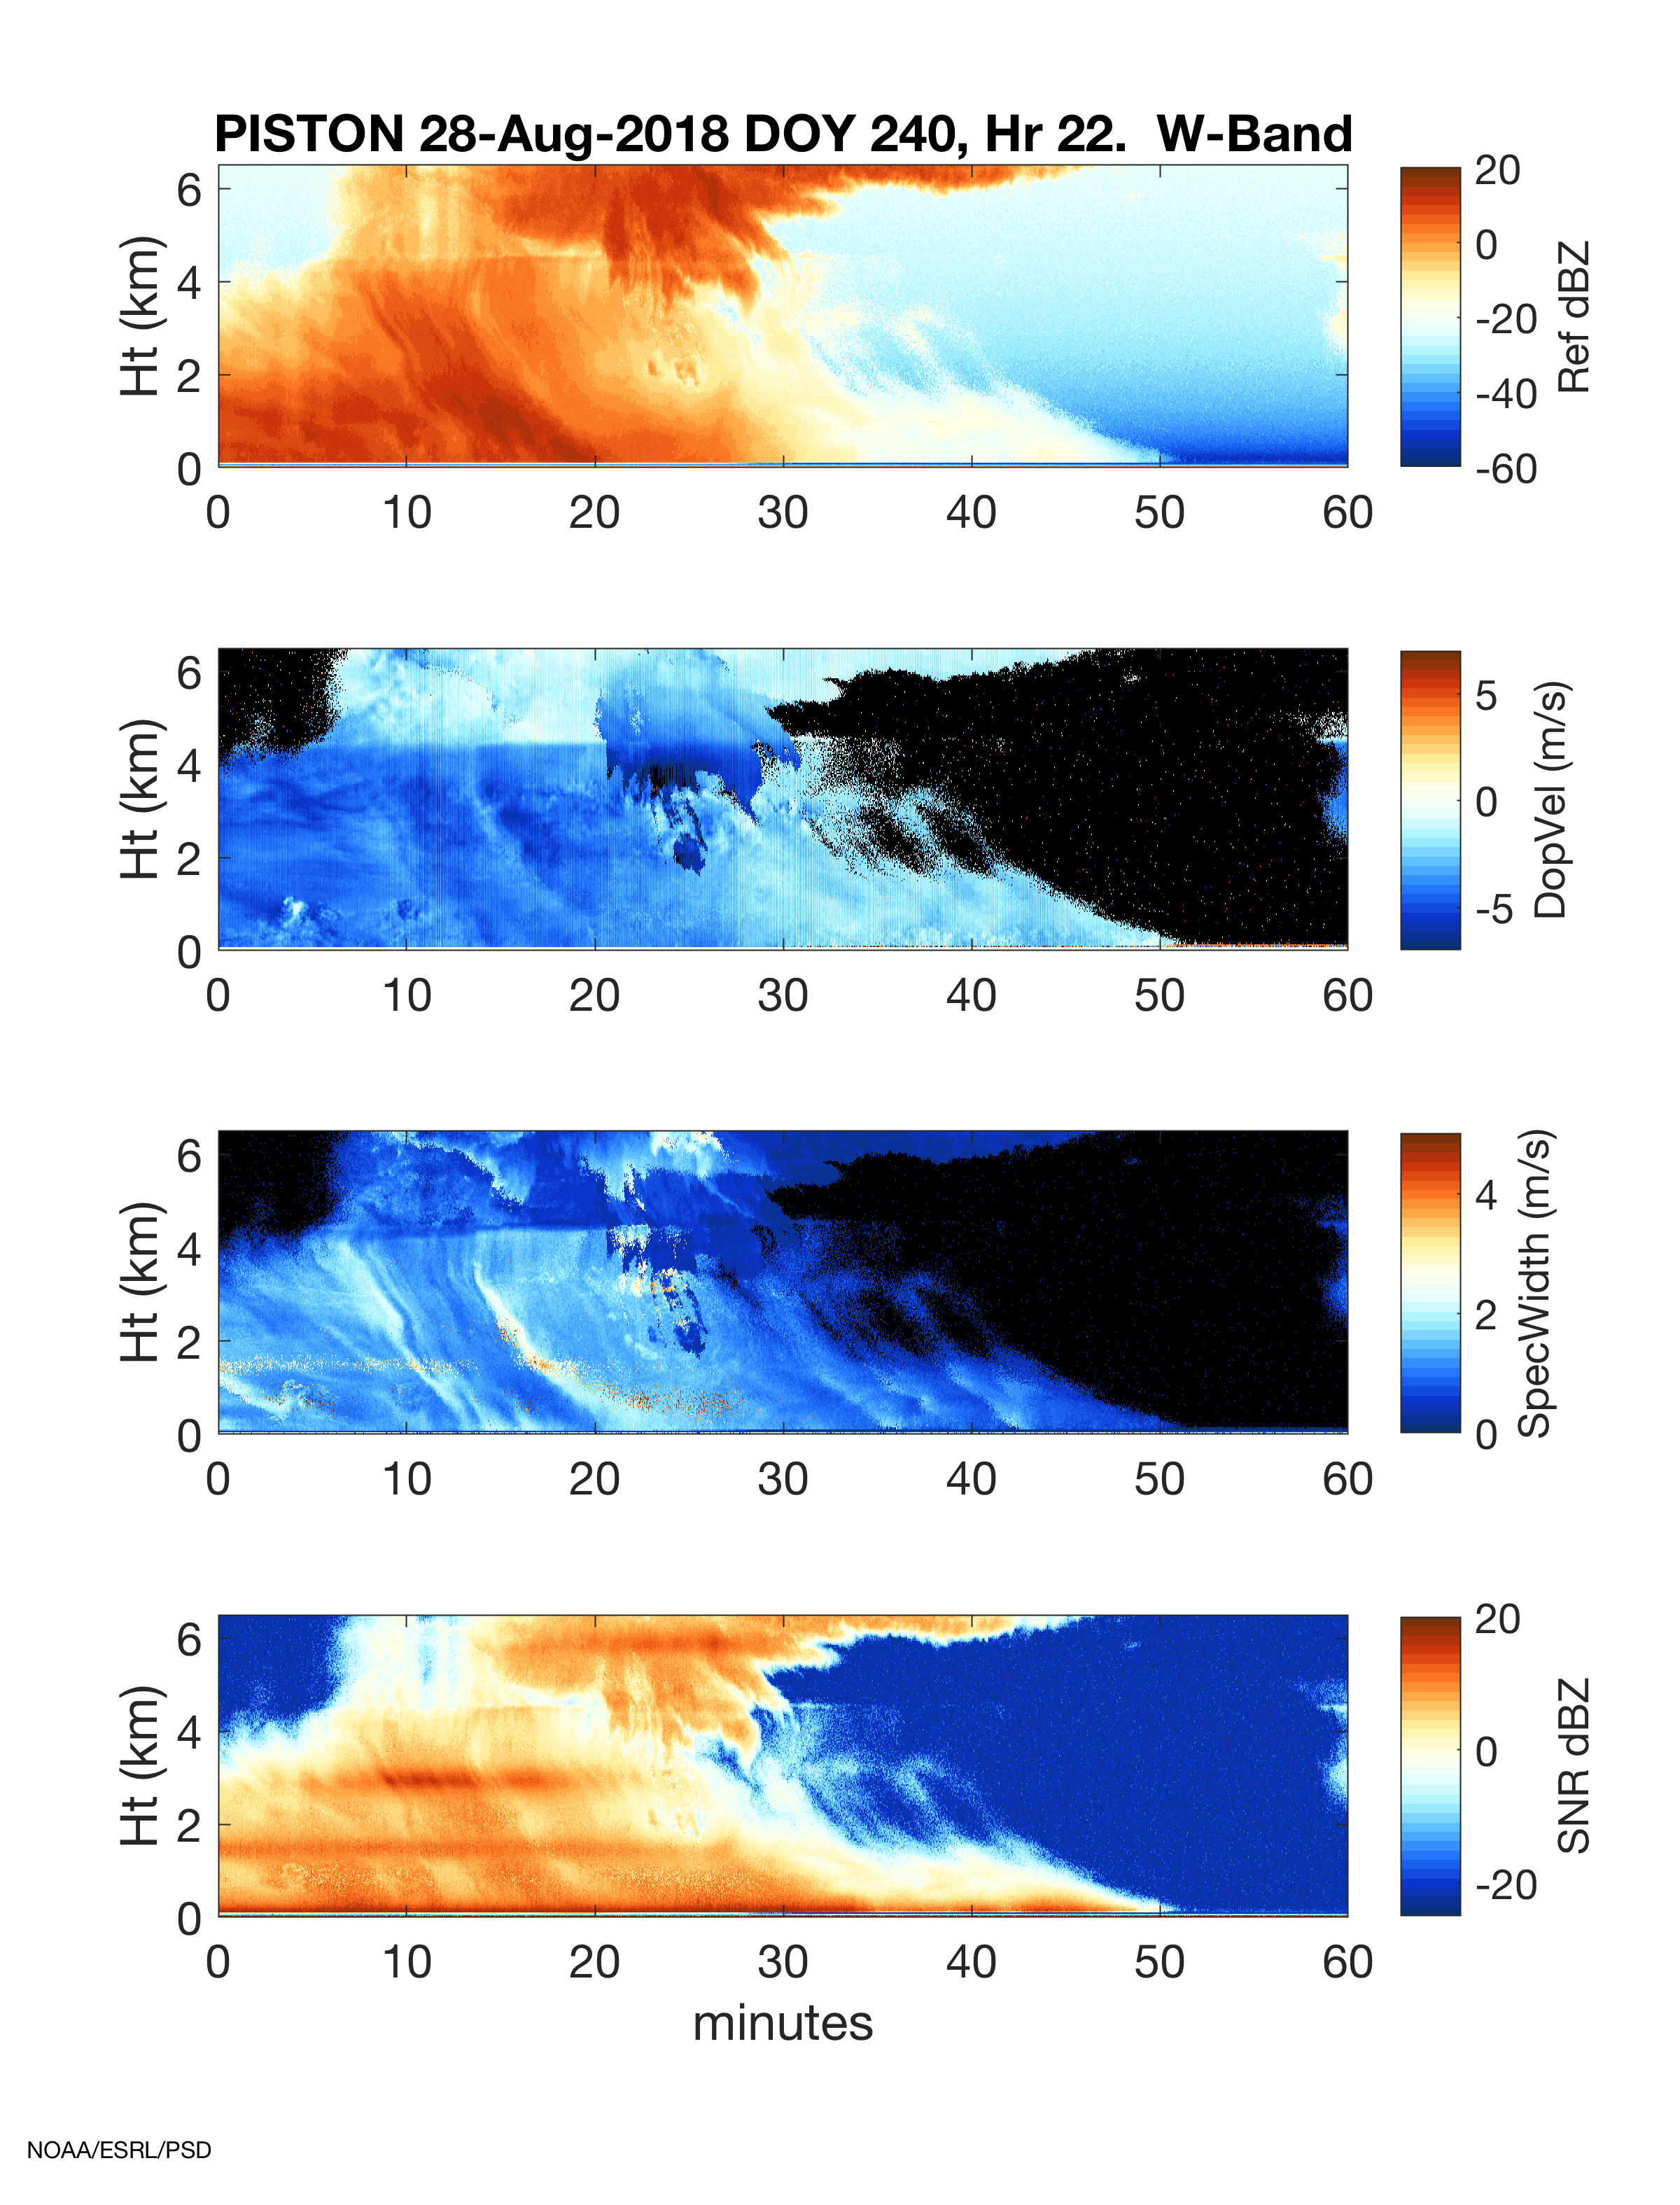
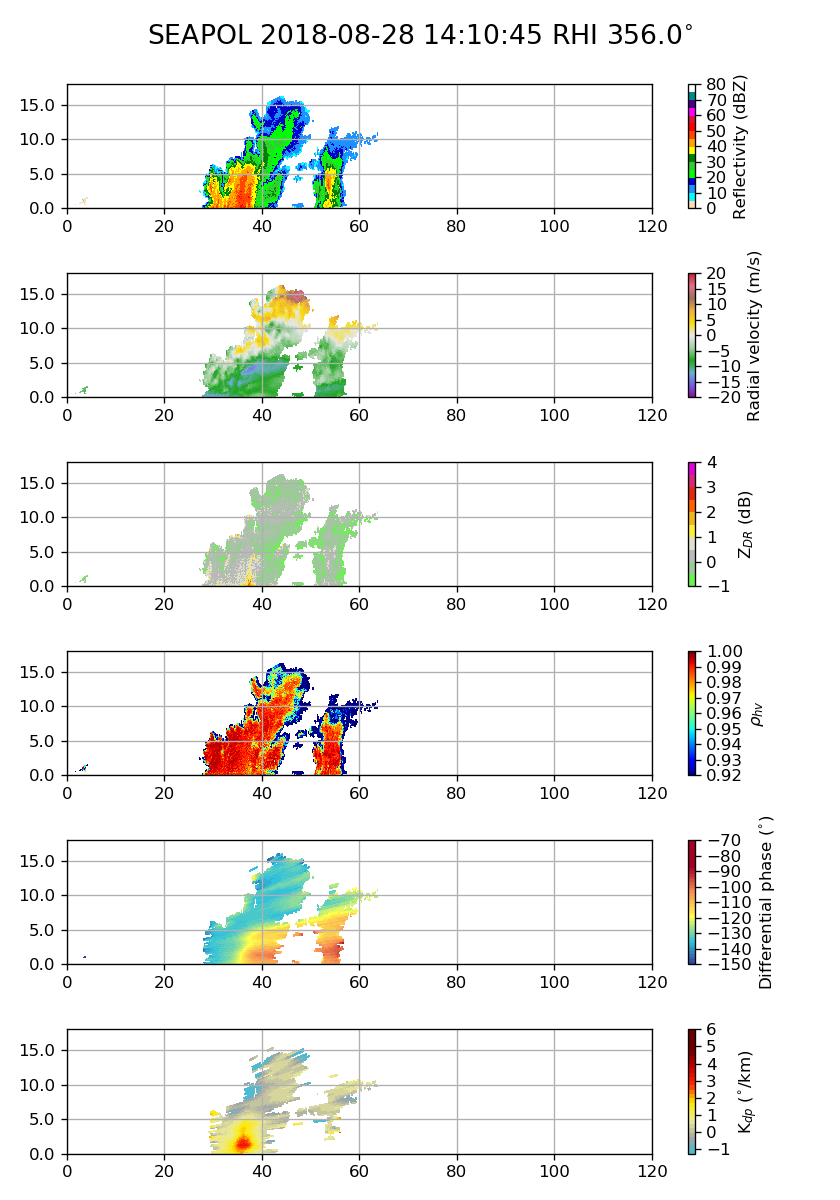
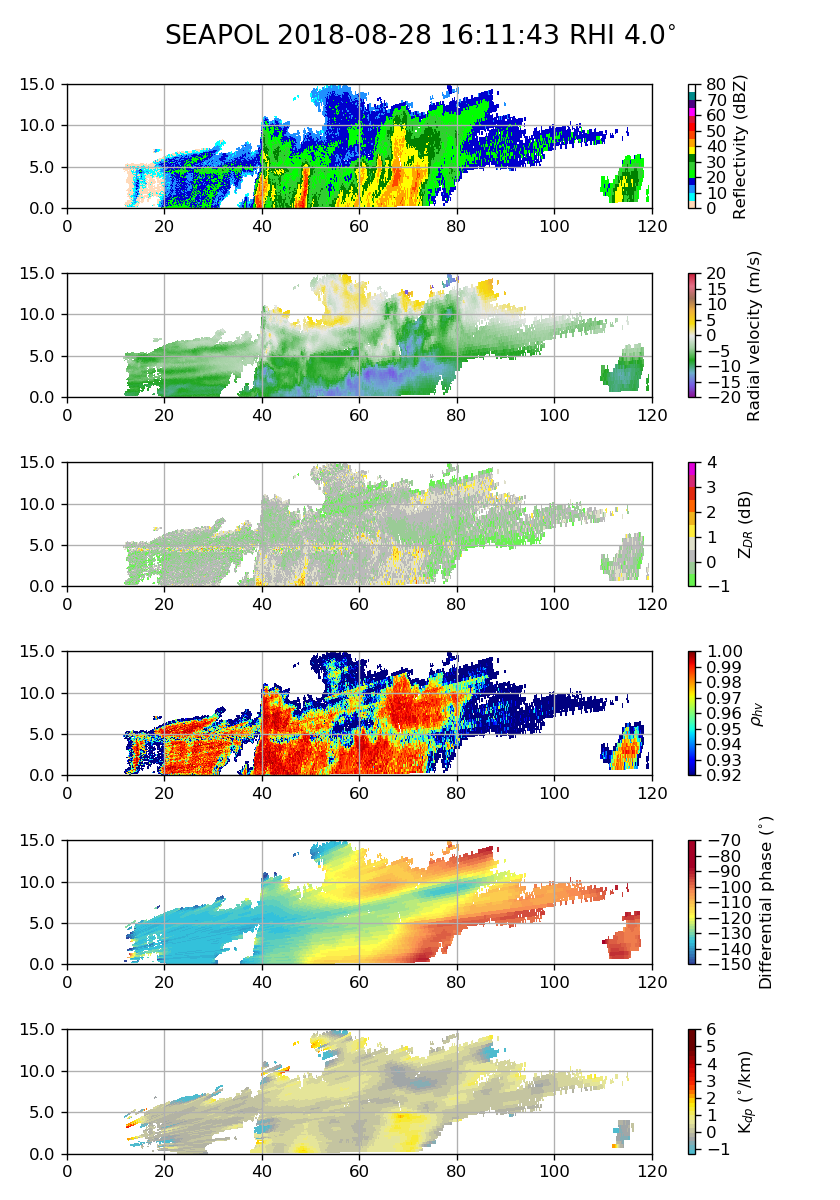
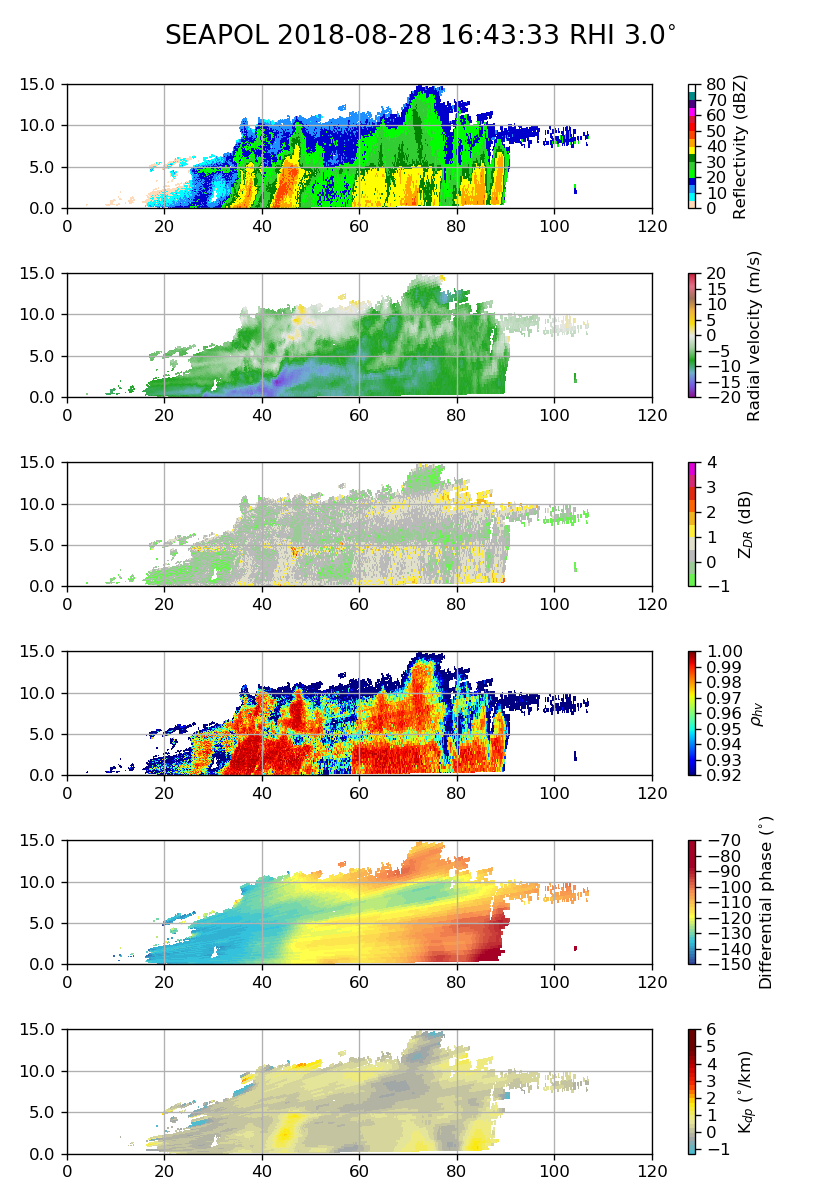
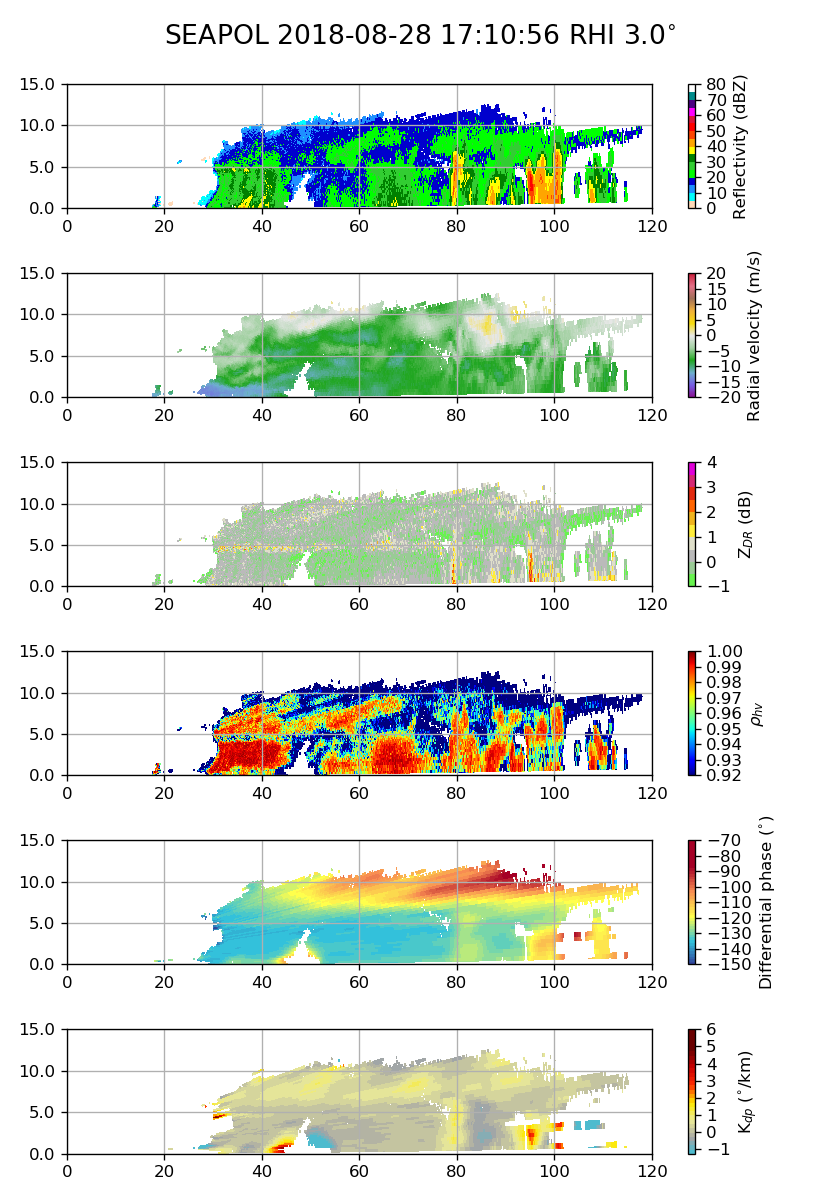
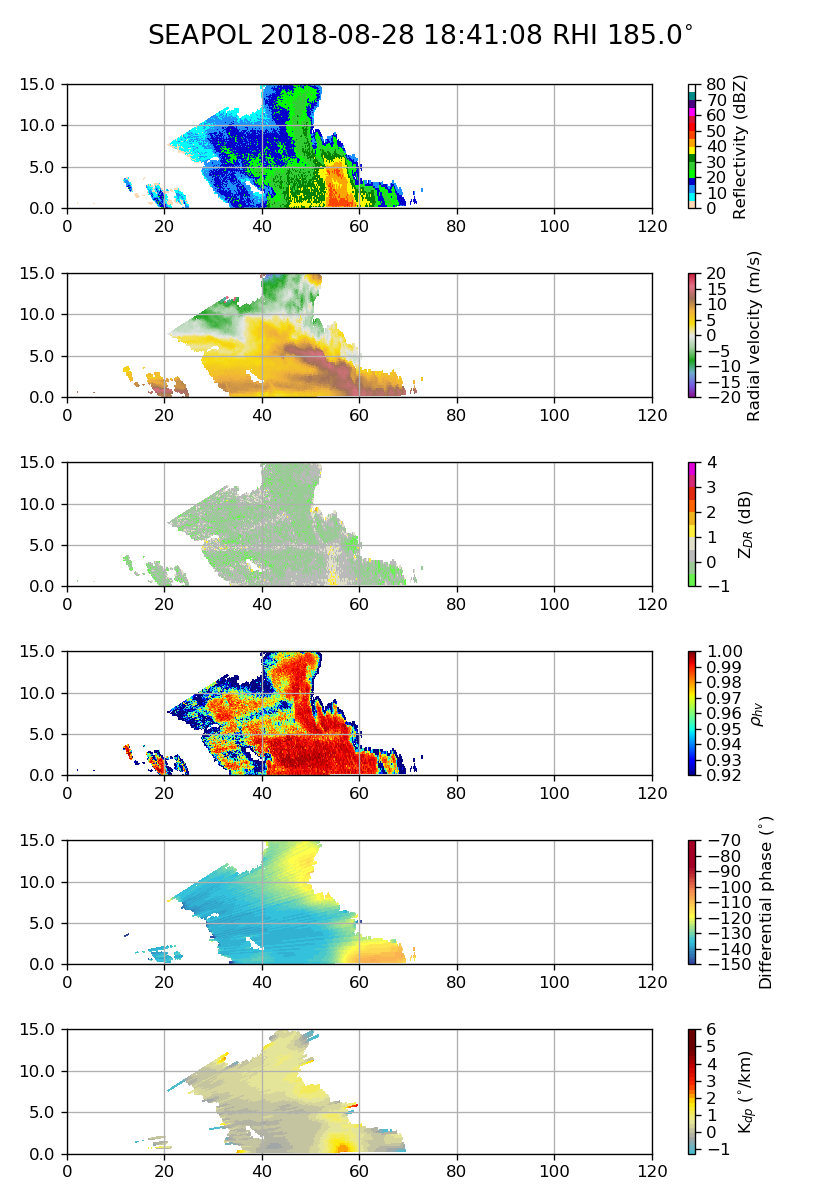
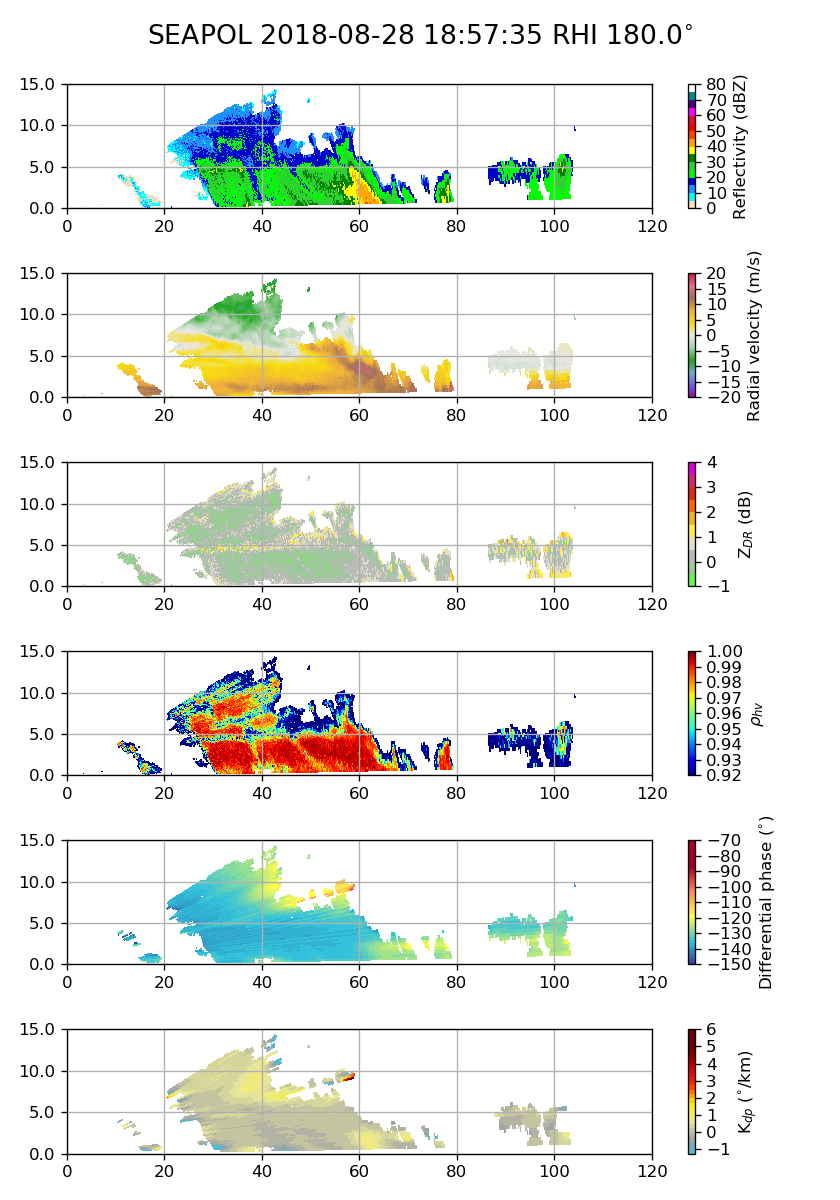
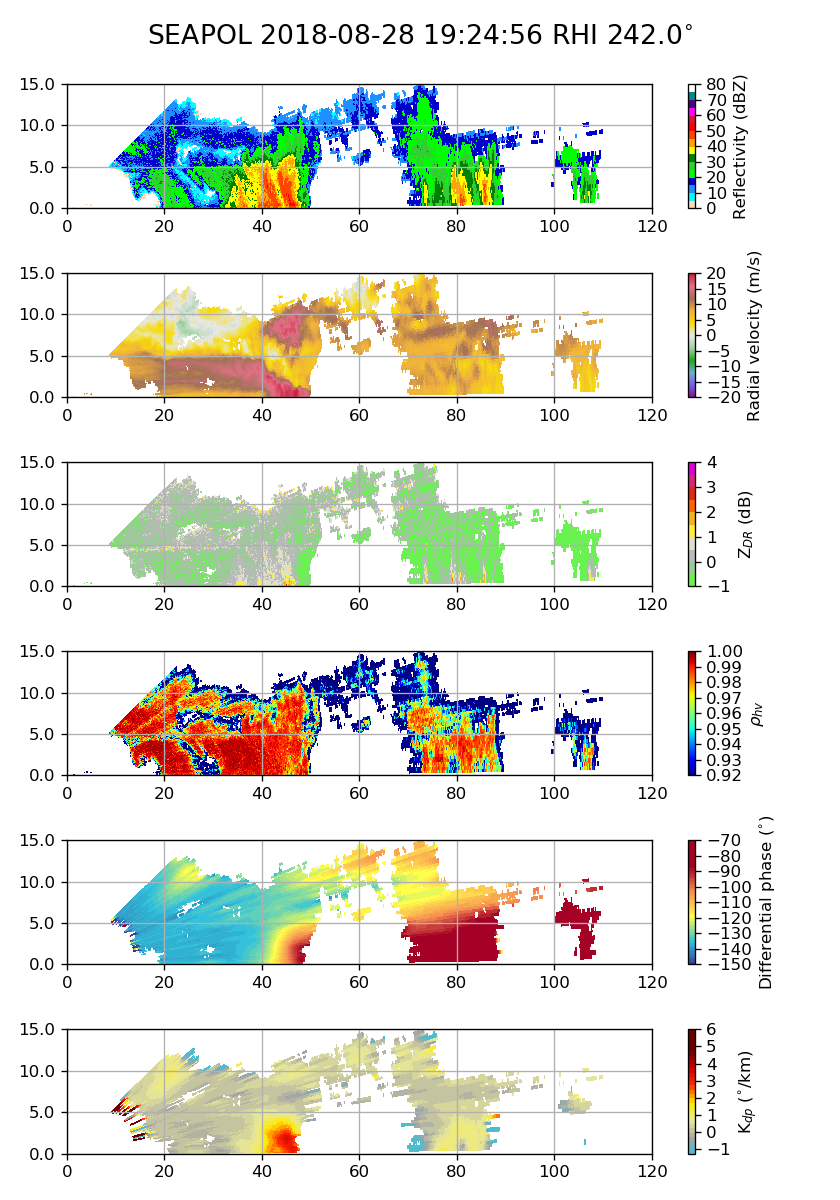
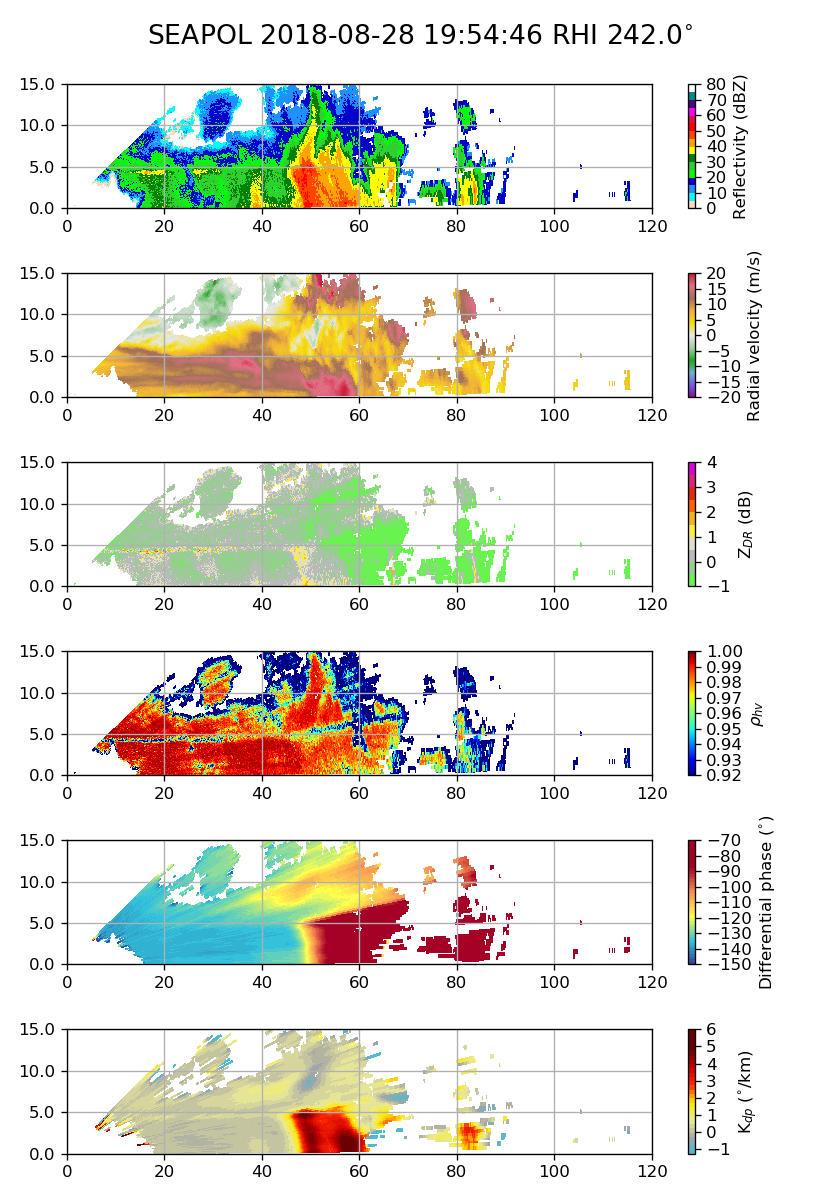
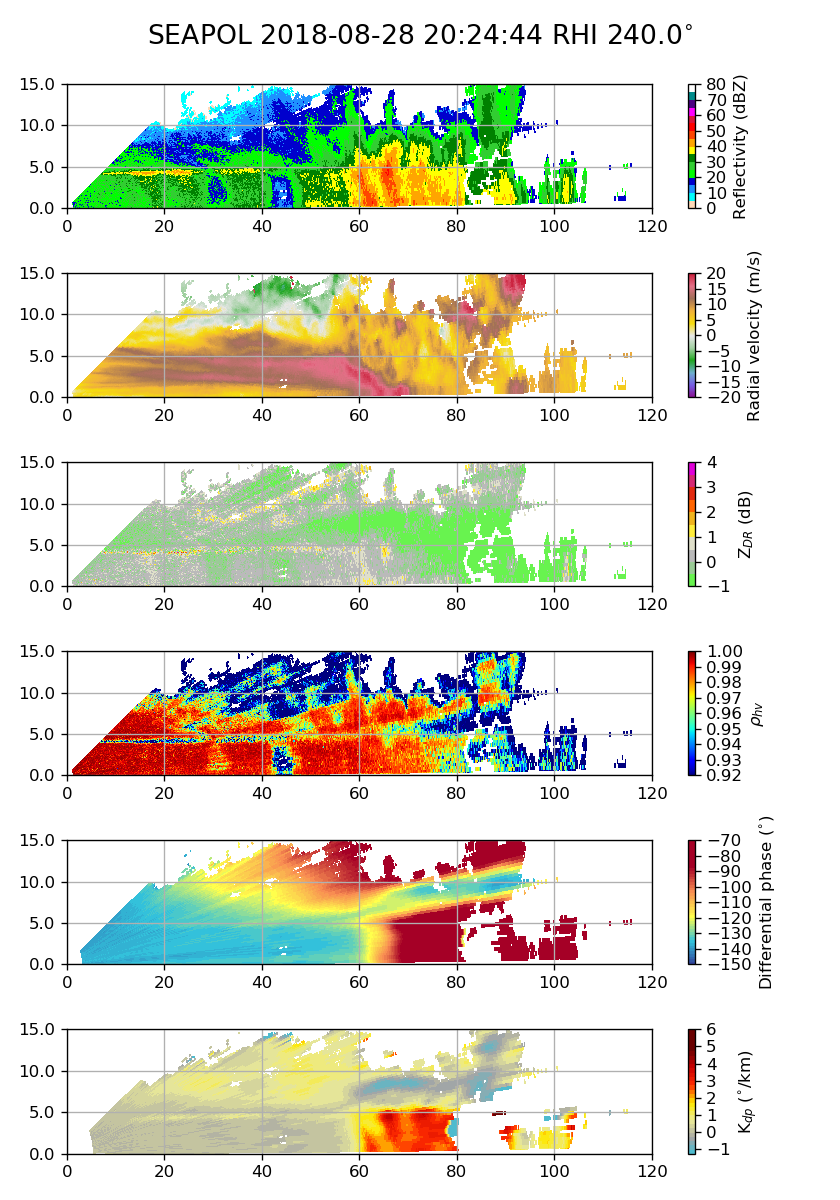
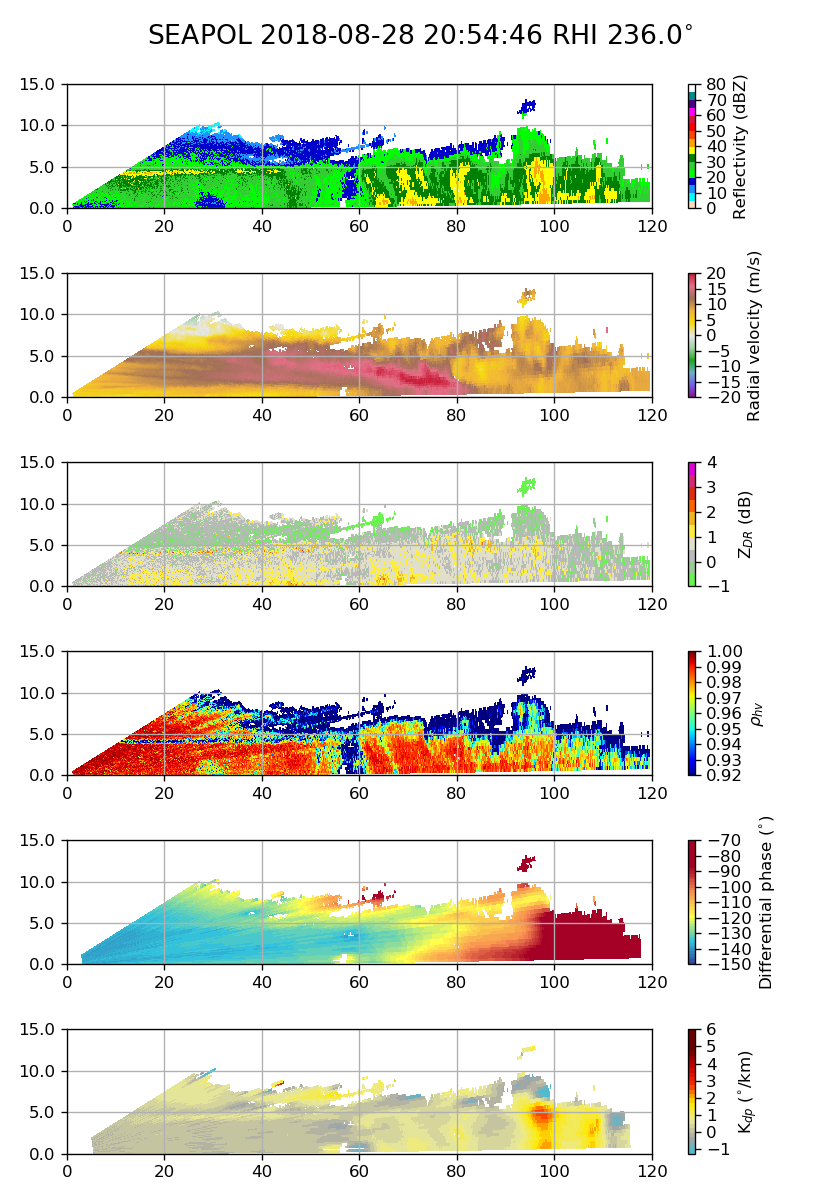
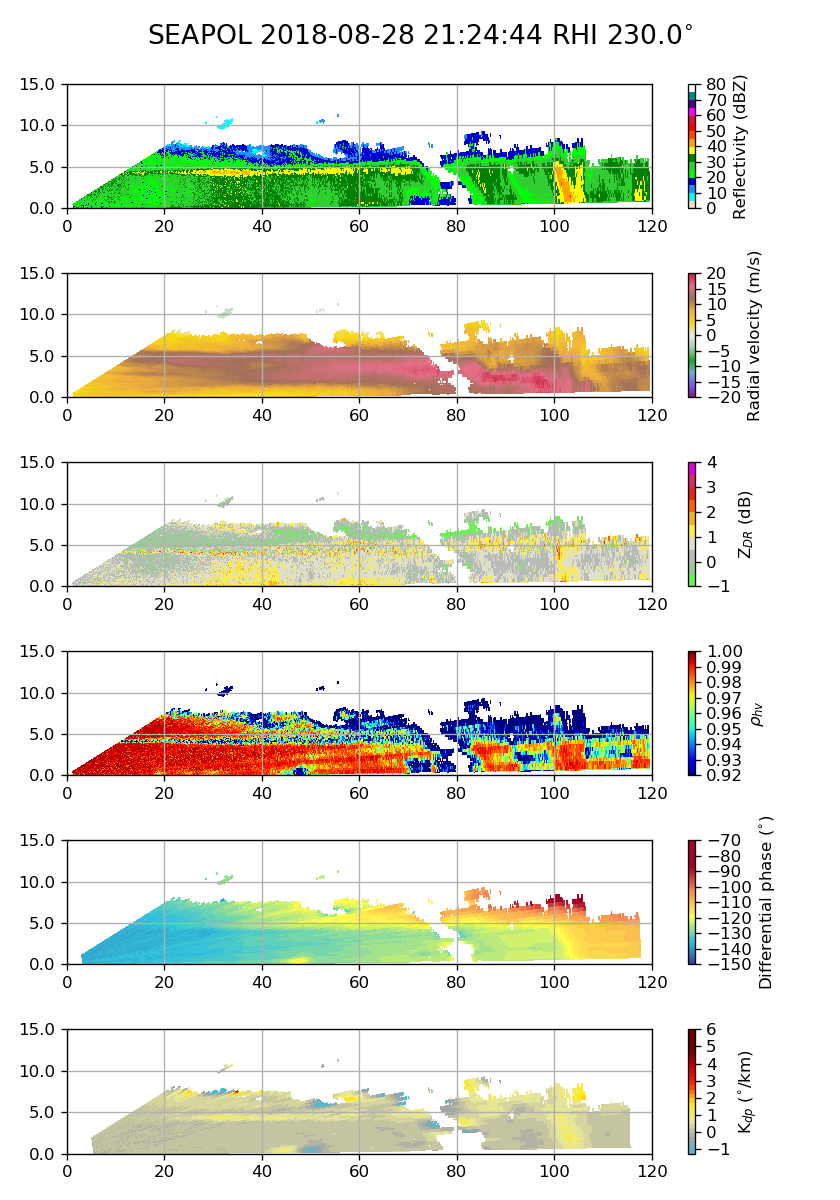
SEAPOL observed several interesting mesoscale structures during the night of August 28, and not all of them can be detailed herein. First, a collection of low-level scans every hour from 1215 to 2115 UTC is shown (Figure 11). After this, the ship turned toward the north and the MCS moved away. At 1215 UTC, a small area of echo was seen to the north of the ship. This was the southwestern extent of an echo object that was blocked by the bridge and was part of the cloud complex that contained lightning. Over the following 3 hours, the convection north of SEAPOL moved southward, and new scattered convective elements developed south of the radar. The area of convection to the north continued to just barely stick out into the view of SEAPOL throughout the night. By 1815 UTC, an intense convective line had developed to the SE of the radar, and it was accompanied by a growing region of stratiform precipitation. By 2015-2115 UTC, the convective echoes sped away to the southwest, leaving behind a broad region of stratiform precipitation with a few small embeded convective echoes. Figure 11a is an hour long time series of W-band cloud radar data from 2200-2300 UTC. An area of high reflectivity with large downward vertical velocity was observed between 2200 and 2230UTC and may have been associated with fast falling graupel. Indeed, SEAPOL scans indicated a shallow convective cell just a few kilometers southeast of the ship. Figure 12 is an RHI through the convective element to the north of the radar at 1410 UTC. The convection is clearly tilted toward the north, and a hint of a mid-level rear inflow with winds of 10–15 m/s is present. Interestingly, an area of high low-level ZDR is located to the north of the strongest convective echo, but in this case, the ZDR core is not on the edge of the convective element as illustrated in previous days. As the area of convection matured, the rear inflow became more prominent (Figure 13). The jet propagated from north to south across the stratiform region before finally weakening. Other examples of a descending inflow can be seen in Figure 14 (1825–1857 UTC) and Figure 15 (1924–2124 UTC). By 22 UTC (Figure 16), most of the deep convection had moved to the southwest of the ship, and a largely suppressed area of convection was obvious between the ship and developing TC Jebi near 17N, 153E.