August 29, 2018
Persistent Scattered Convection Continues
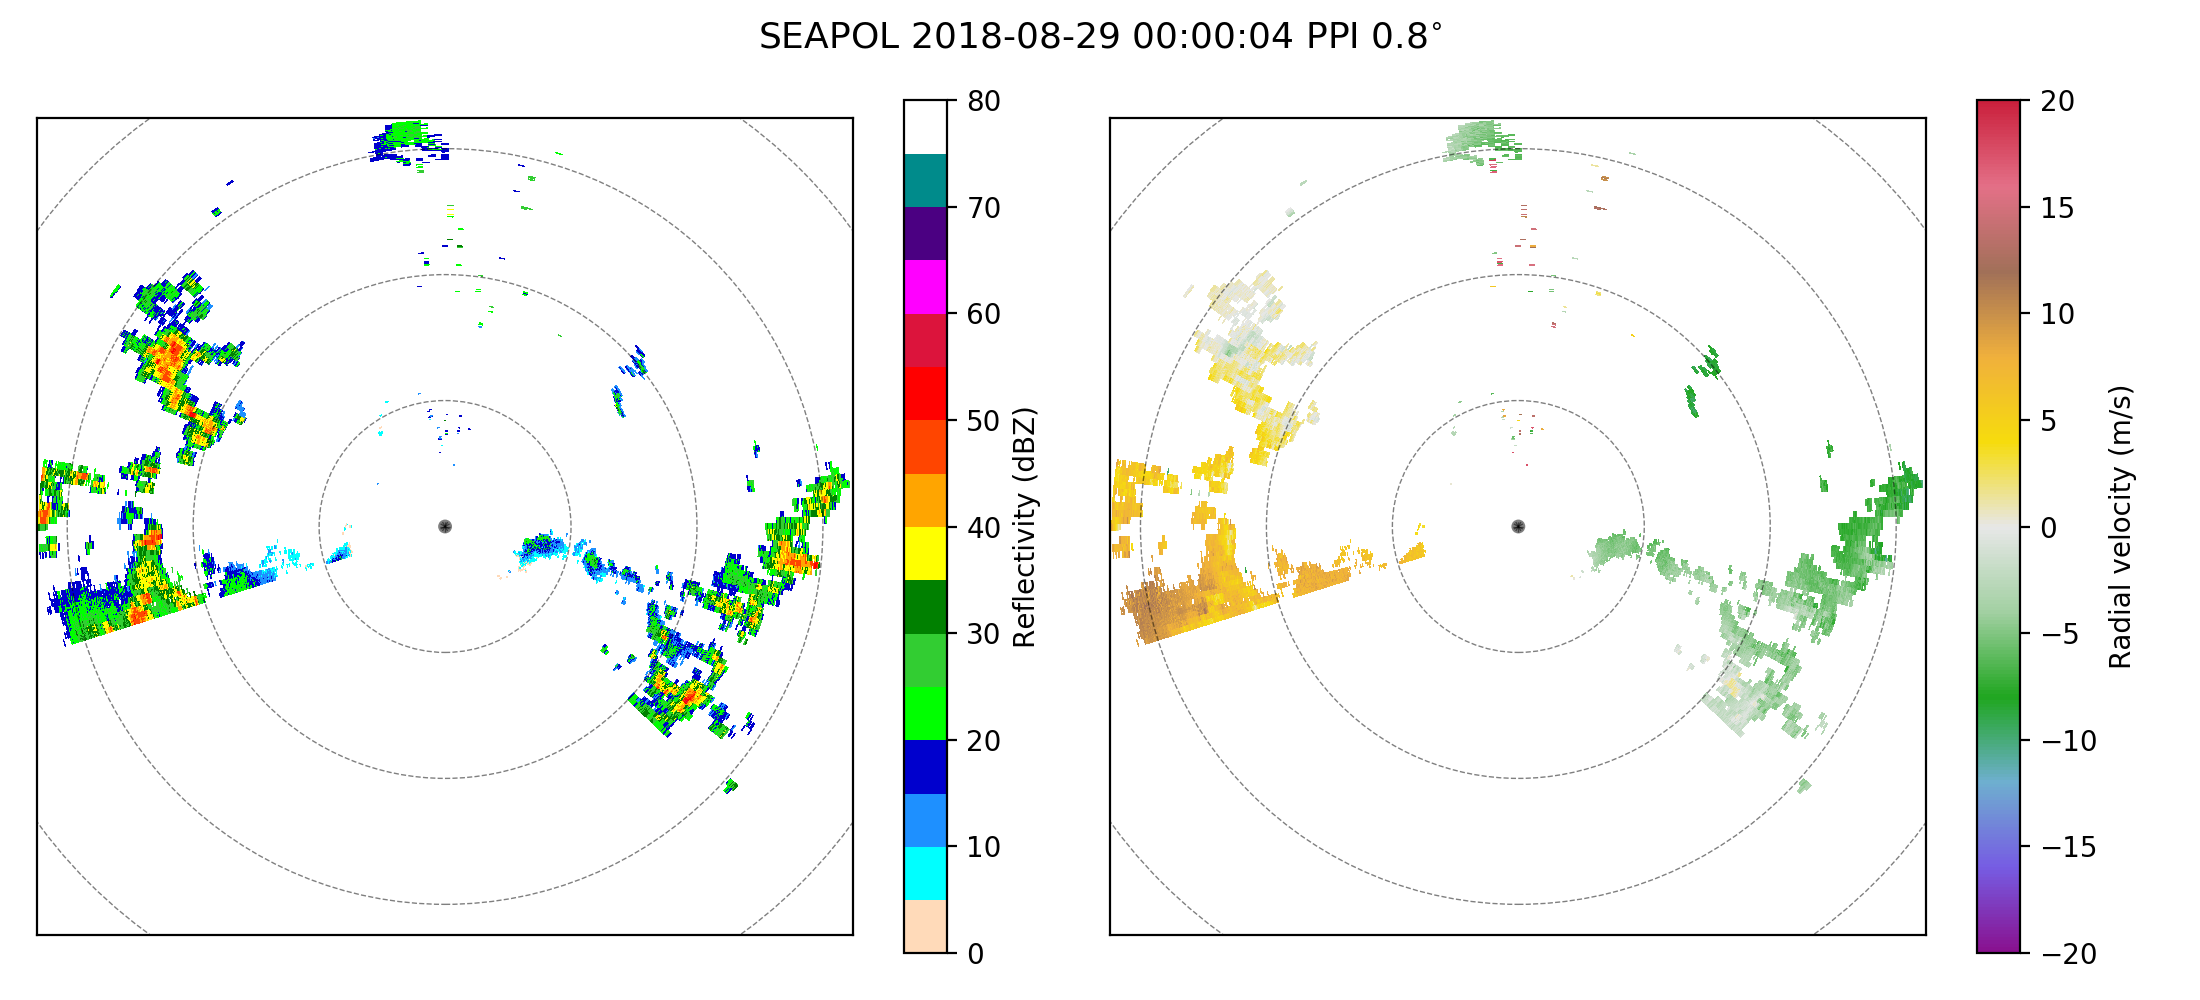
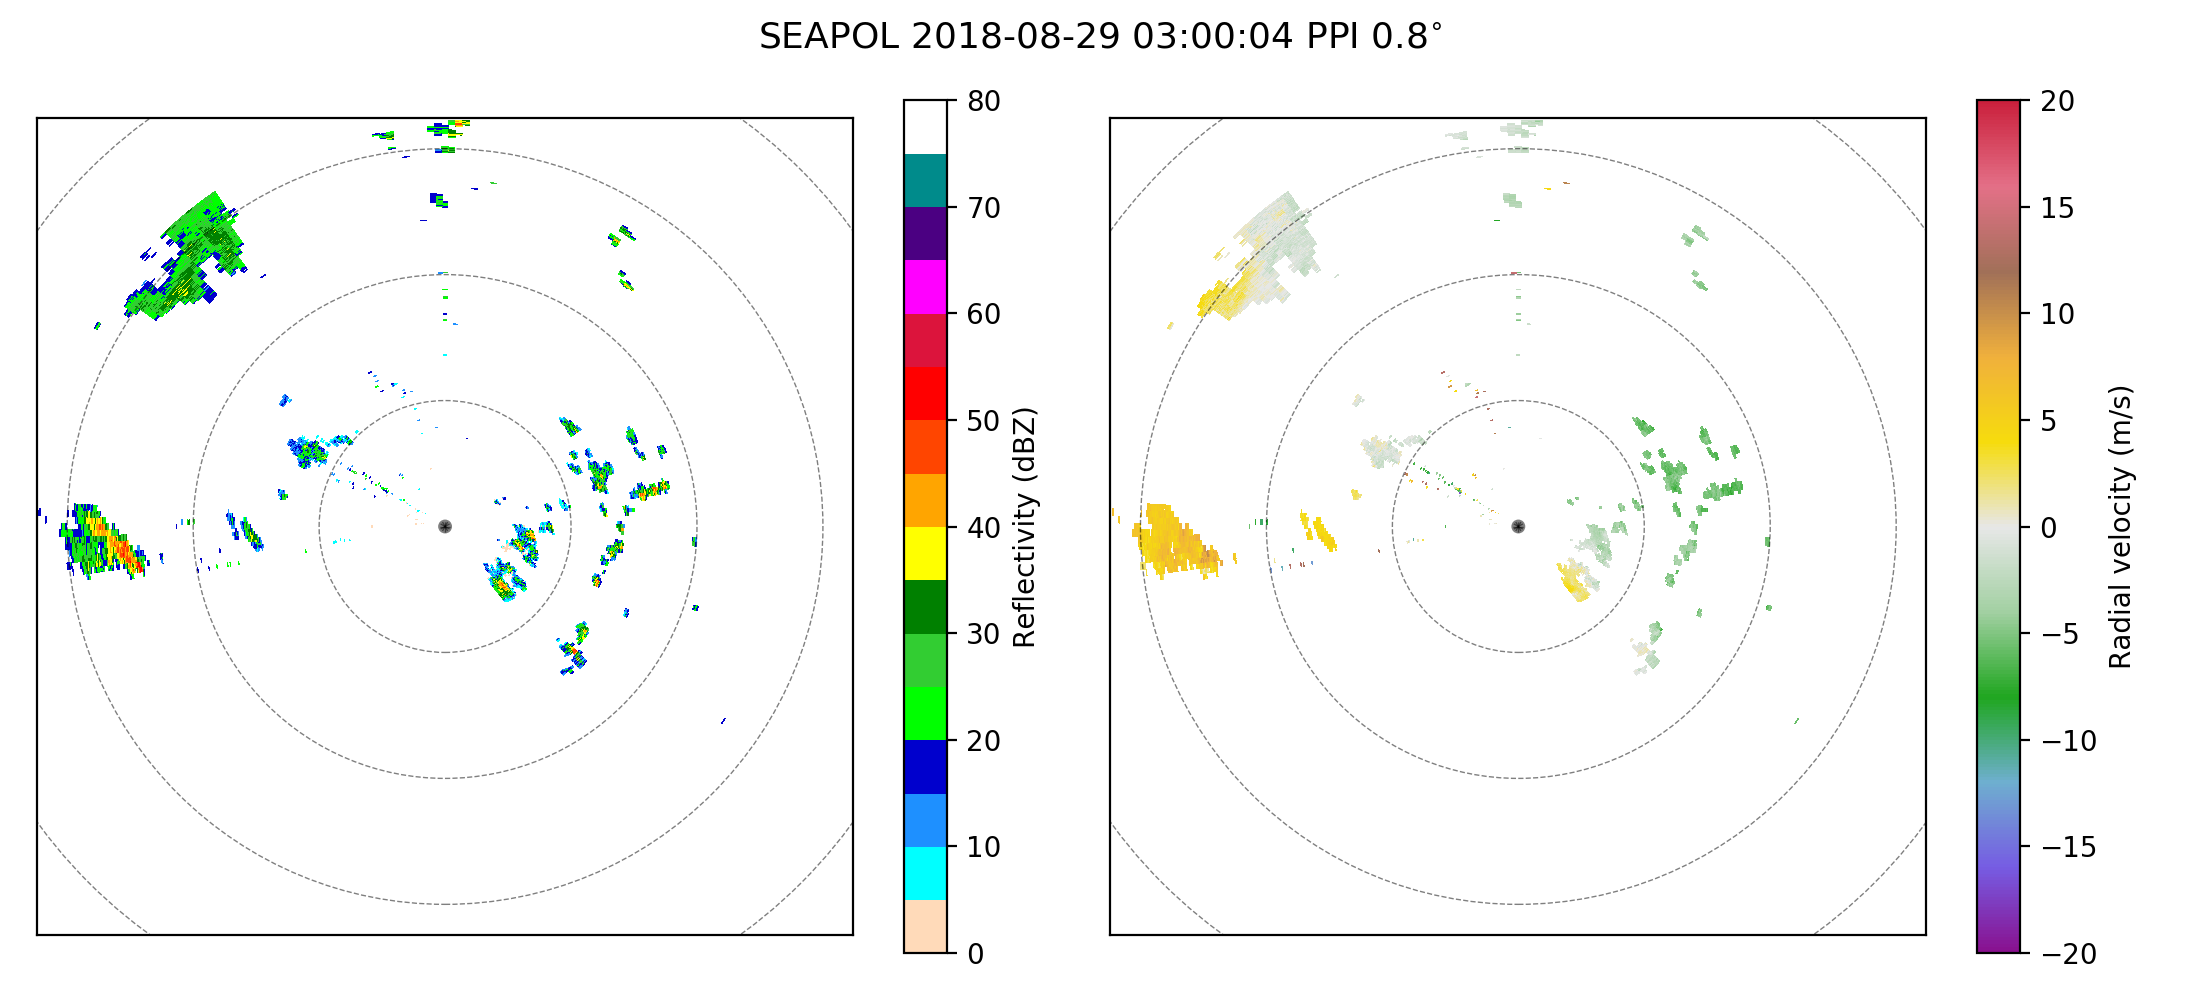
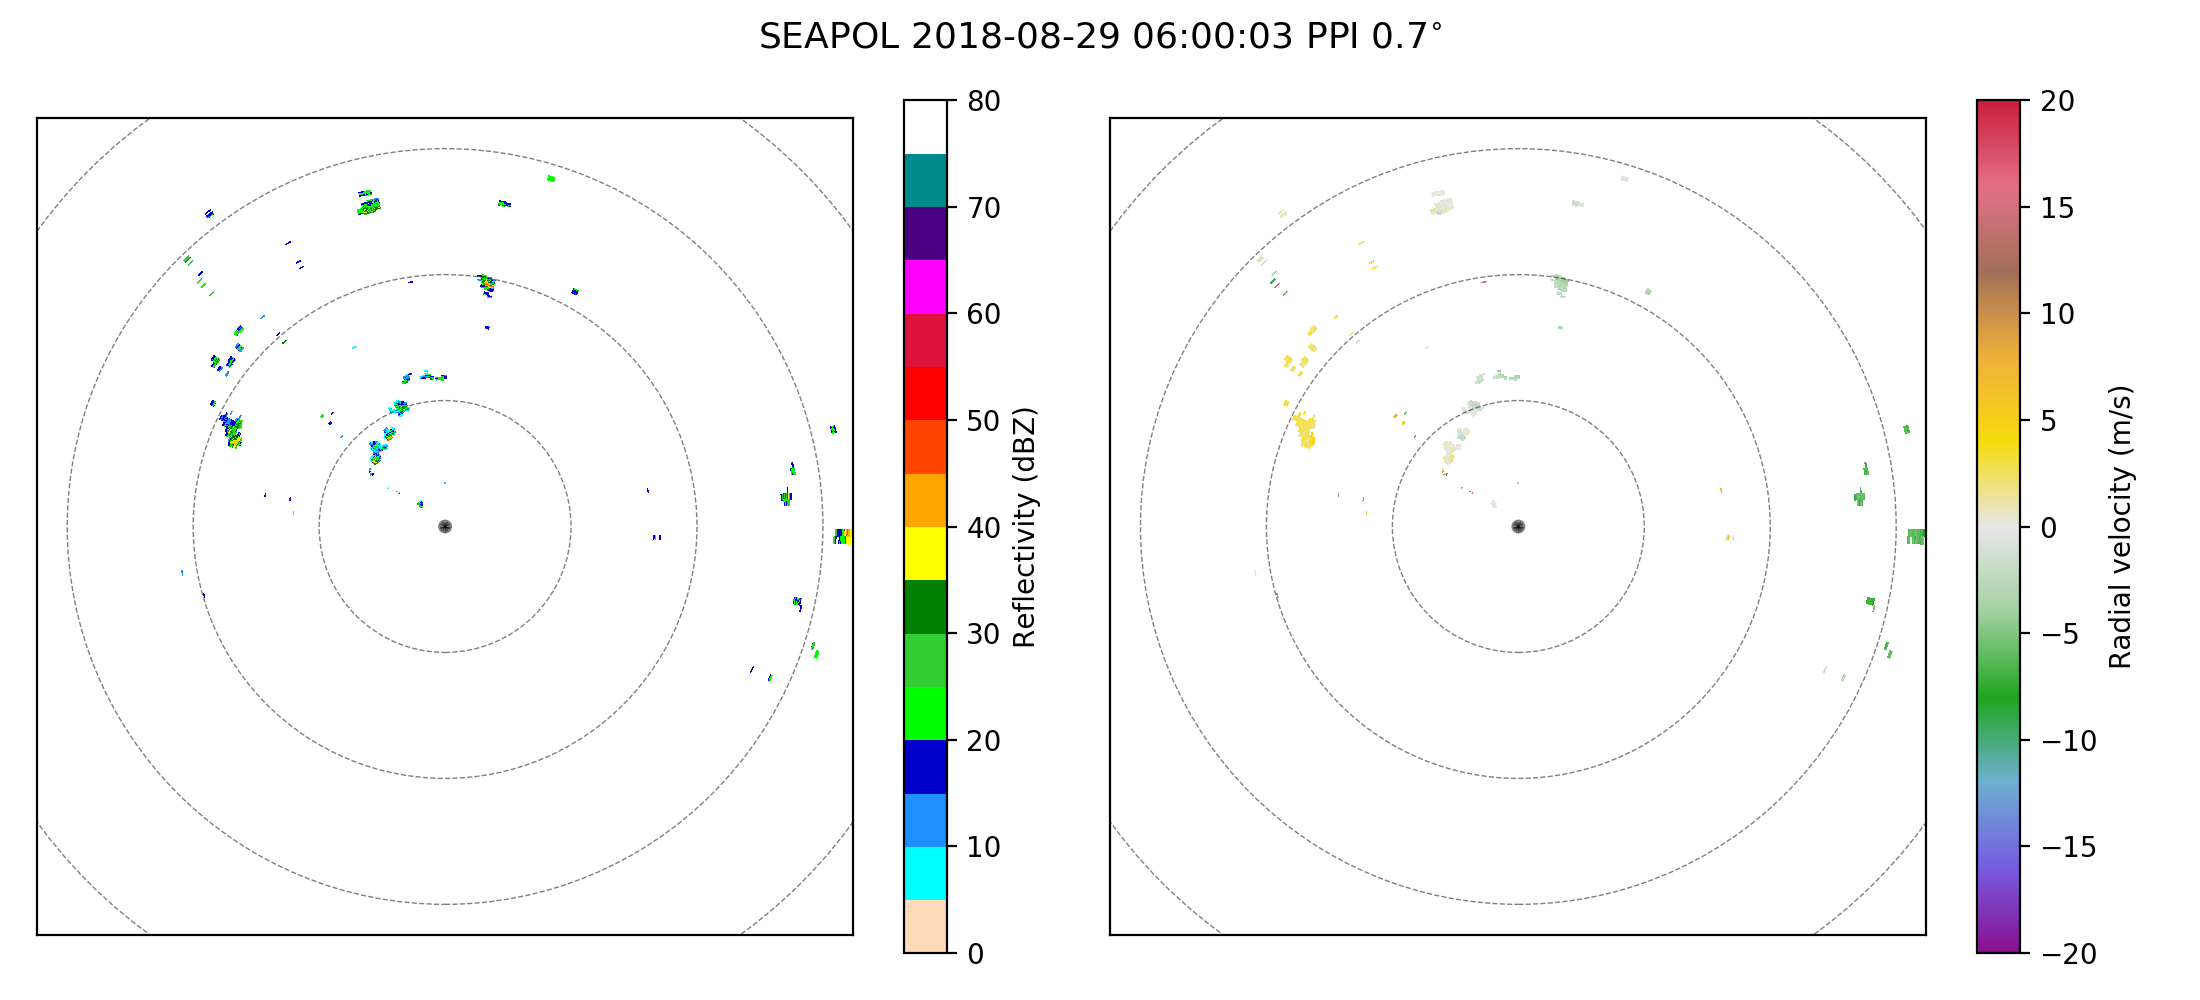
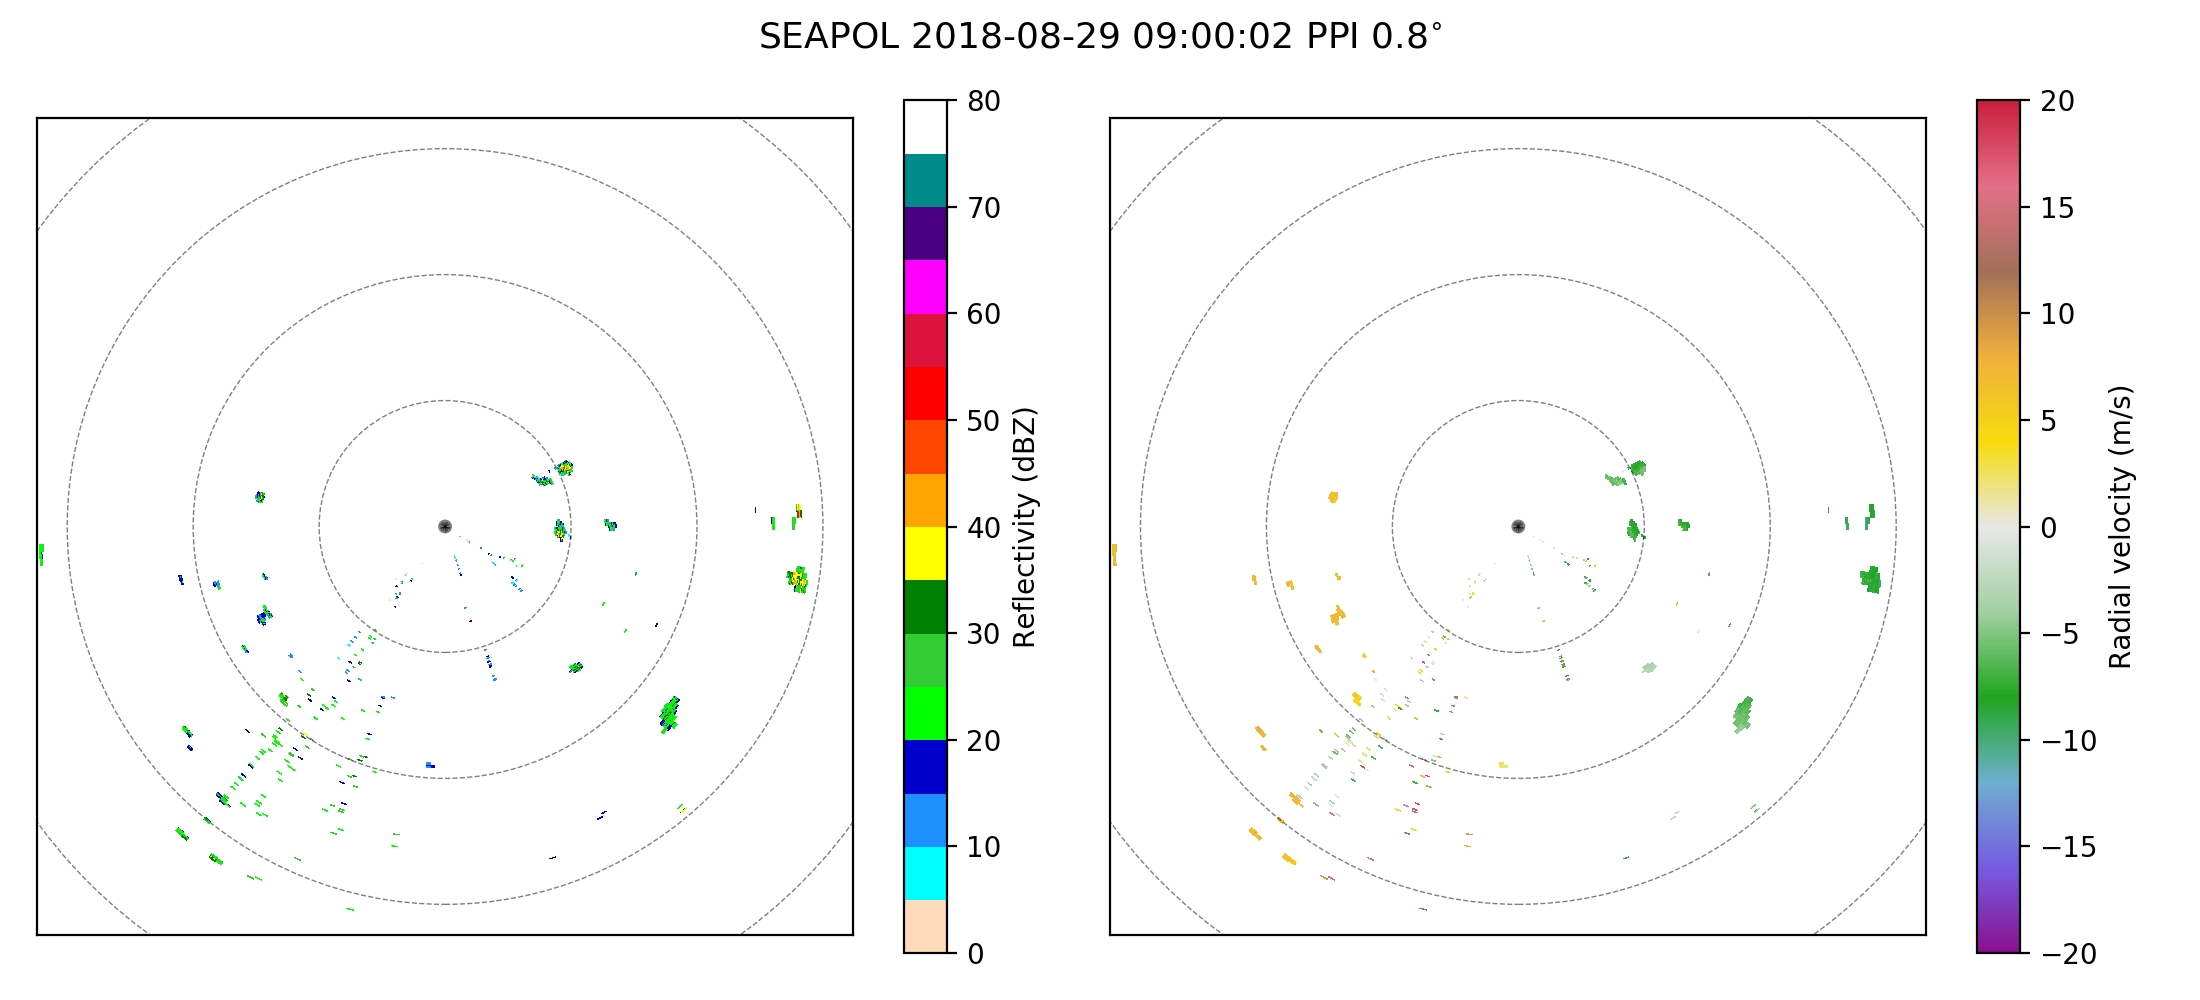
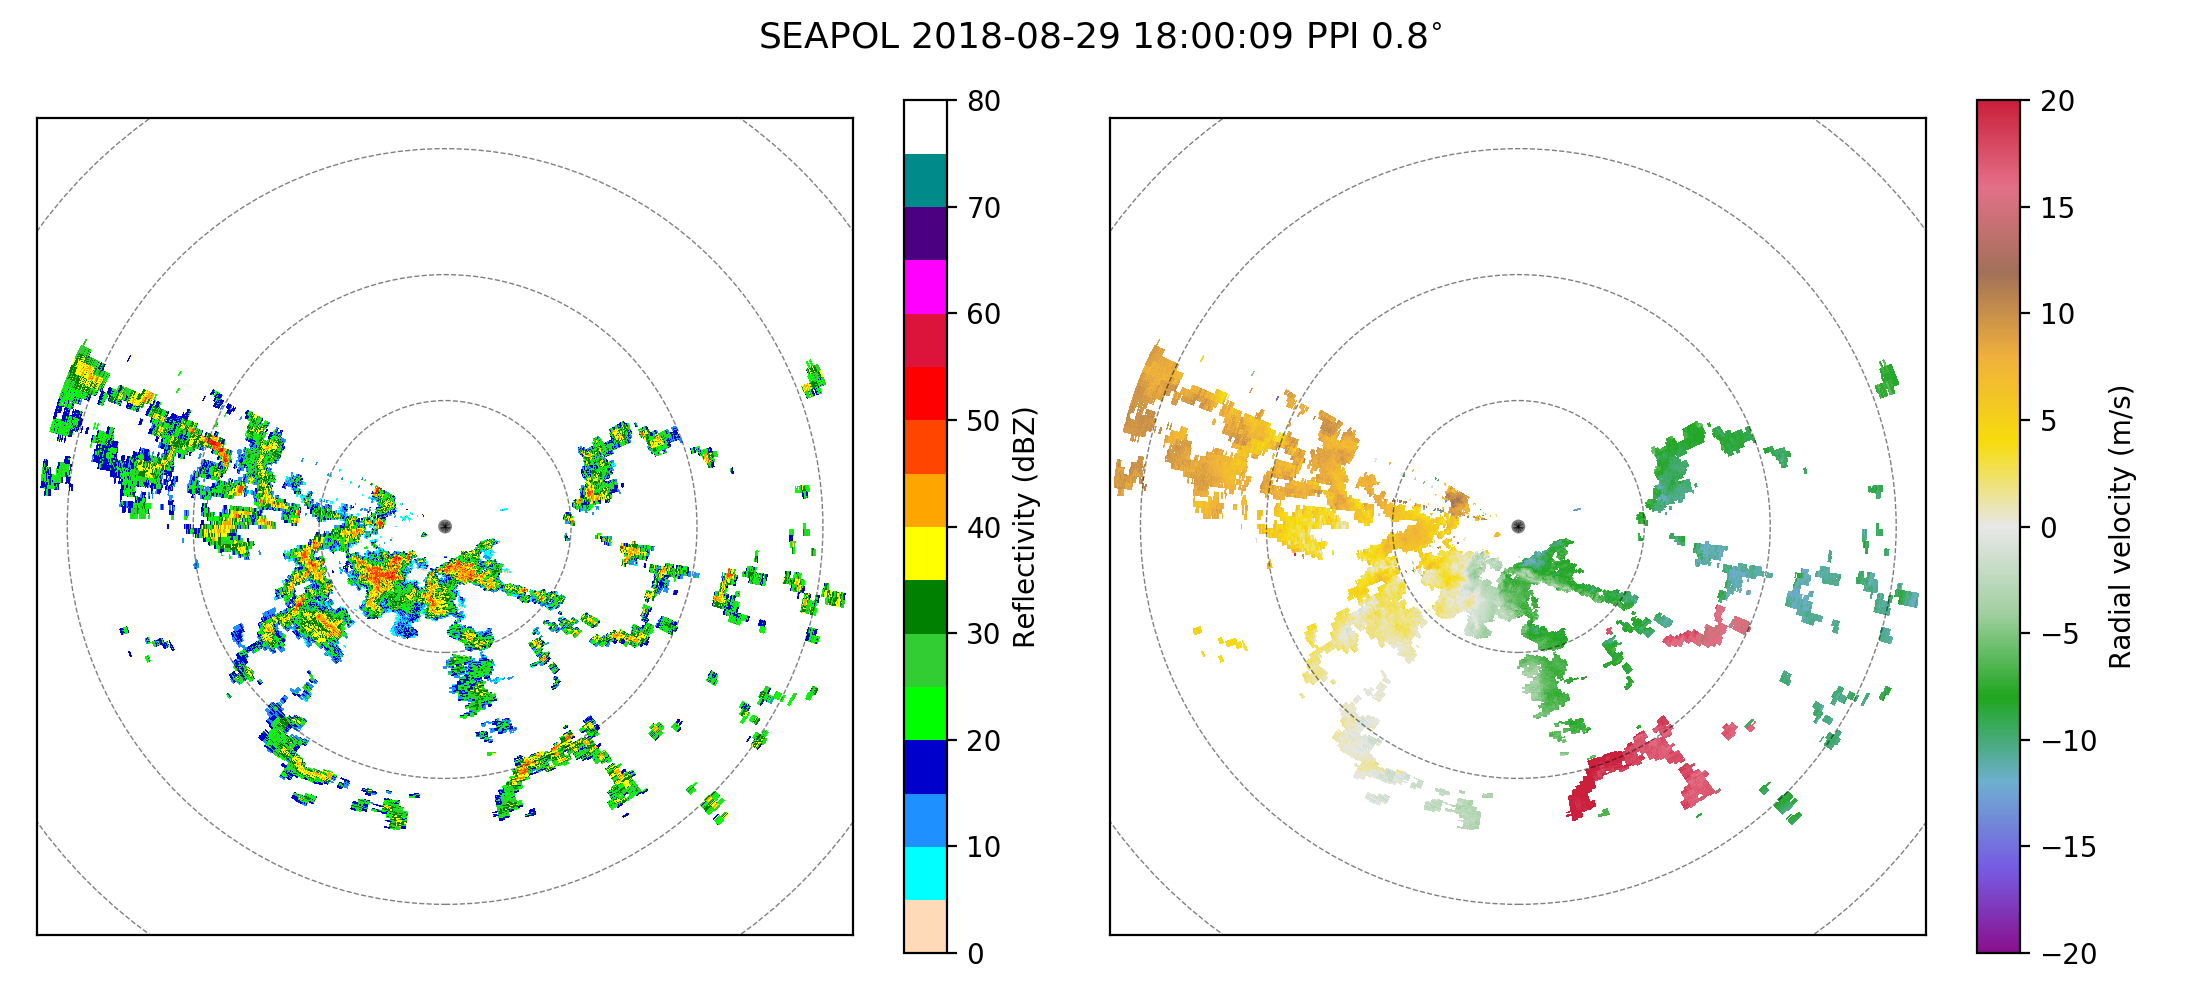
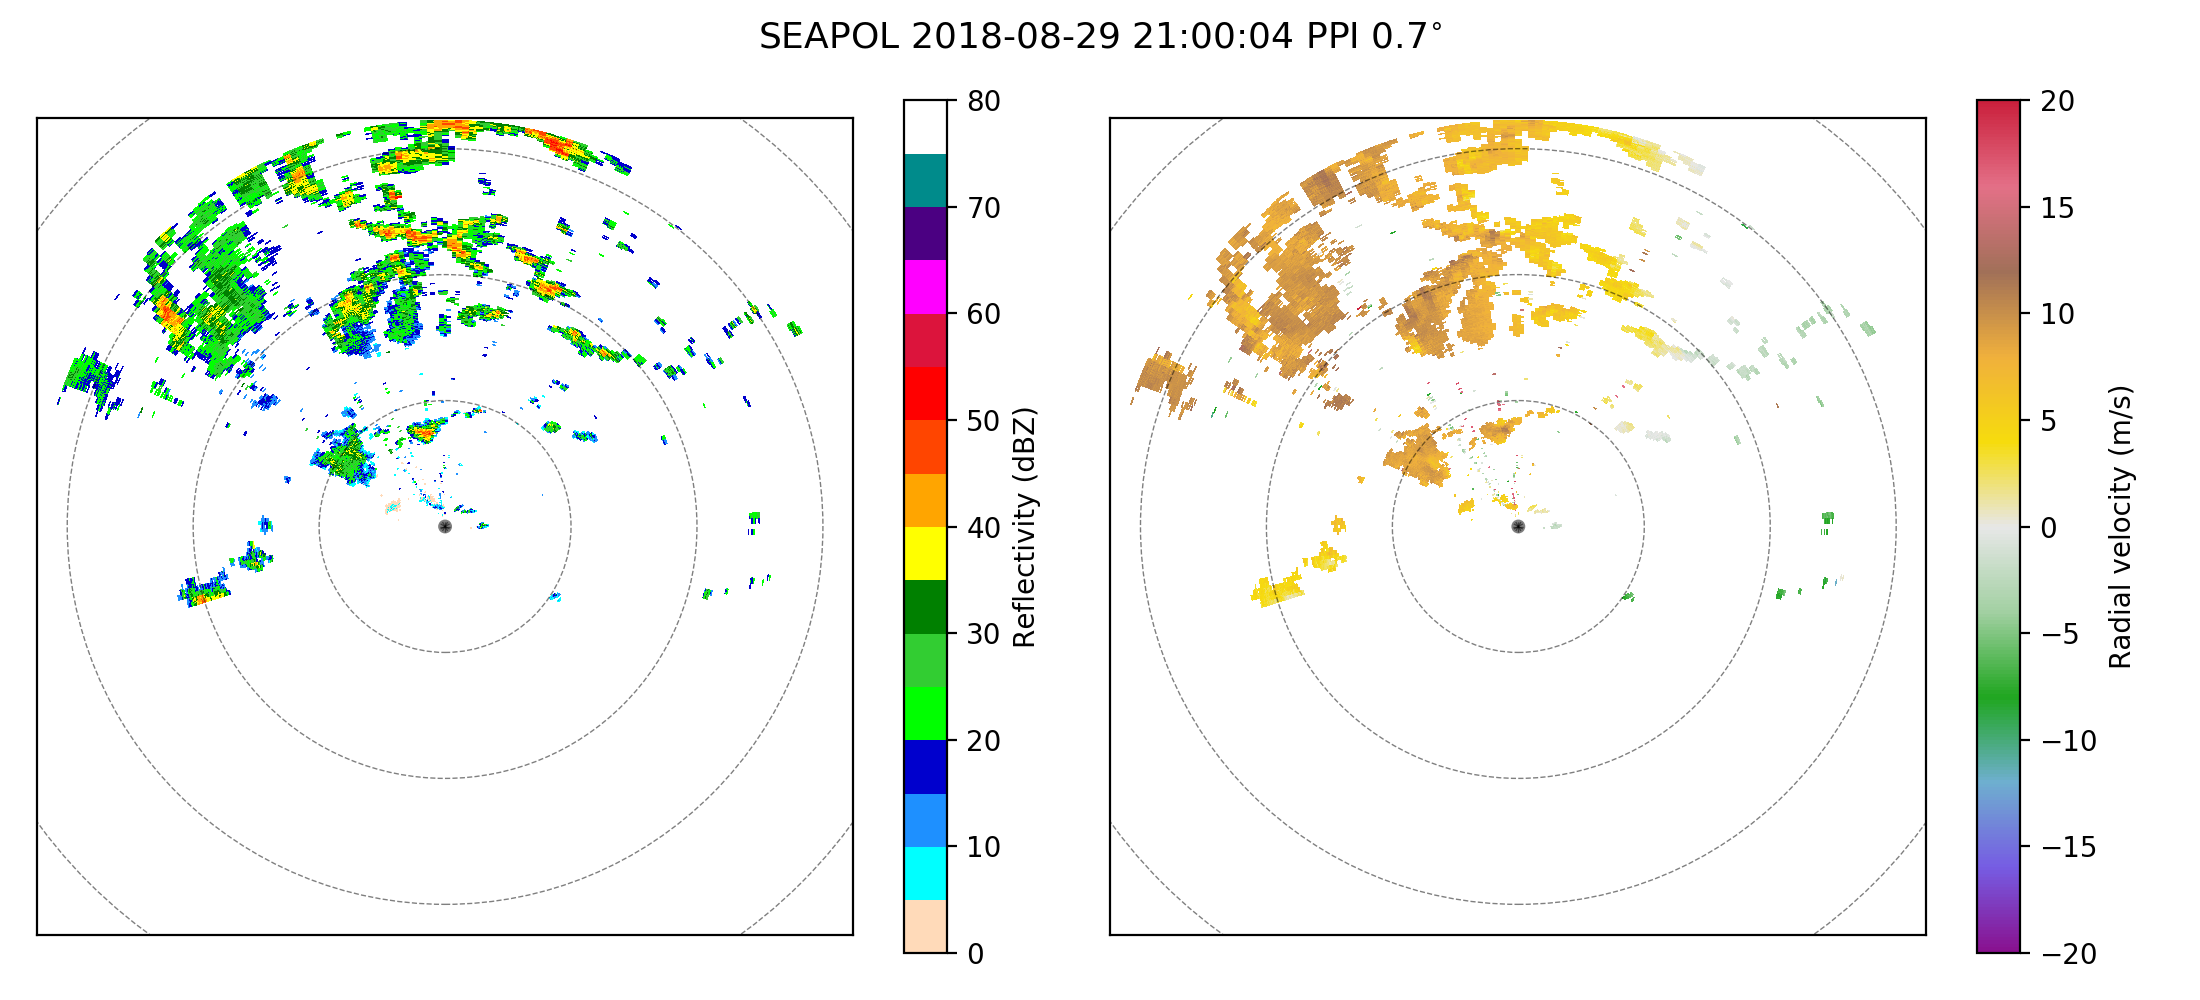
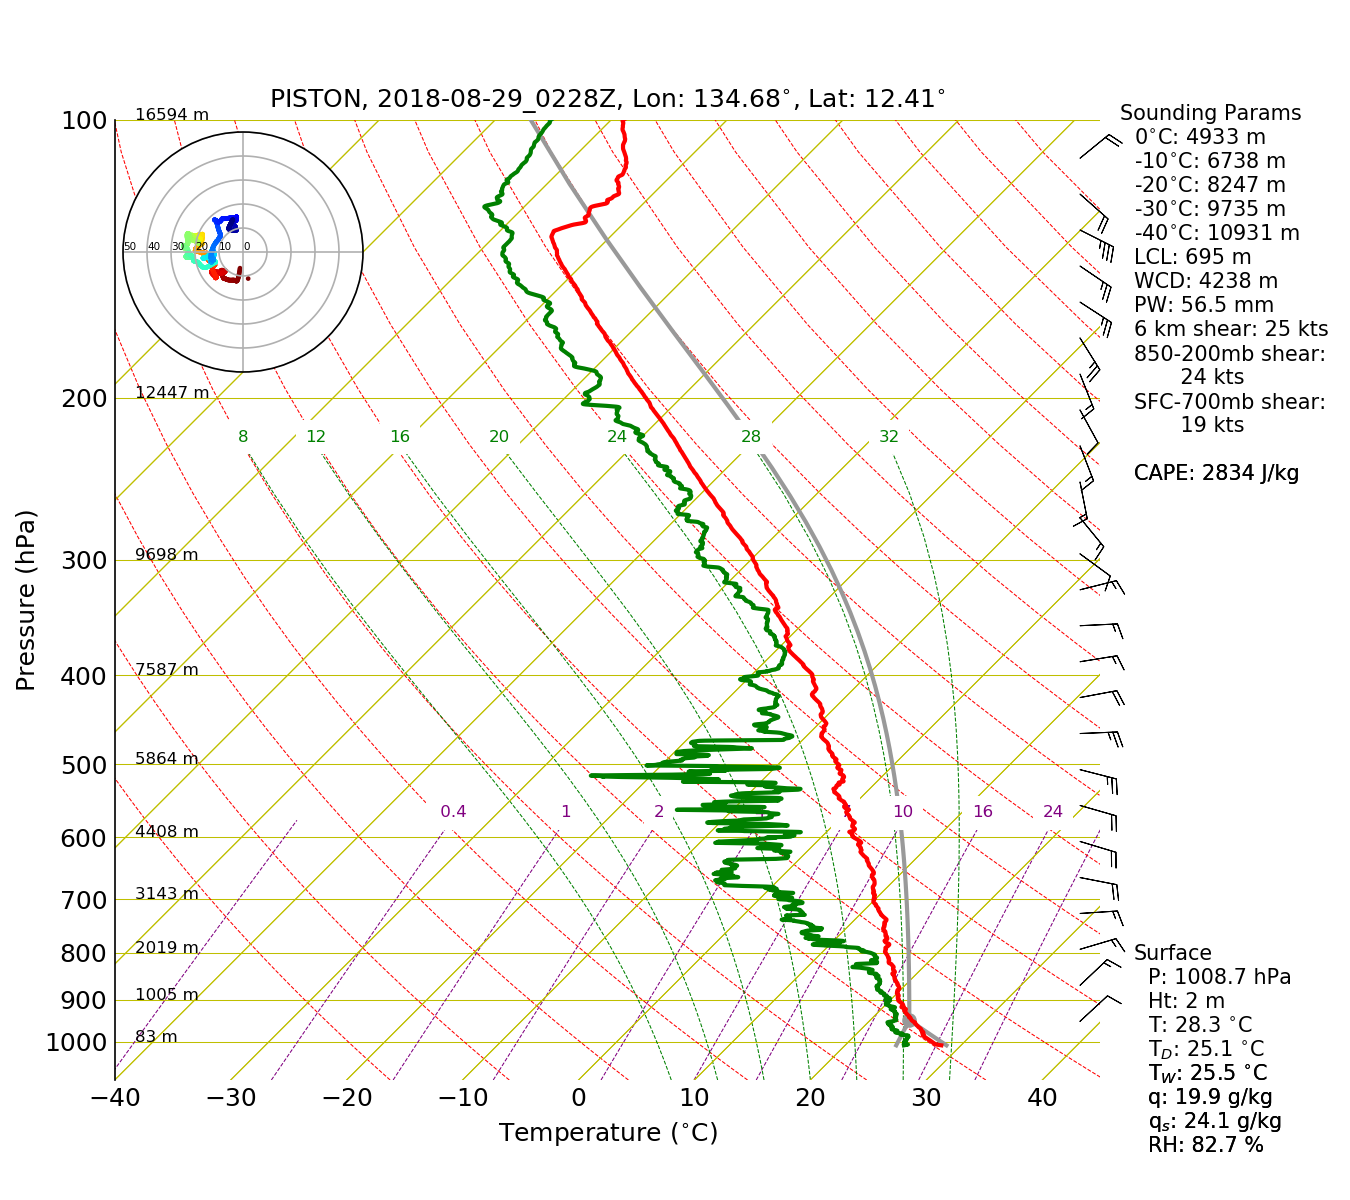
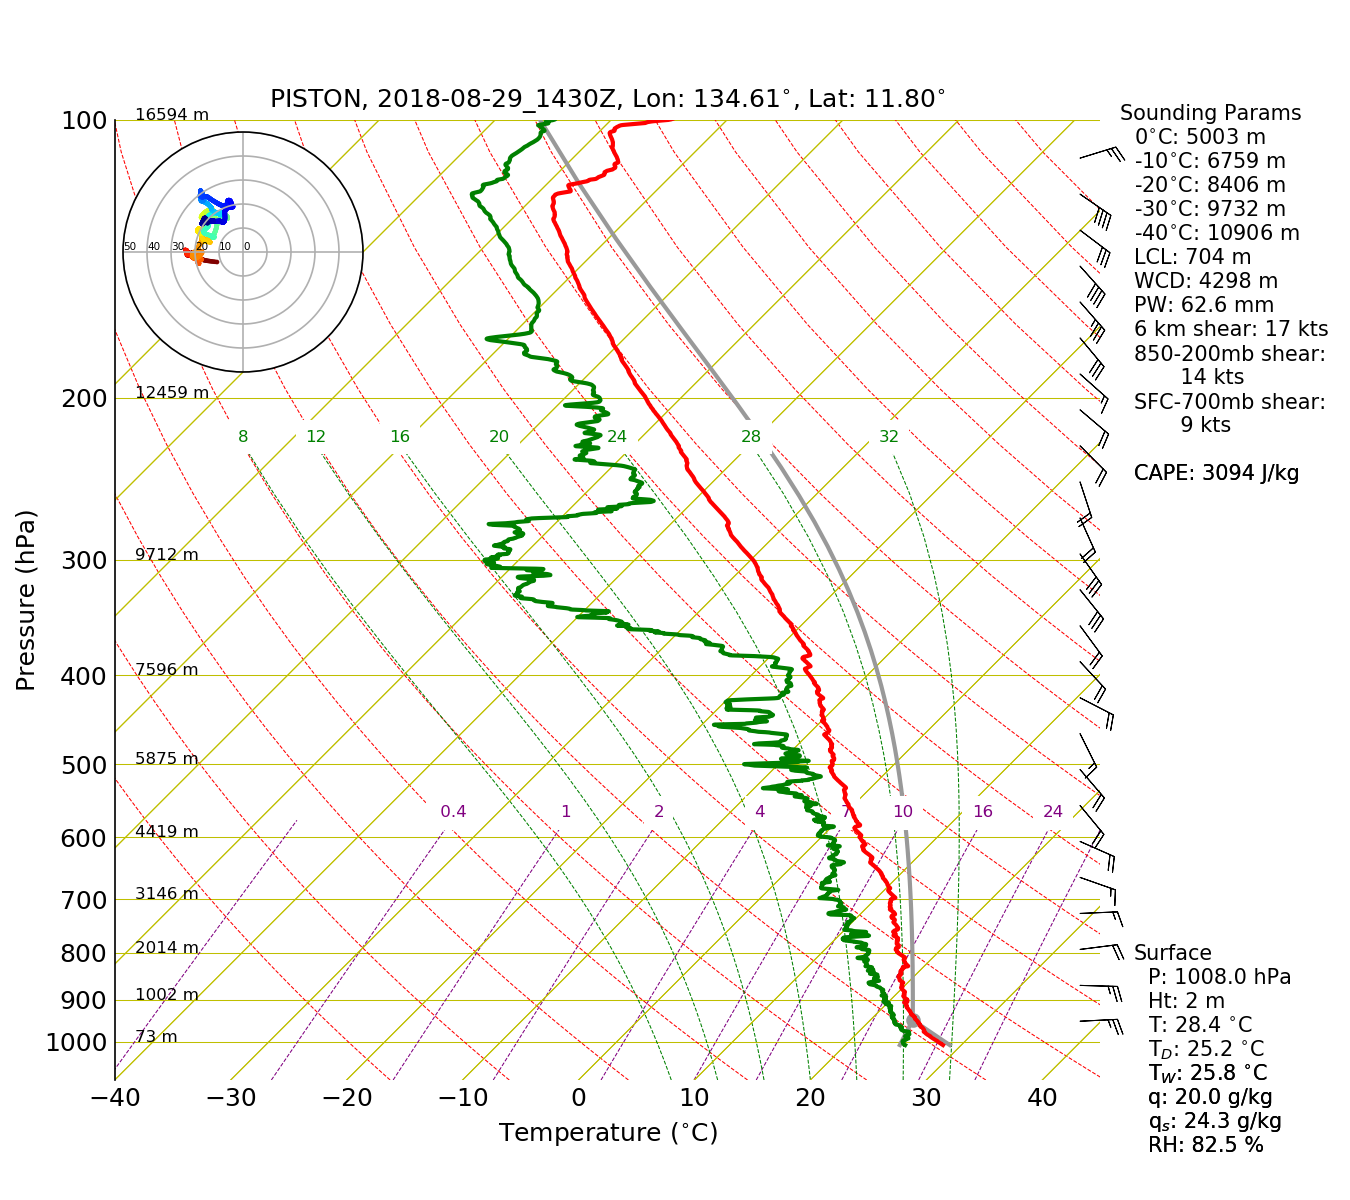
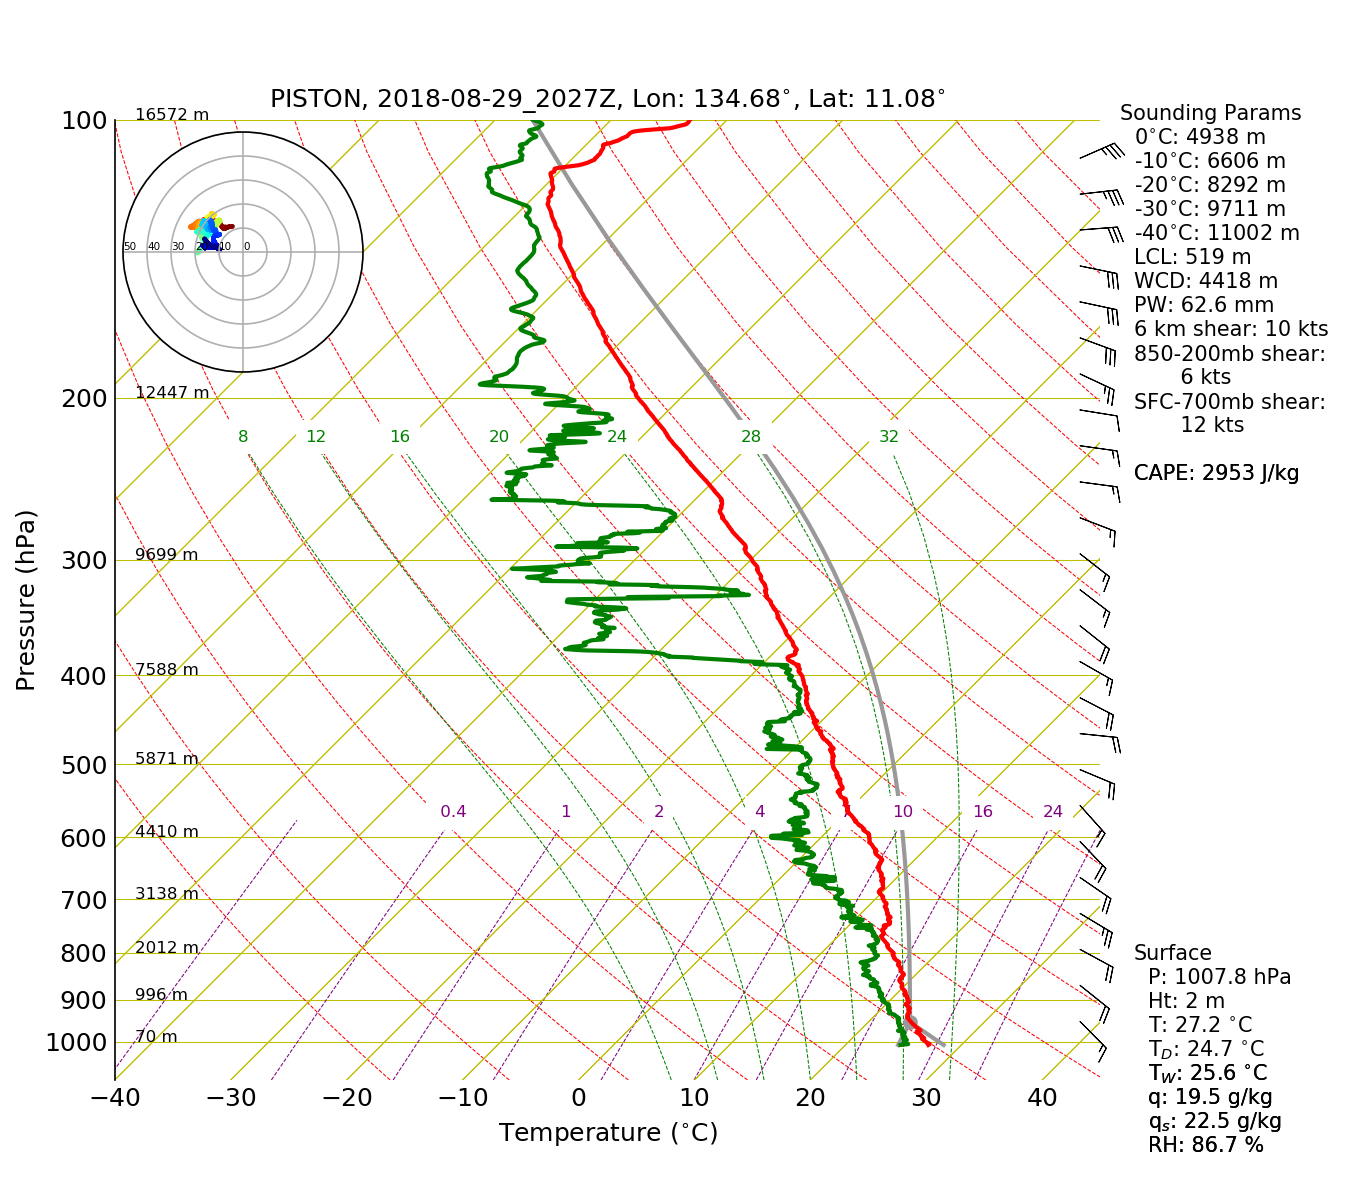
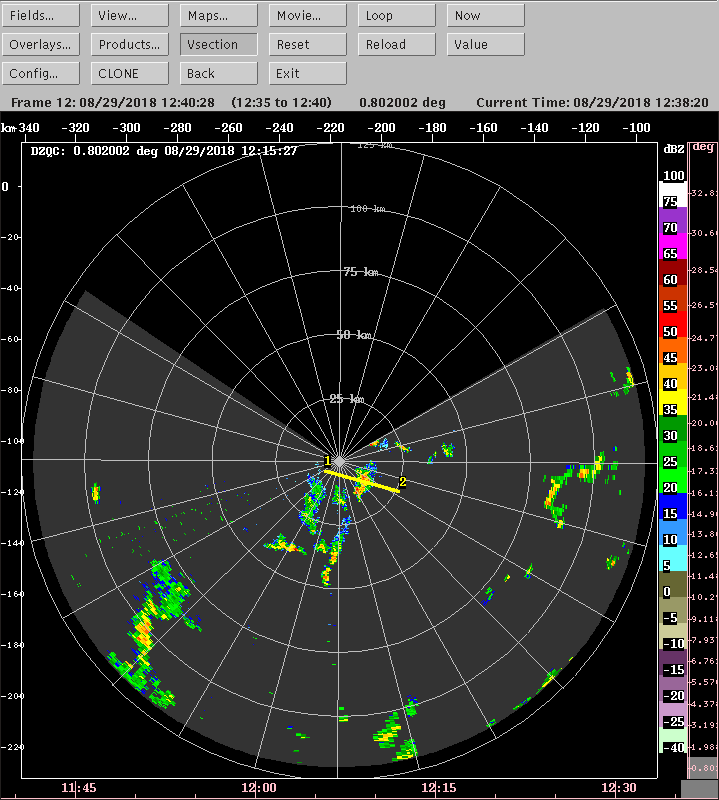
Scott Powell, Adam Sobel, Timothy Lang, Eric Maloney, Sue Chen, Philippe PapinScattered convection behind the MCS that developed around the ship on the 28th continued to move southwestward early on 29 August as the ship moved northward near 134.5E. The echoes reached as high as 16 km. At around 0700 UTC, the ship turned around and started moving southward from 11N. While a loop of SEAPOL PPI data relative the ship location suggests that the convection suddenly starts moving northwestward, this was of course, an artifact of the ship's change in direction. However, Doppler velocity data indicate that the motion of the convection did shift to northwestward sometime between 16 and 19 UTC. Figure 1 is a series of PPI images at 0.8 deg every 3 hours on 29 August. The change in direction of the convection was consistent with a shift in low-level winds from northeasterly at 03 UTC to southeasterly by 21 UTC as seen in the sounding profiles in Figure 2.
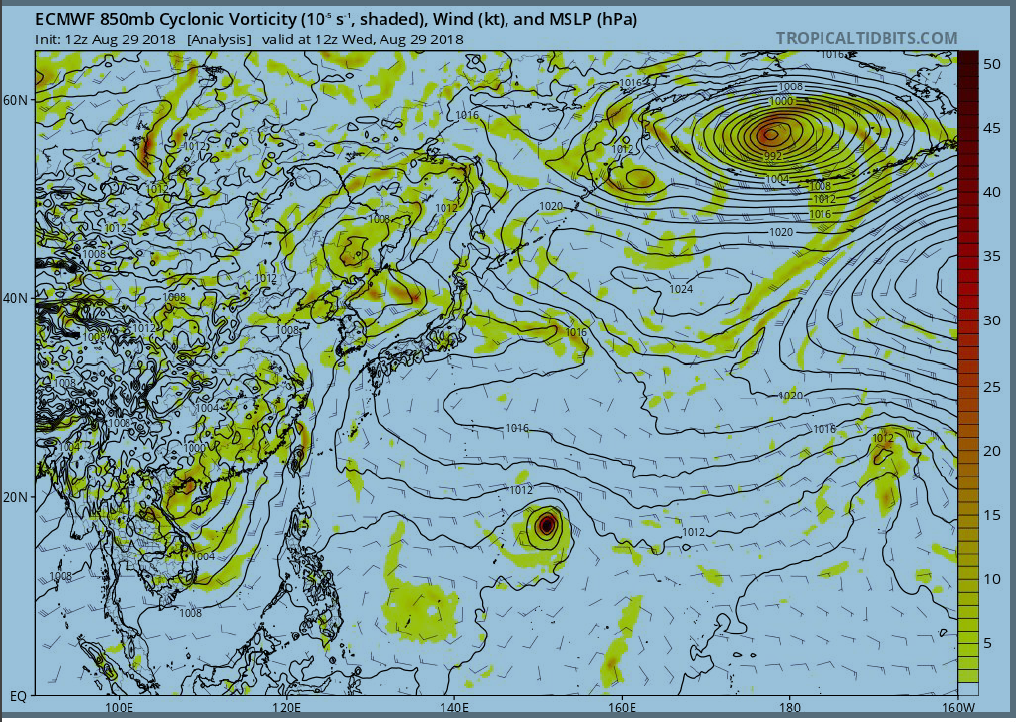
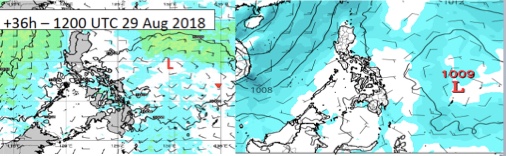
The ship was located on the eastward side of convection associated with a westward moving weak low pressure center analyzed by ECMWF at 12 UTC near 9N, 138E (Figure 3). The low was responsible for the wind shift observed near the ship. Satellite imagery of the convection at 0540 UTC is visible in Figure 4; the surface low actually lagged behind (east of) the convection by several hundred kilometers. By nighttime, the coldest cloud tops were located near 12N between 129E and 134E (Figure 5), and so the ship was located on the southeast side of the most intense convection at night.
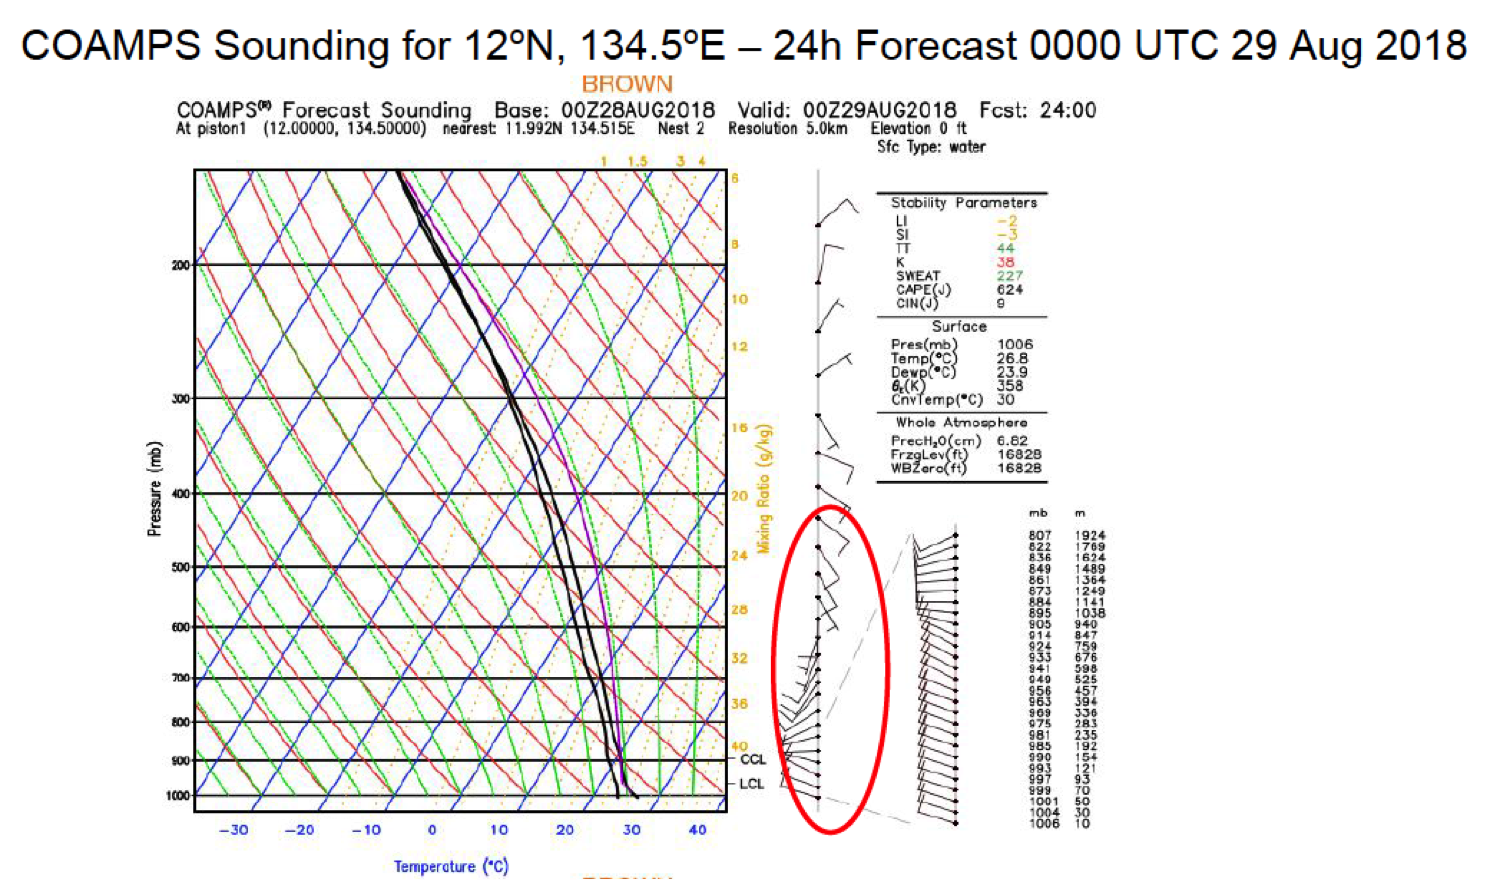
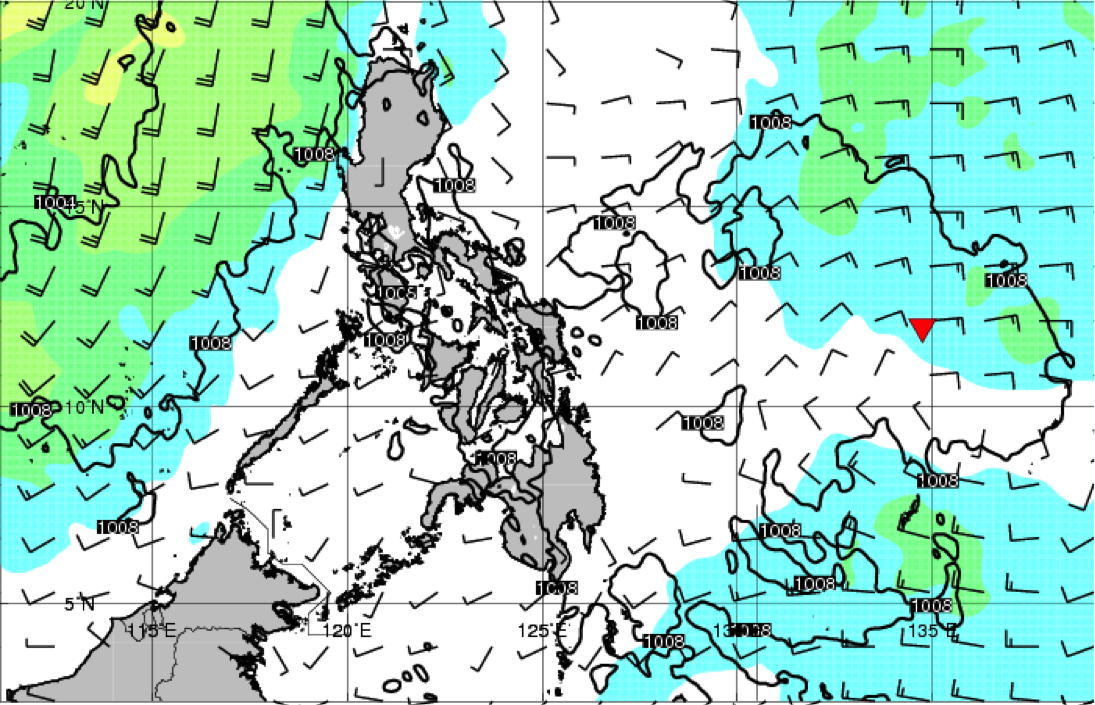
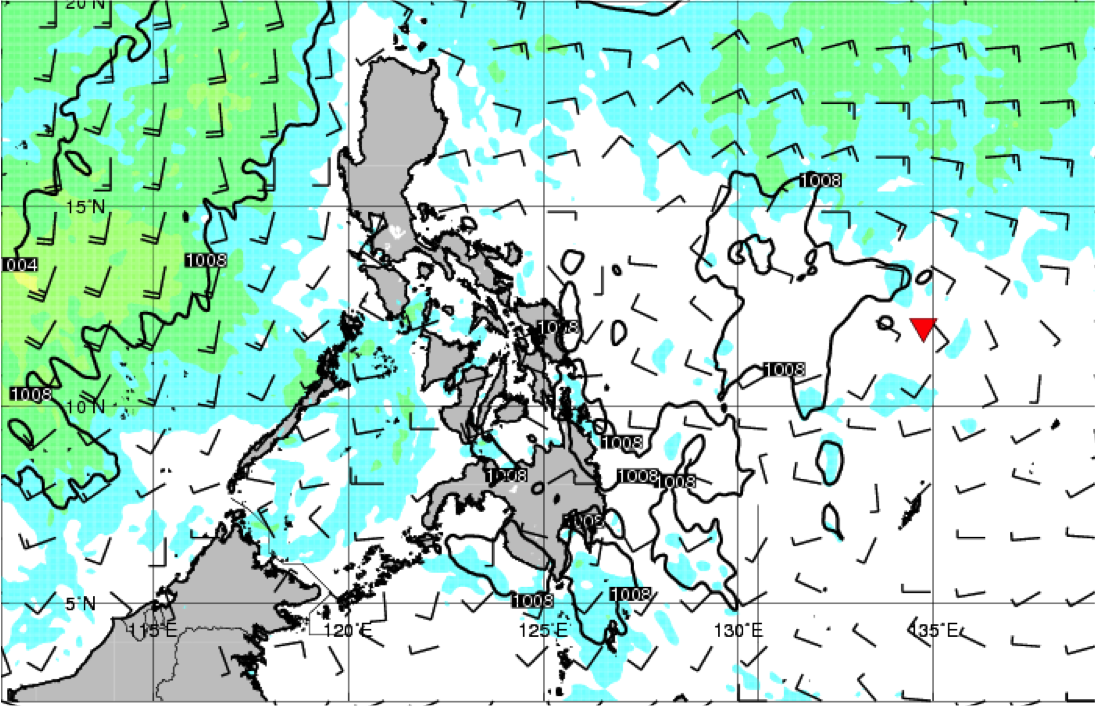
The soundings in Figure 2 show that we were in persistent easterlies at low levels (and high levels too for that matter), consistent with our position on the north side of the low pressure. Perusal of this in conjunction with synthetic soundings and meteograms from the COAMPS model in the CSU forecast briefing provided an opportunity for some field evaluation of that model's predictions. The model placed us persistently in low-level westerlies, as shown in Figure 6, which should be compared with Figure 2. Figure 7a shows comparisons of surface pressure and wind between COAMPS and GFS. While the GFS fields here are also forecasts, they would turn out to verify much better than COAMPS (as one would expect given the differences between COAMPS and the soundings shown above), and the difference in any case is striking. COAMPS places the low too far north early on, and then strengthens it much more and moves it further north and west than GFS. Tomorrow's summary will show that the GFS (as well as ECMWF, which agreed with GFS, not shown) was much more accurate here. We suspect an initialization problem, and this is consistent with results from the next available run, initialized 12 UTC on the 29th, shown in Figure 7b. The surface low and cyclonic circulation center jump several hundred km to the northwest between the analysis and the 3-hour forecast. This problem appears to have been fixed subsequent to this, as will be reported in summaries to follow.
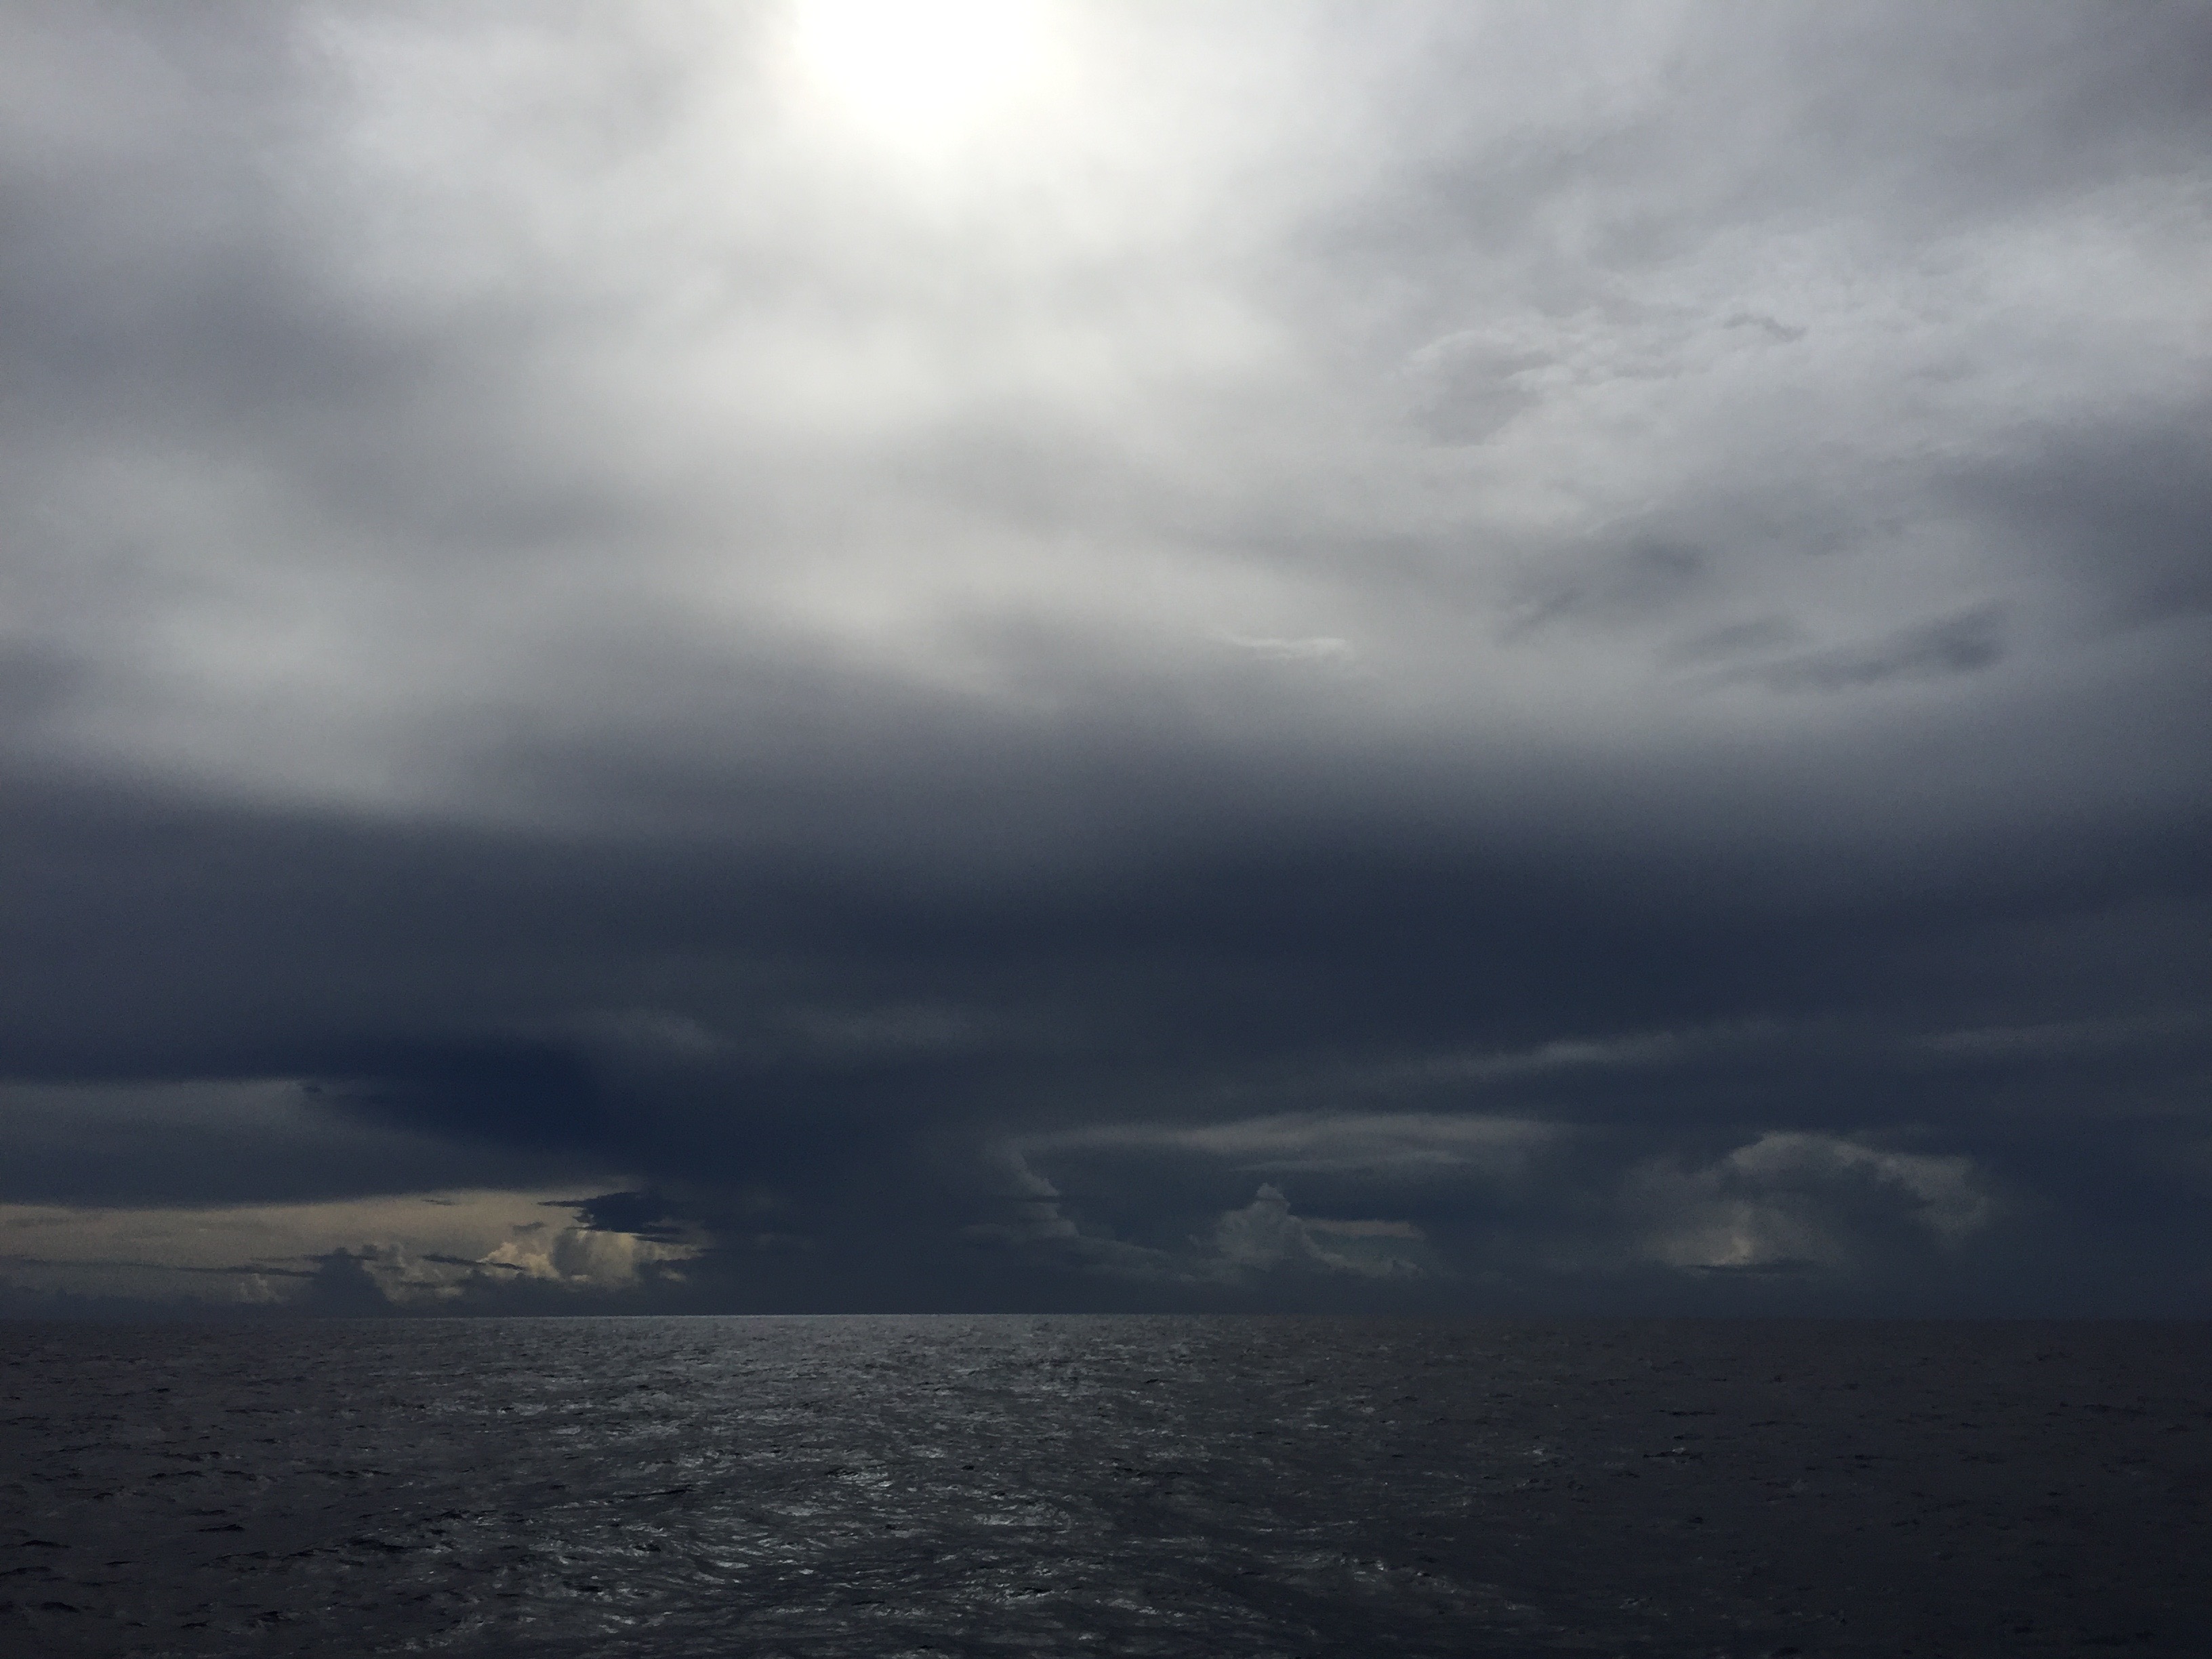
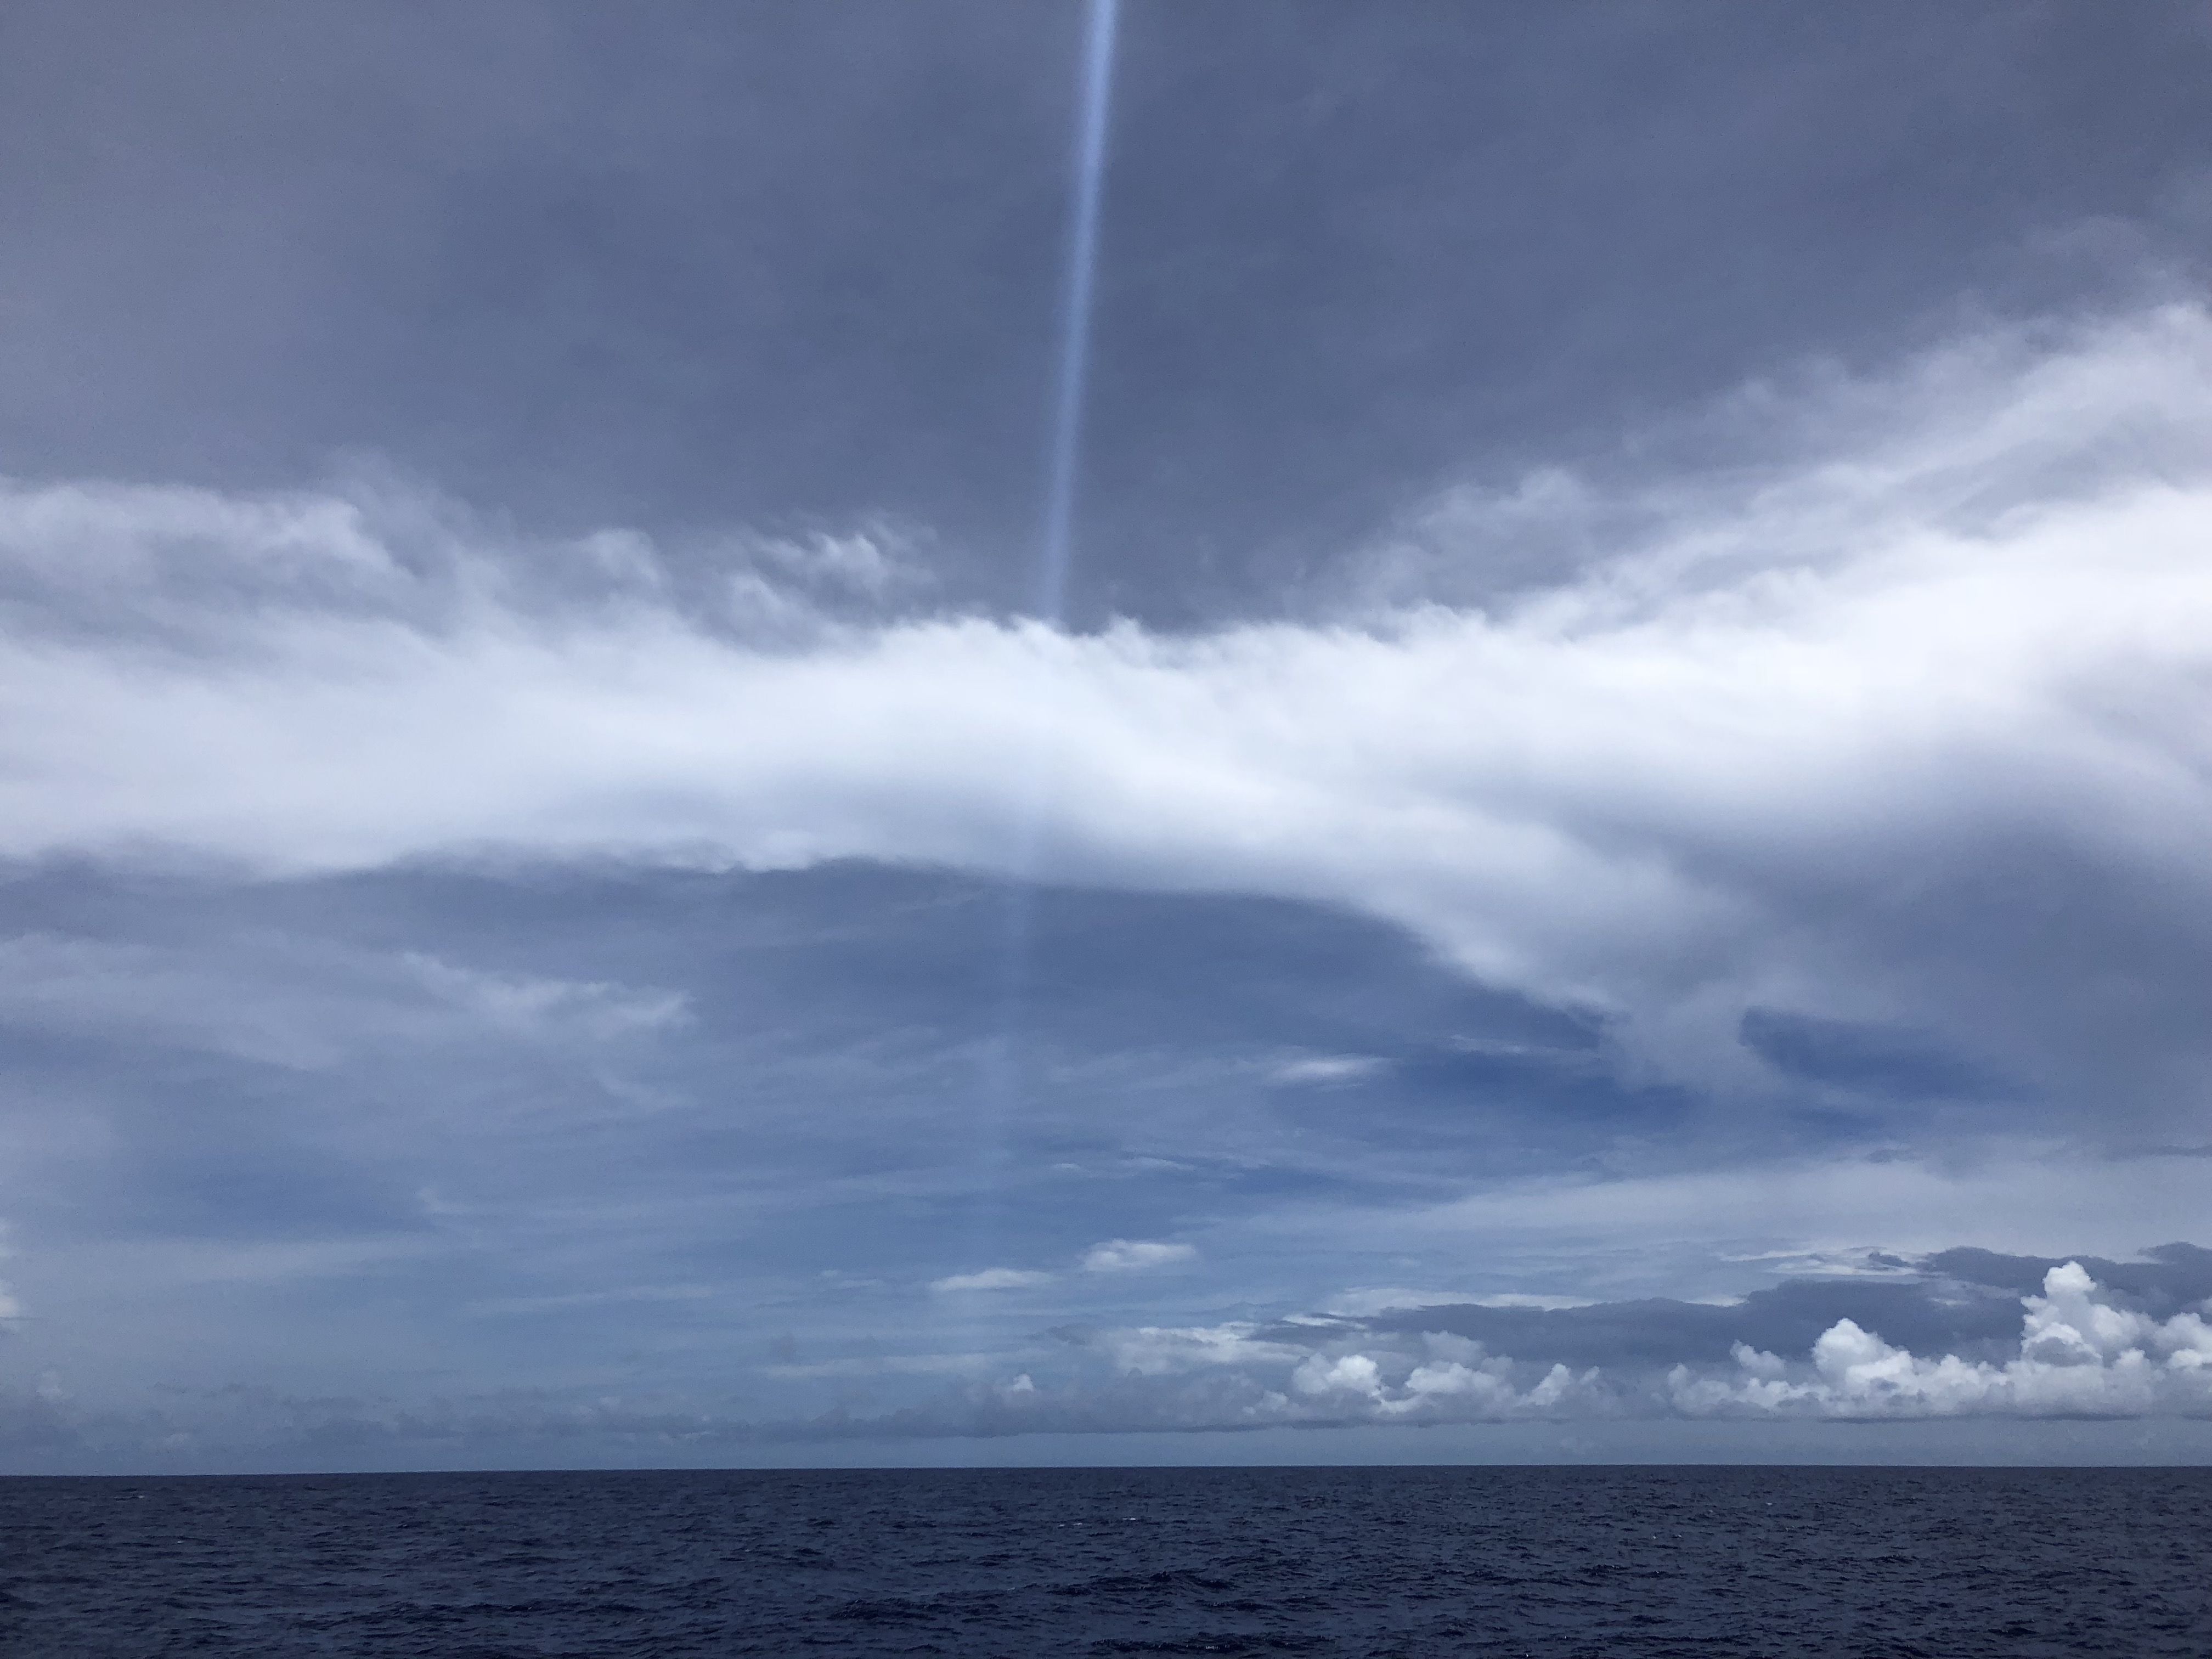
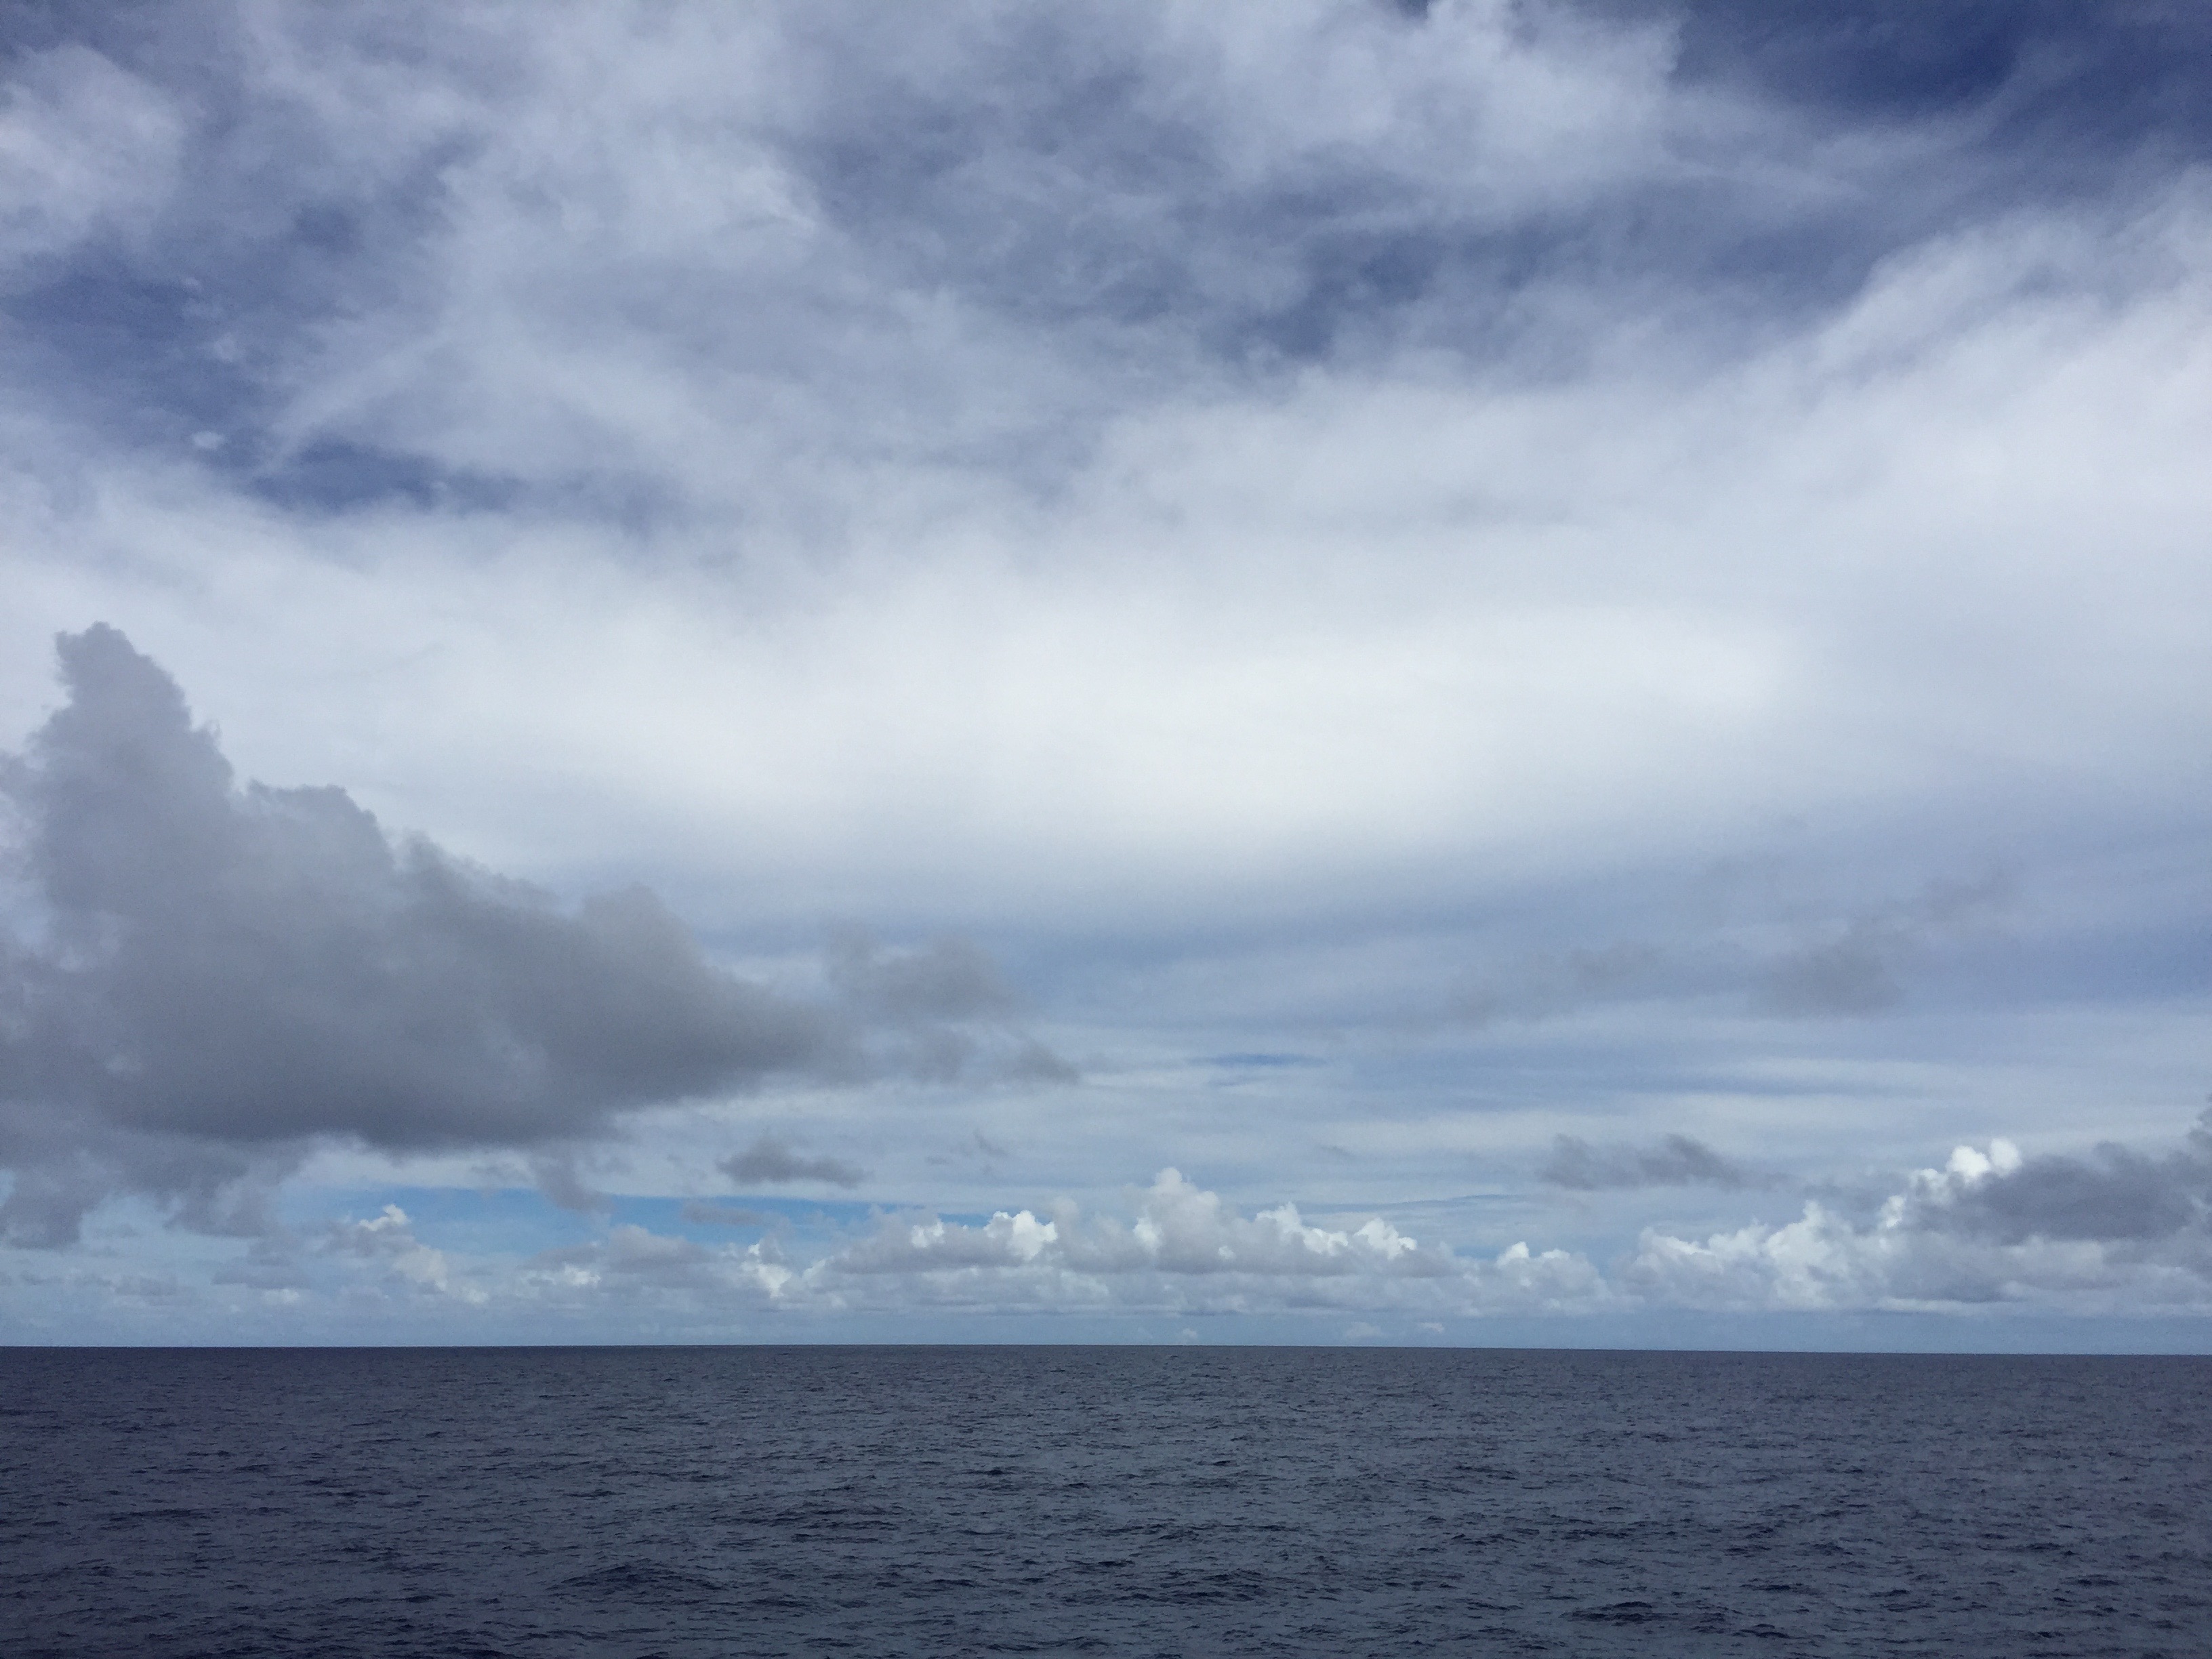
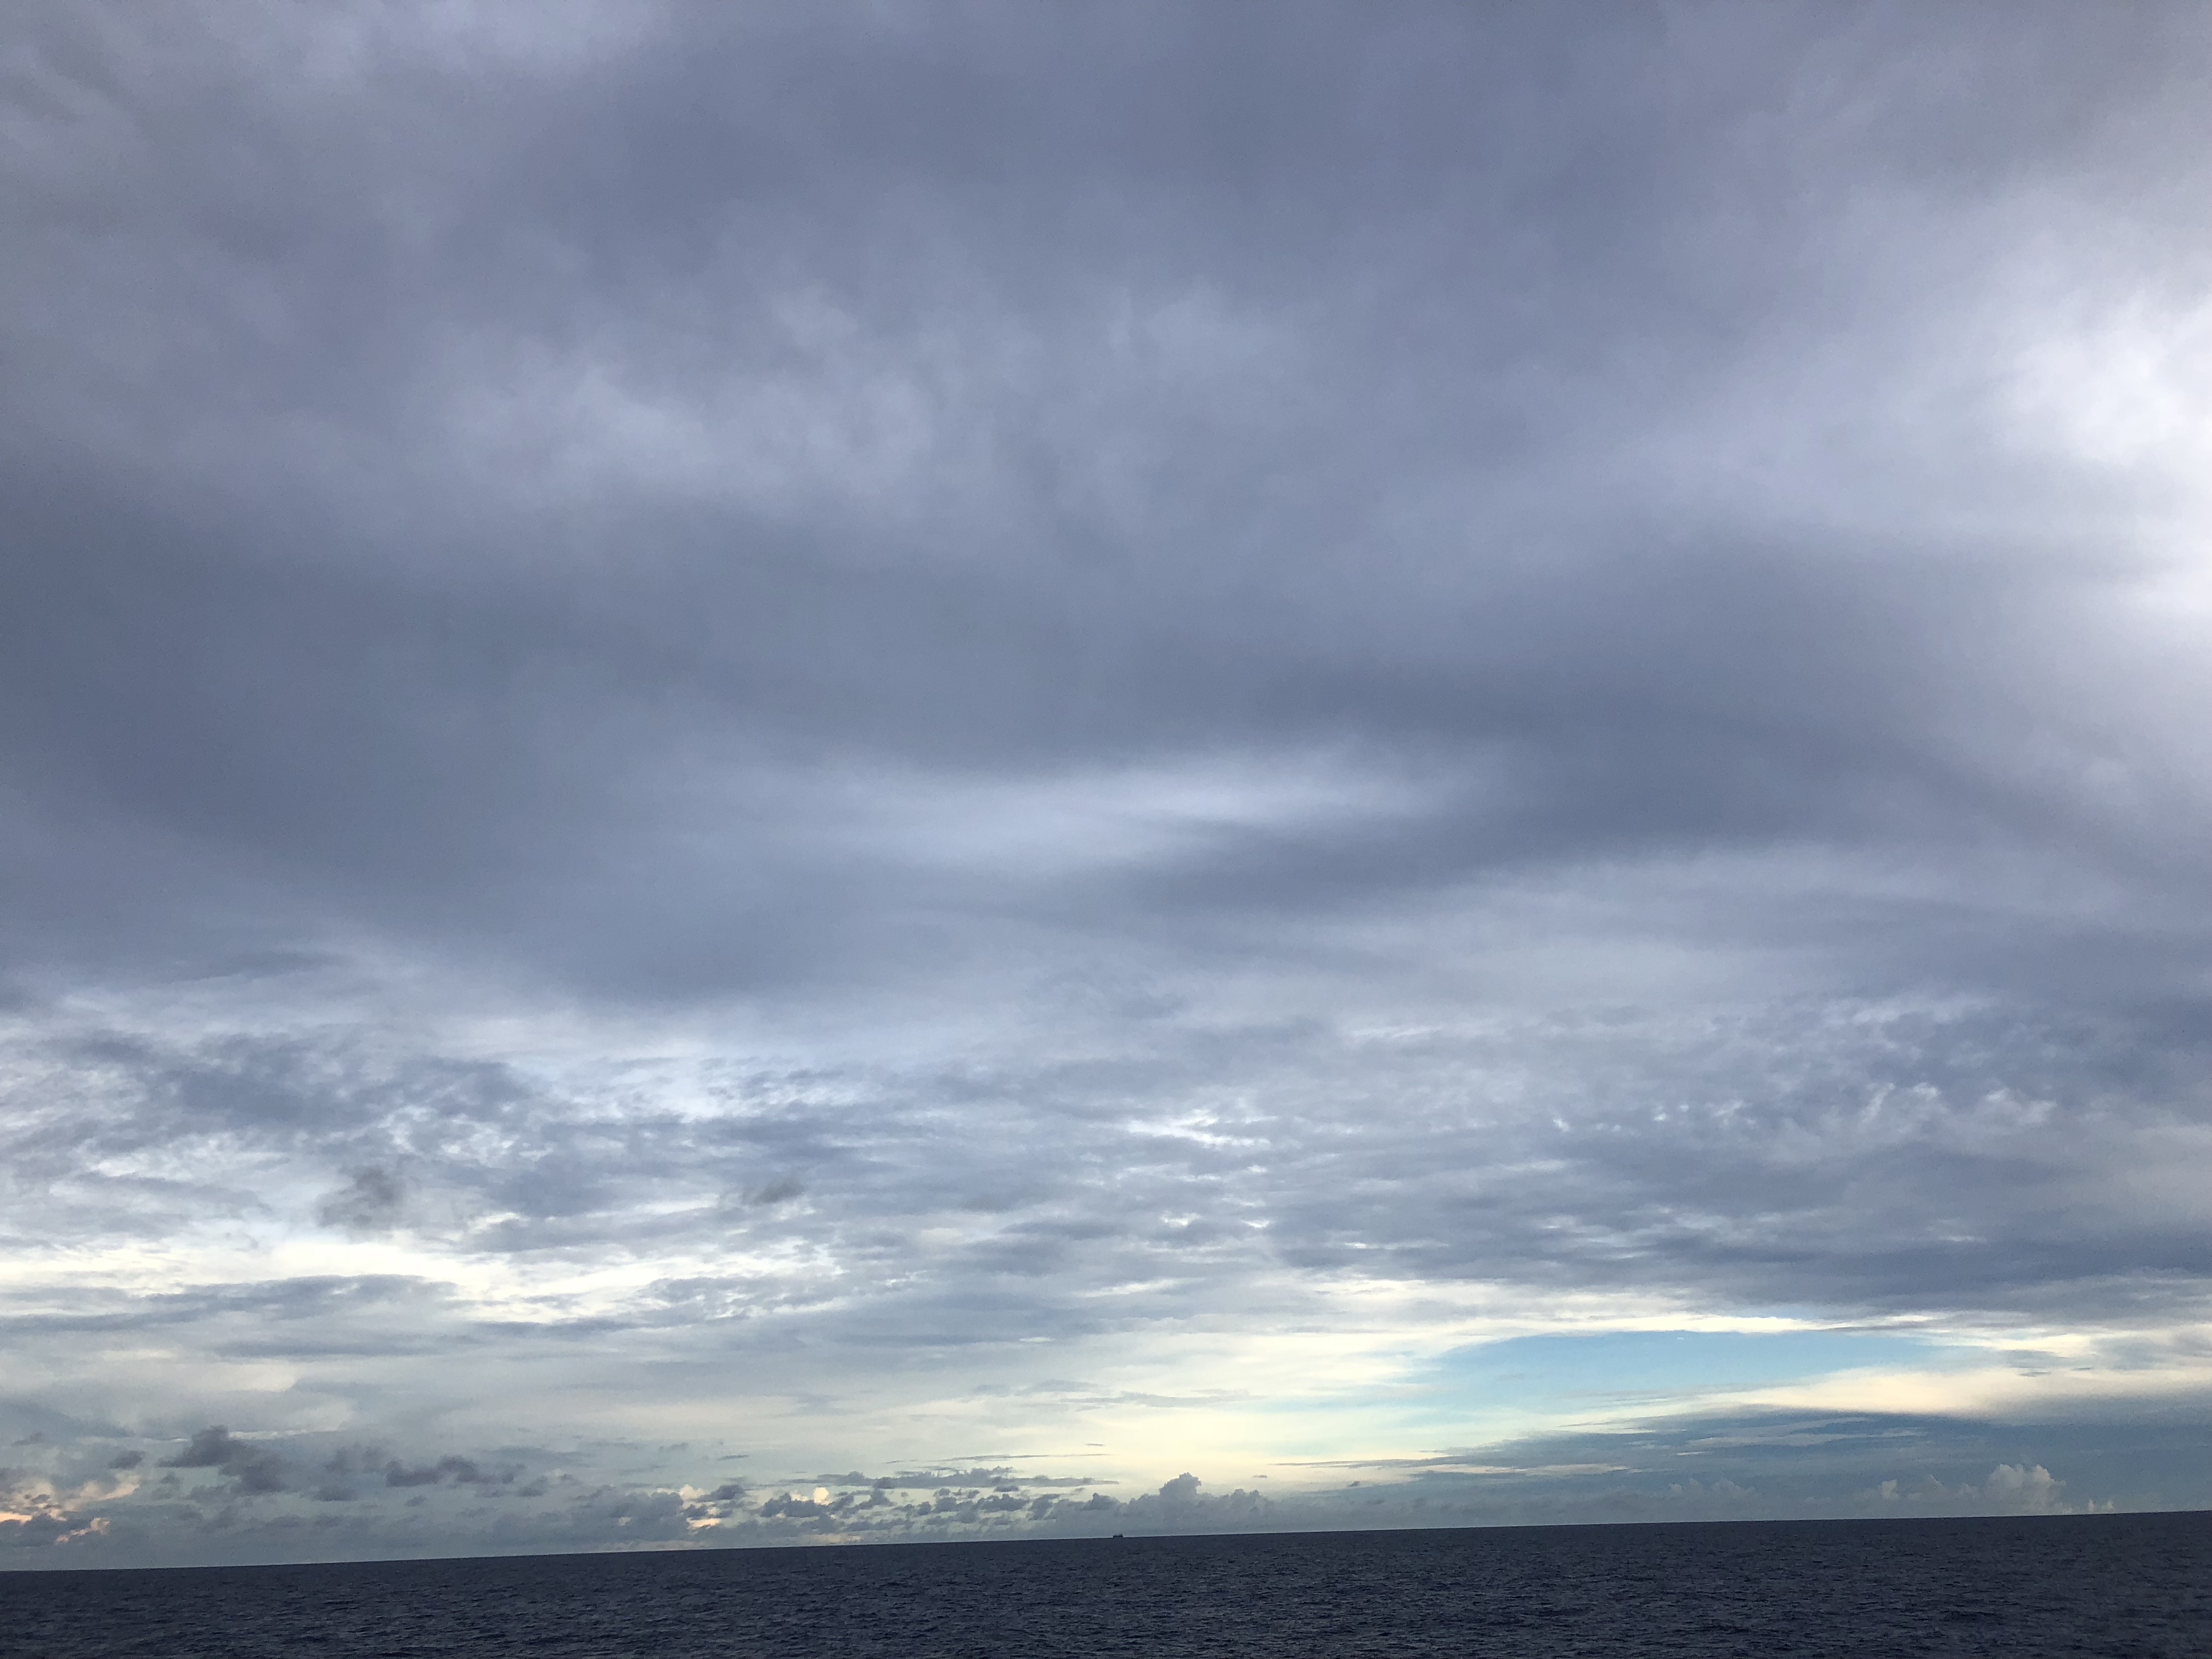
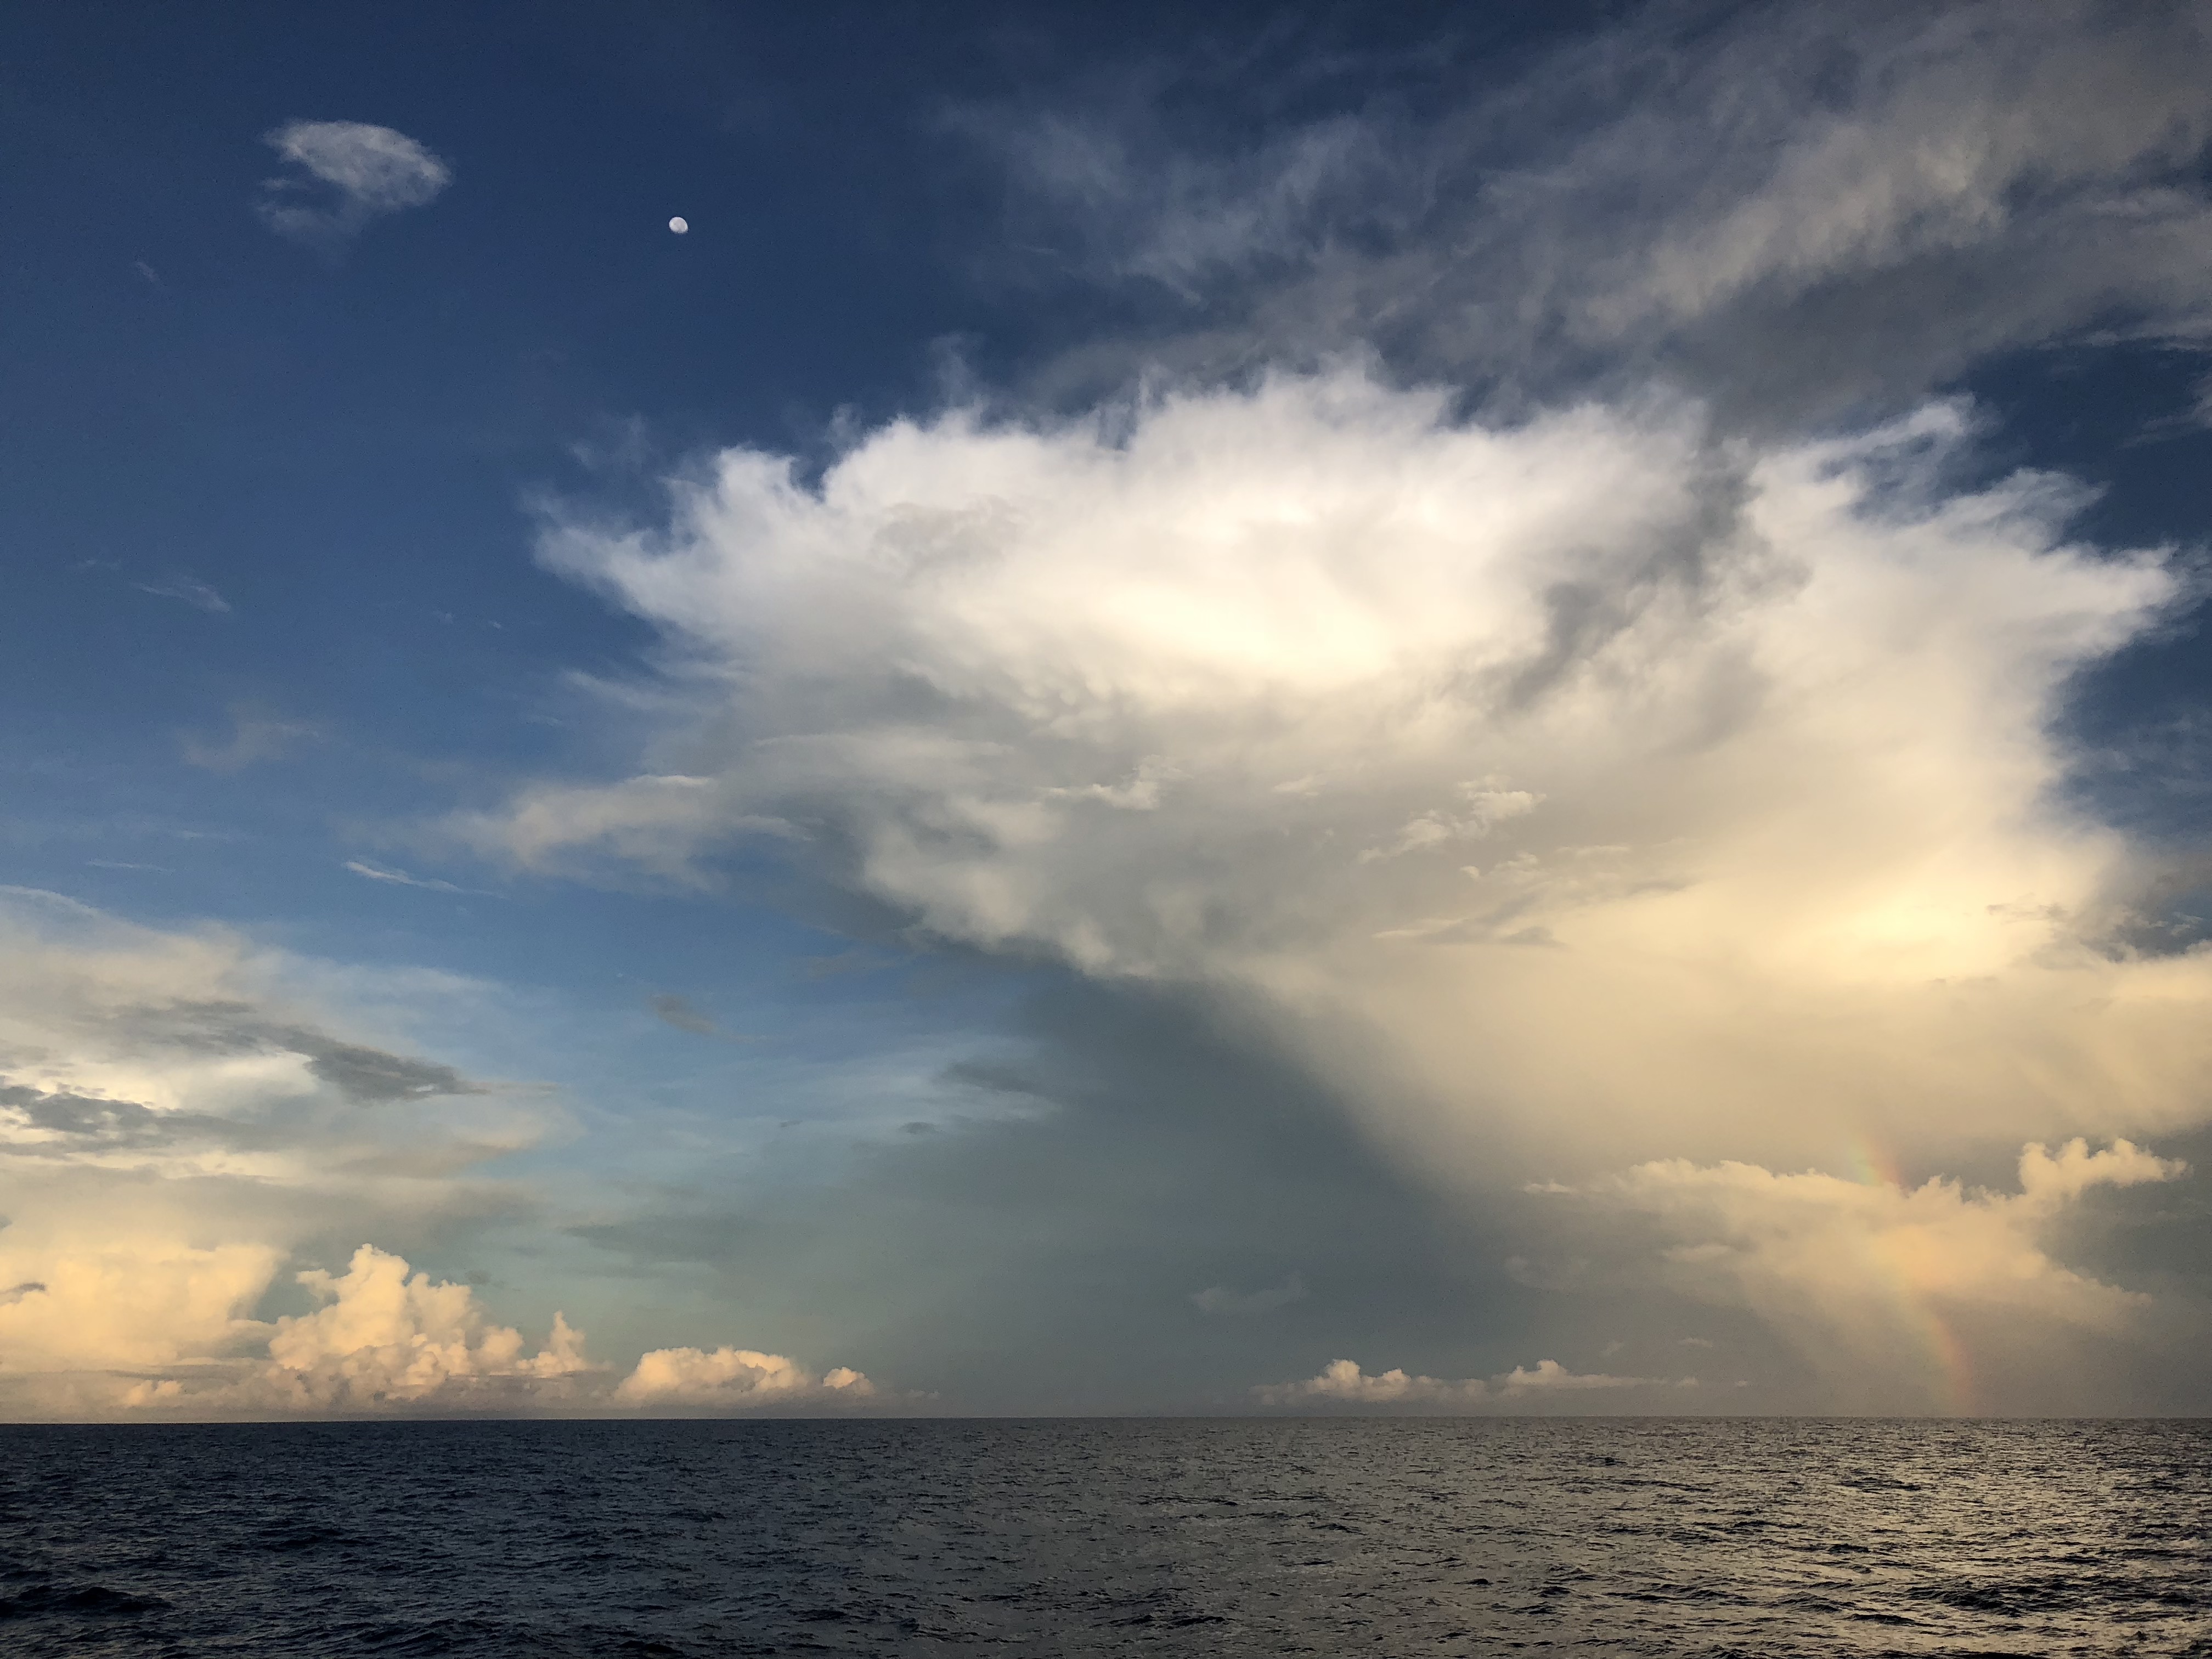
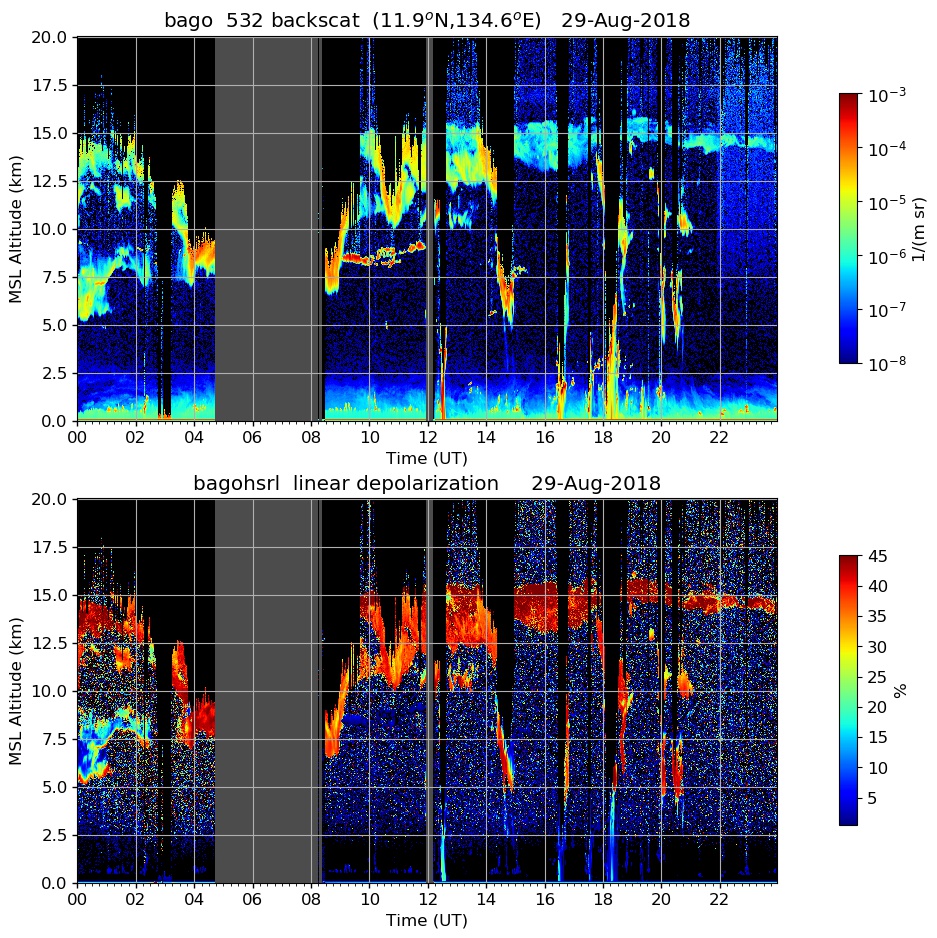
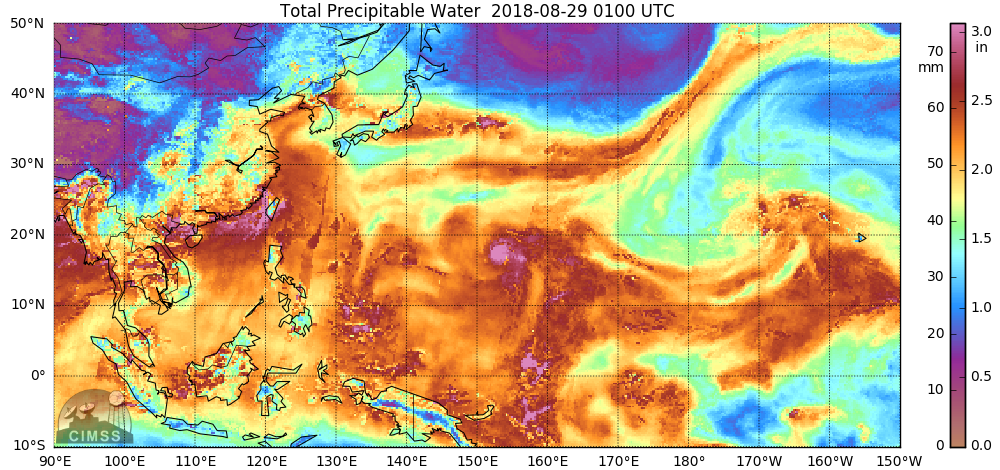
Persistent altostratus, altocumulus, and cirrus clouds was seen during the day and night. This is depicted in the day's cloud photos near sounding launch times (Figure 8) and in HSRL backscatter plots (Figure 9) for the day. Mid-level cloud was present between 5 and 10 km until about 12 UTC, then only a thinning layer of cirrus remained. Reflecting the lack of mid-level cloud in the second half of the day, the 09 UTC sounding was relatively moist in the upper-troposphere, while the 15 UTC sounding included a dry layer between 250 and 400 mb (Figure 2). However, the lower troposphere remained moist throughout 29 August. Satellite derived TPW (Figure 10) at 01 UTC indicated two roughly zonally oriented bands of higher TPW in our vicinity: One extended from near 18N, 140E to 15N, 146E, and the other was about 800 km southward near 10N.
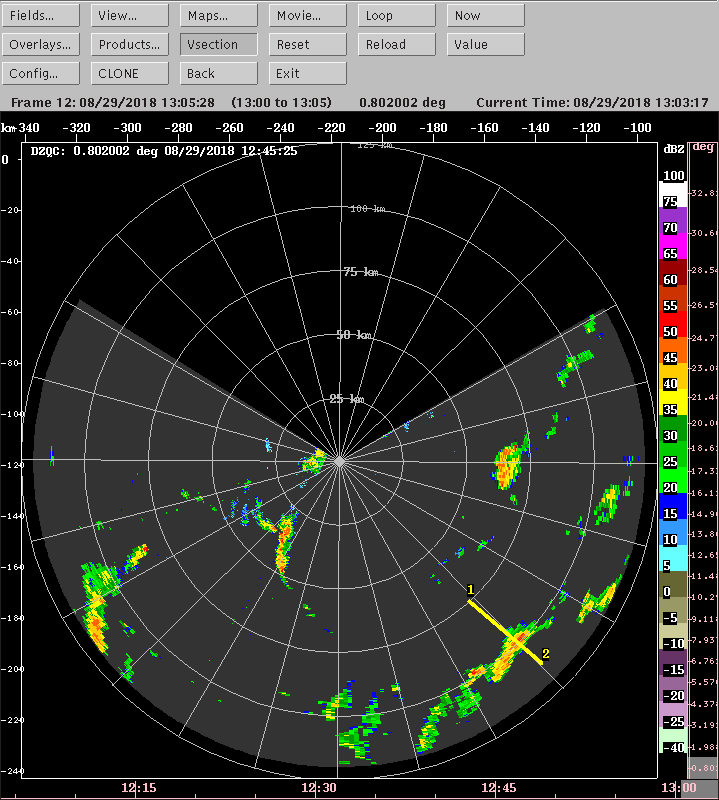
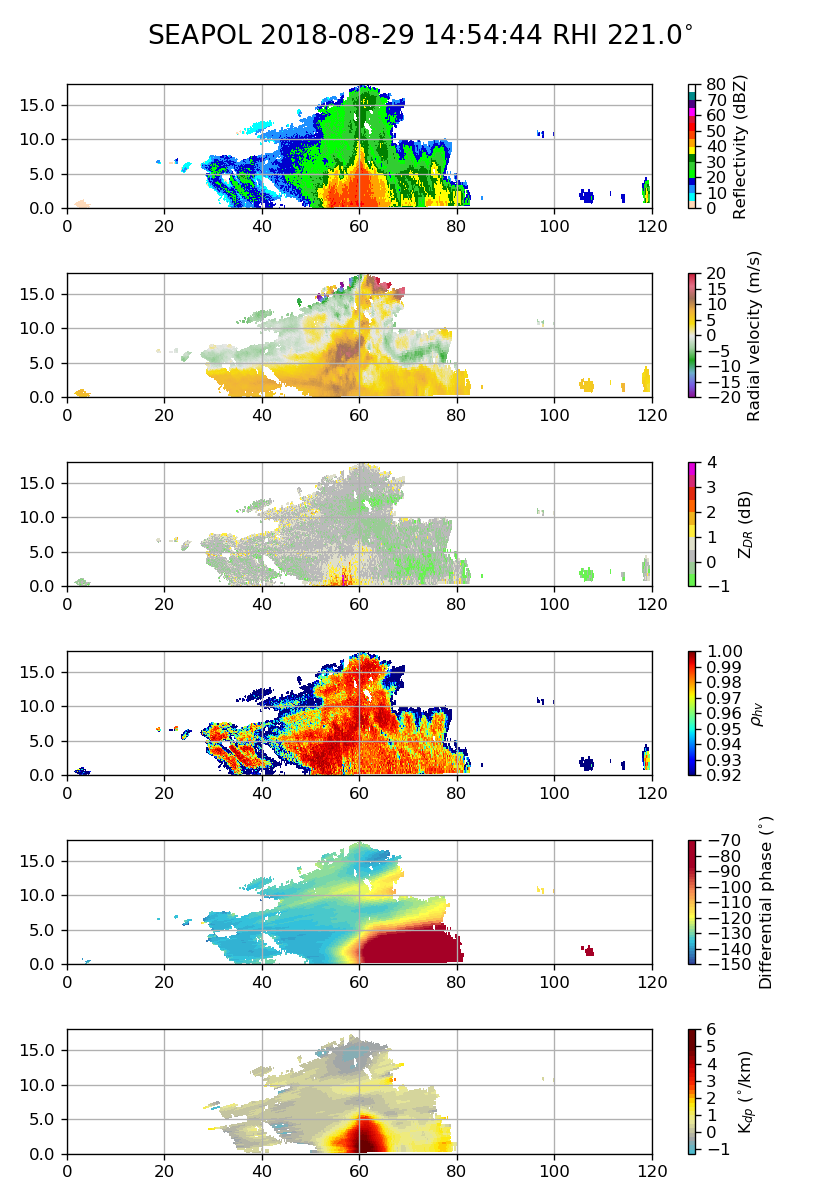
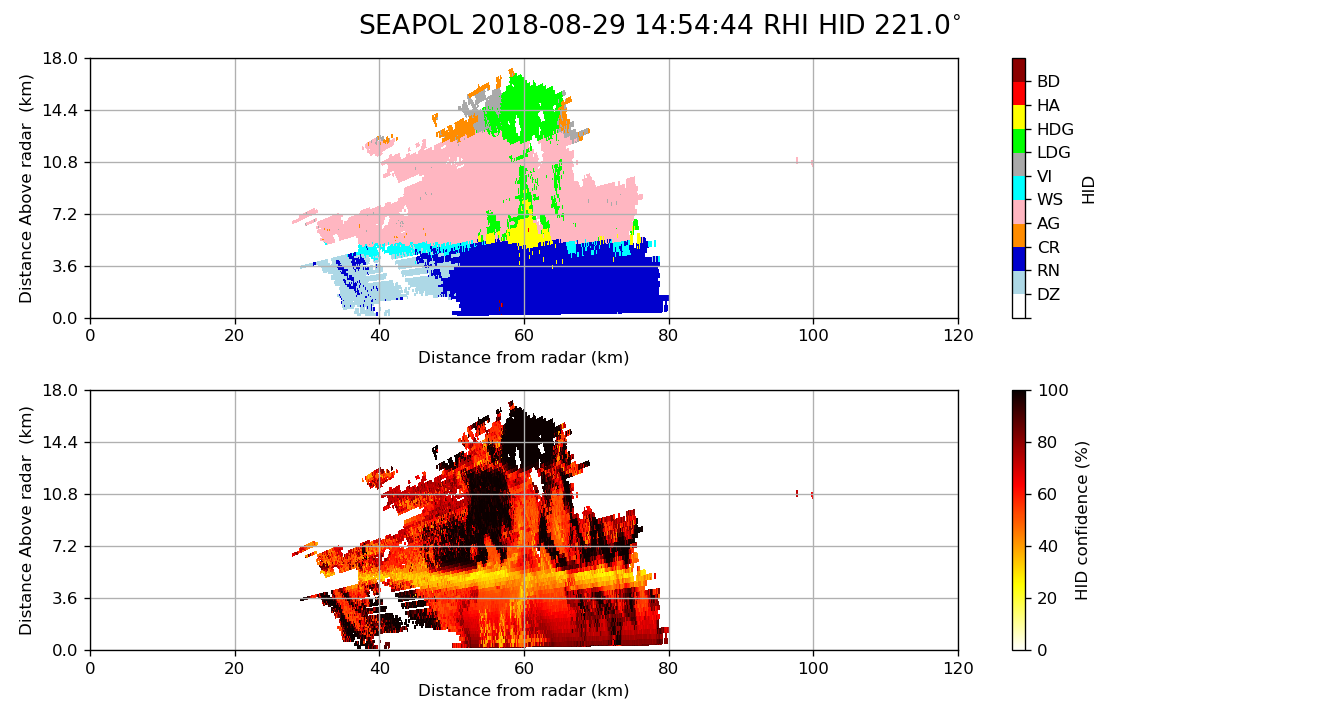
Much of the convection observed between 12 and 15 UTC was obviously sheared, which was consistent with the 14kts of 850-200 mb shear and veering wind profile seen in the 15 UTC sounding. Some examples of the sheared convection are illustrated by Figure 11 and Figure 12. Some convection extending up to 17 km was also observed to the southwest of the radar around 15 UTC. A cross-section of this convection at its greatest intensity are shown in Figure 13. A deep region of velocities away from the radar are seen near 60 km range and are co-located with a region of high correlation coefficient. A few reflectivities of 35 dBZ are seen near 15 km. While the plume of high reflectivity was noted right at 60 km range, the highest ZDR was located a little closer to the radar and was located closer to beneath the area of strongest velocities. The hydrometeor ID algorithm indicated low density graupel as high as echo top near 60 km range (Figure 14).
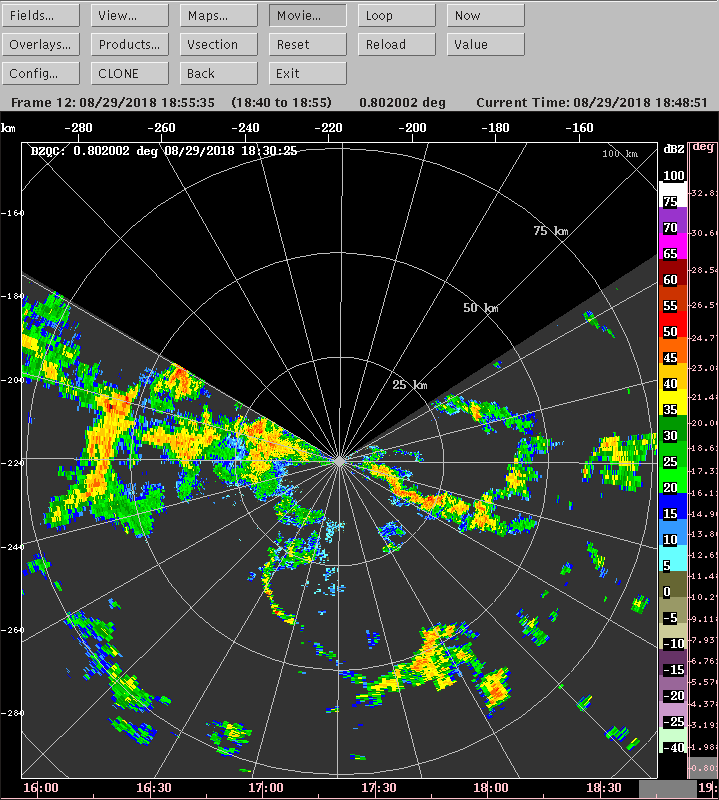
Figure 15 shows a nice example of a cold pool outlined by precipitation echo. At 1830 UTC, the feature was located about 25-40 km from the radar at an azimuth between 195 and 210 deg. The cold pool did not appear in the prior volume scan. Unfortunately, the ship turned around soon after the feature was detected.
A GPM overpass occurred to the northeast of the radar at 1859 UTC; however, the radar was blind to the northeast at the time.