August 30, 2018
Isolated Convection and the Beginning of Local Convergence over the Ship
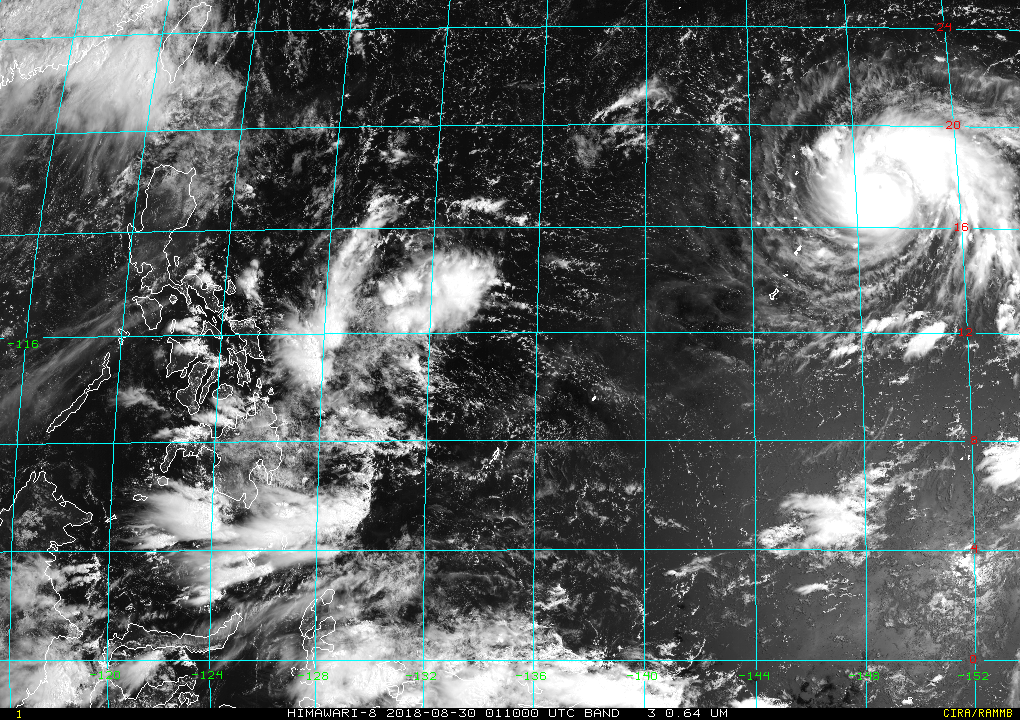
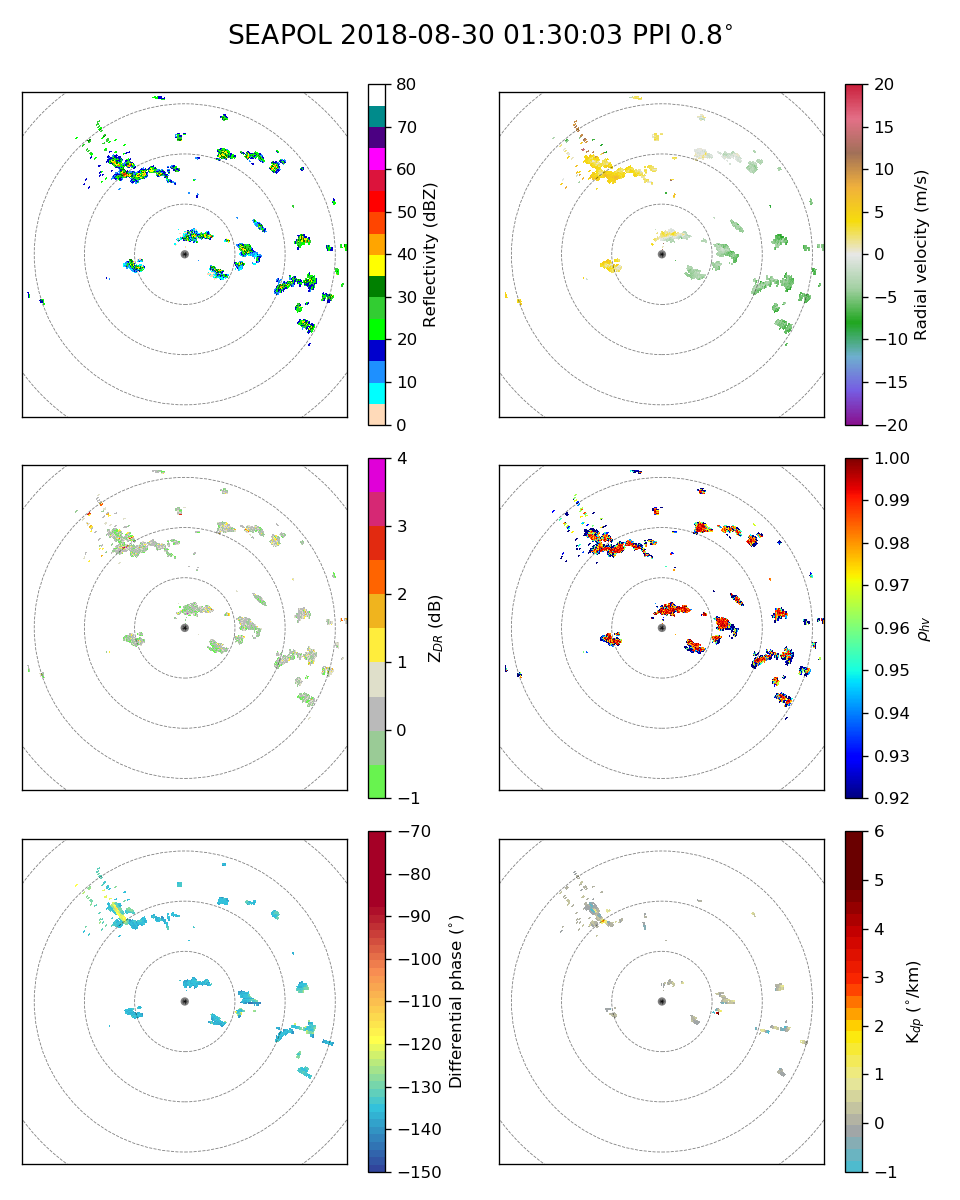
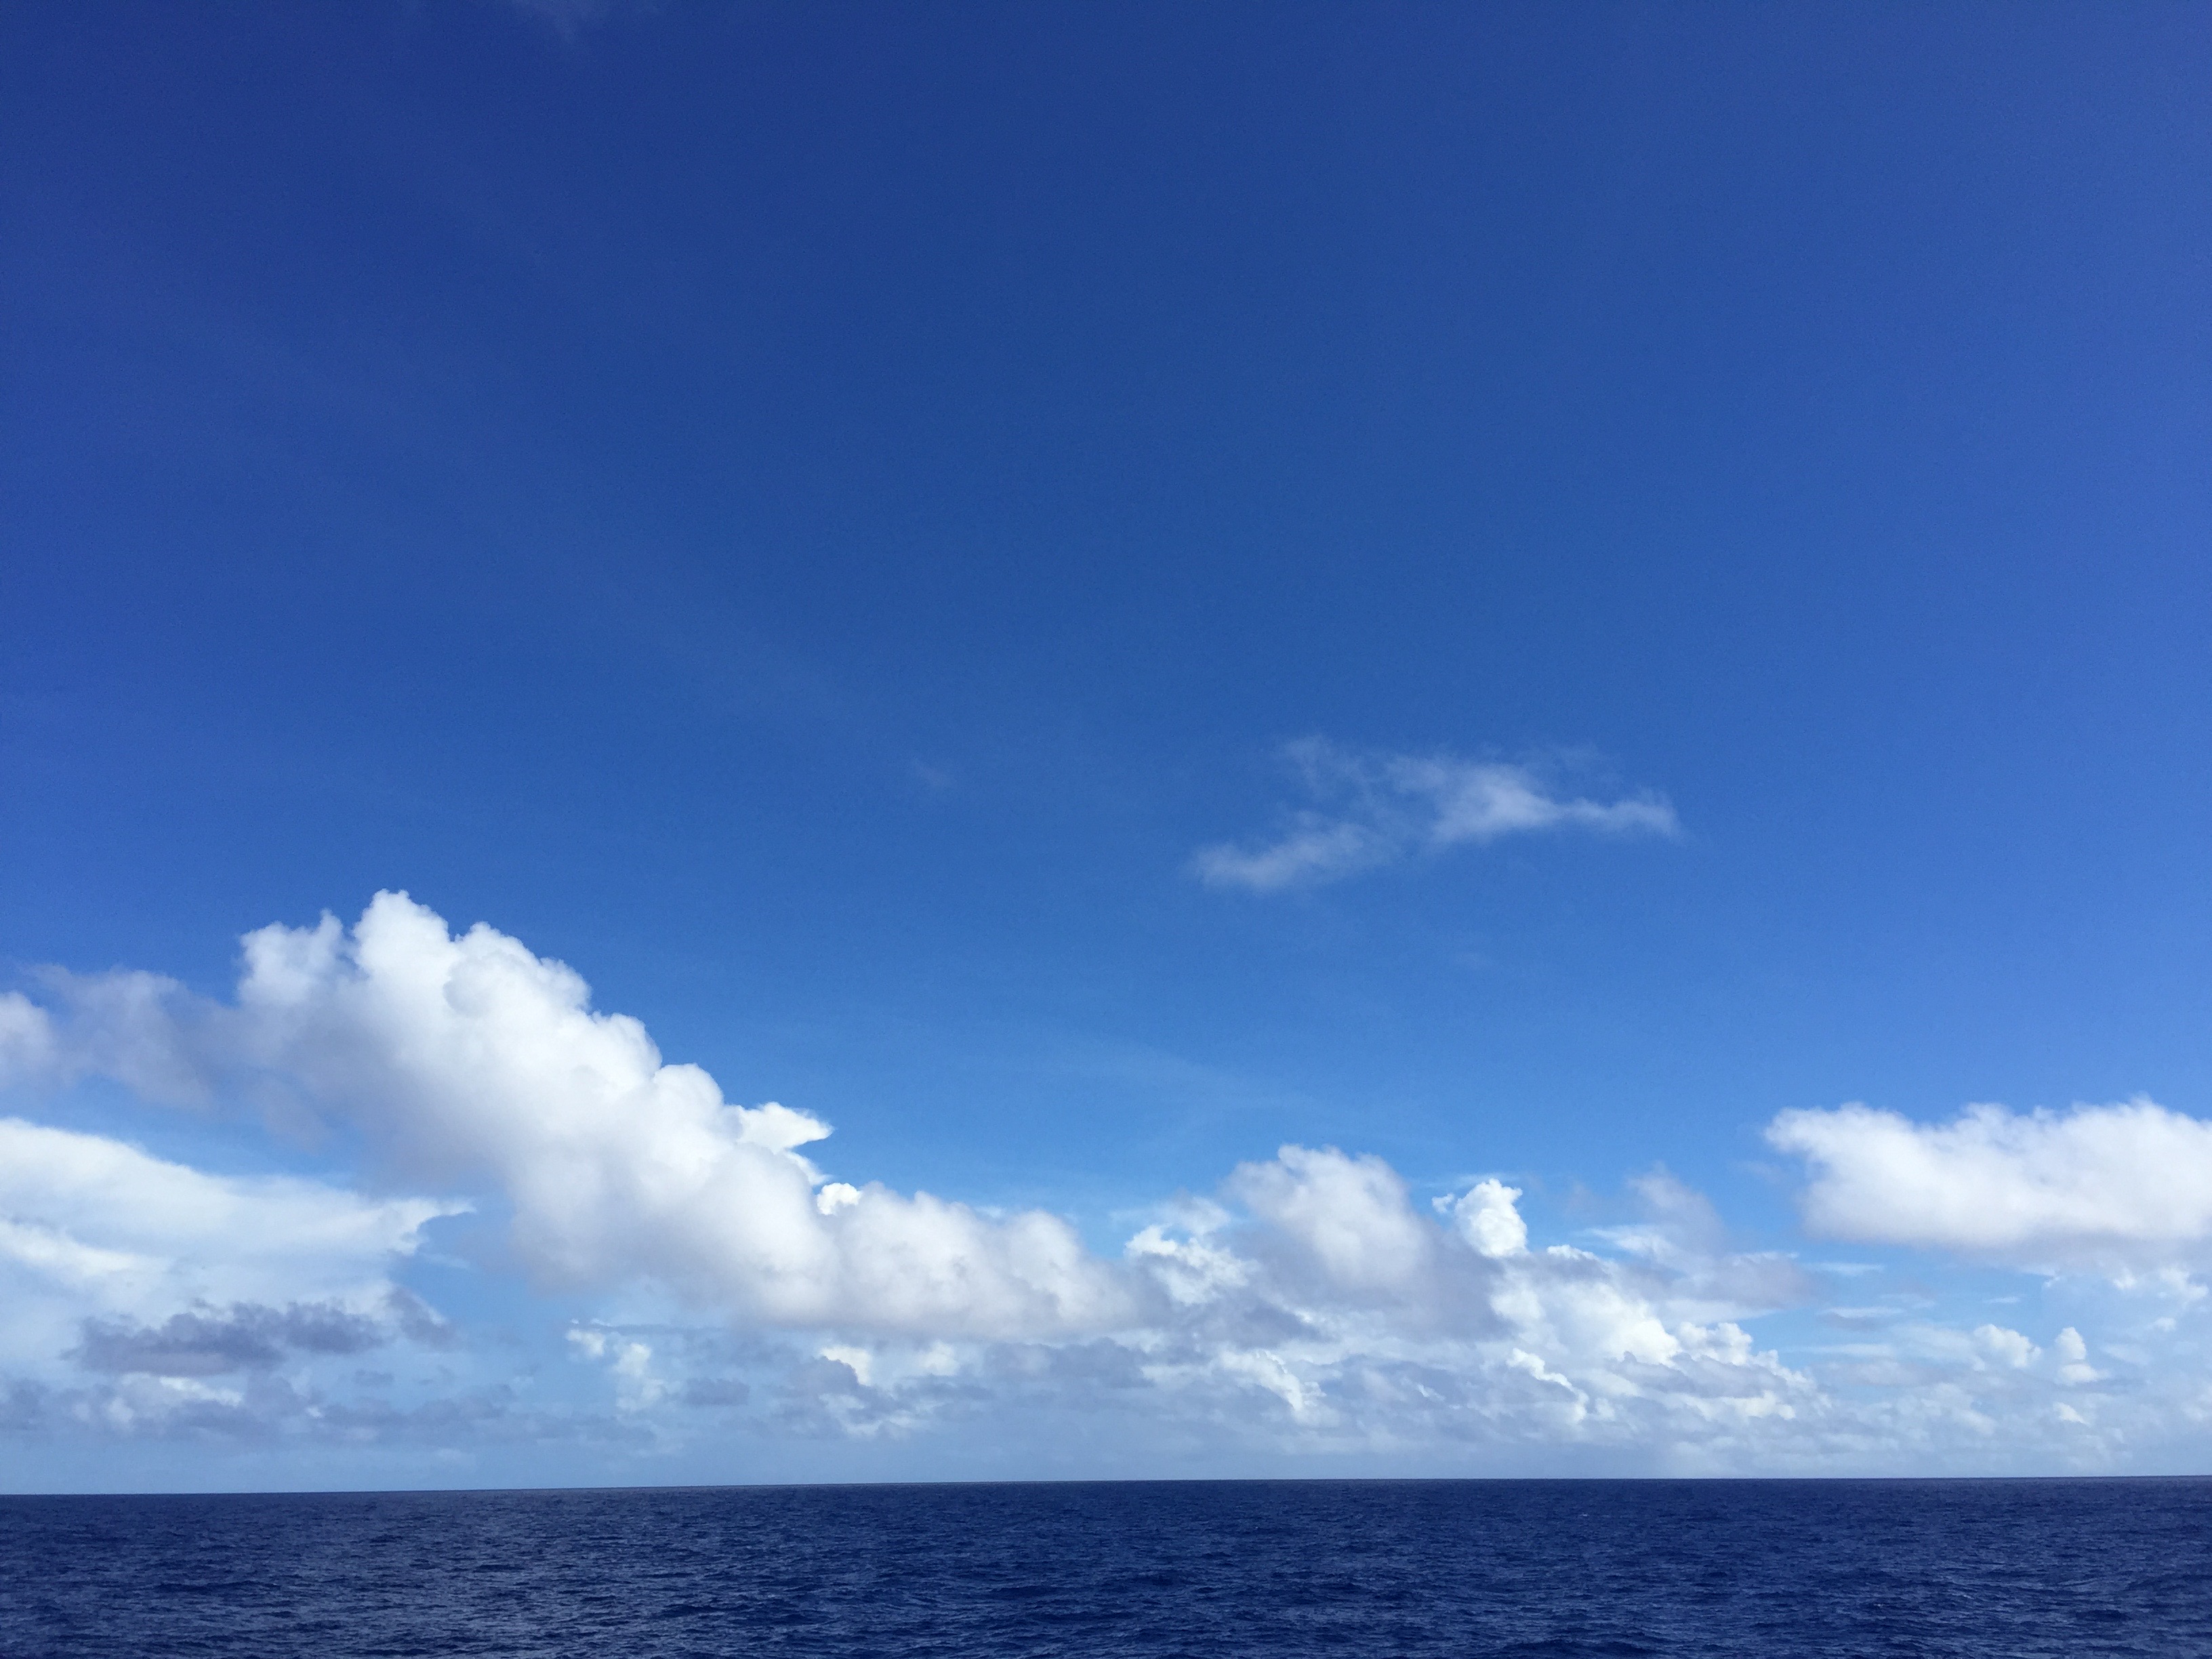
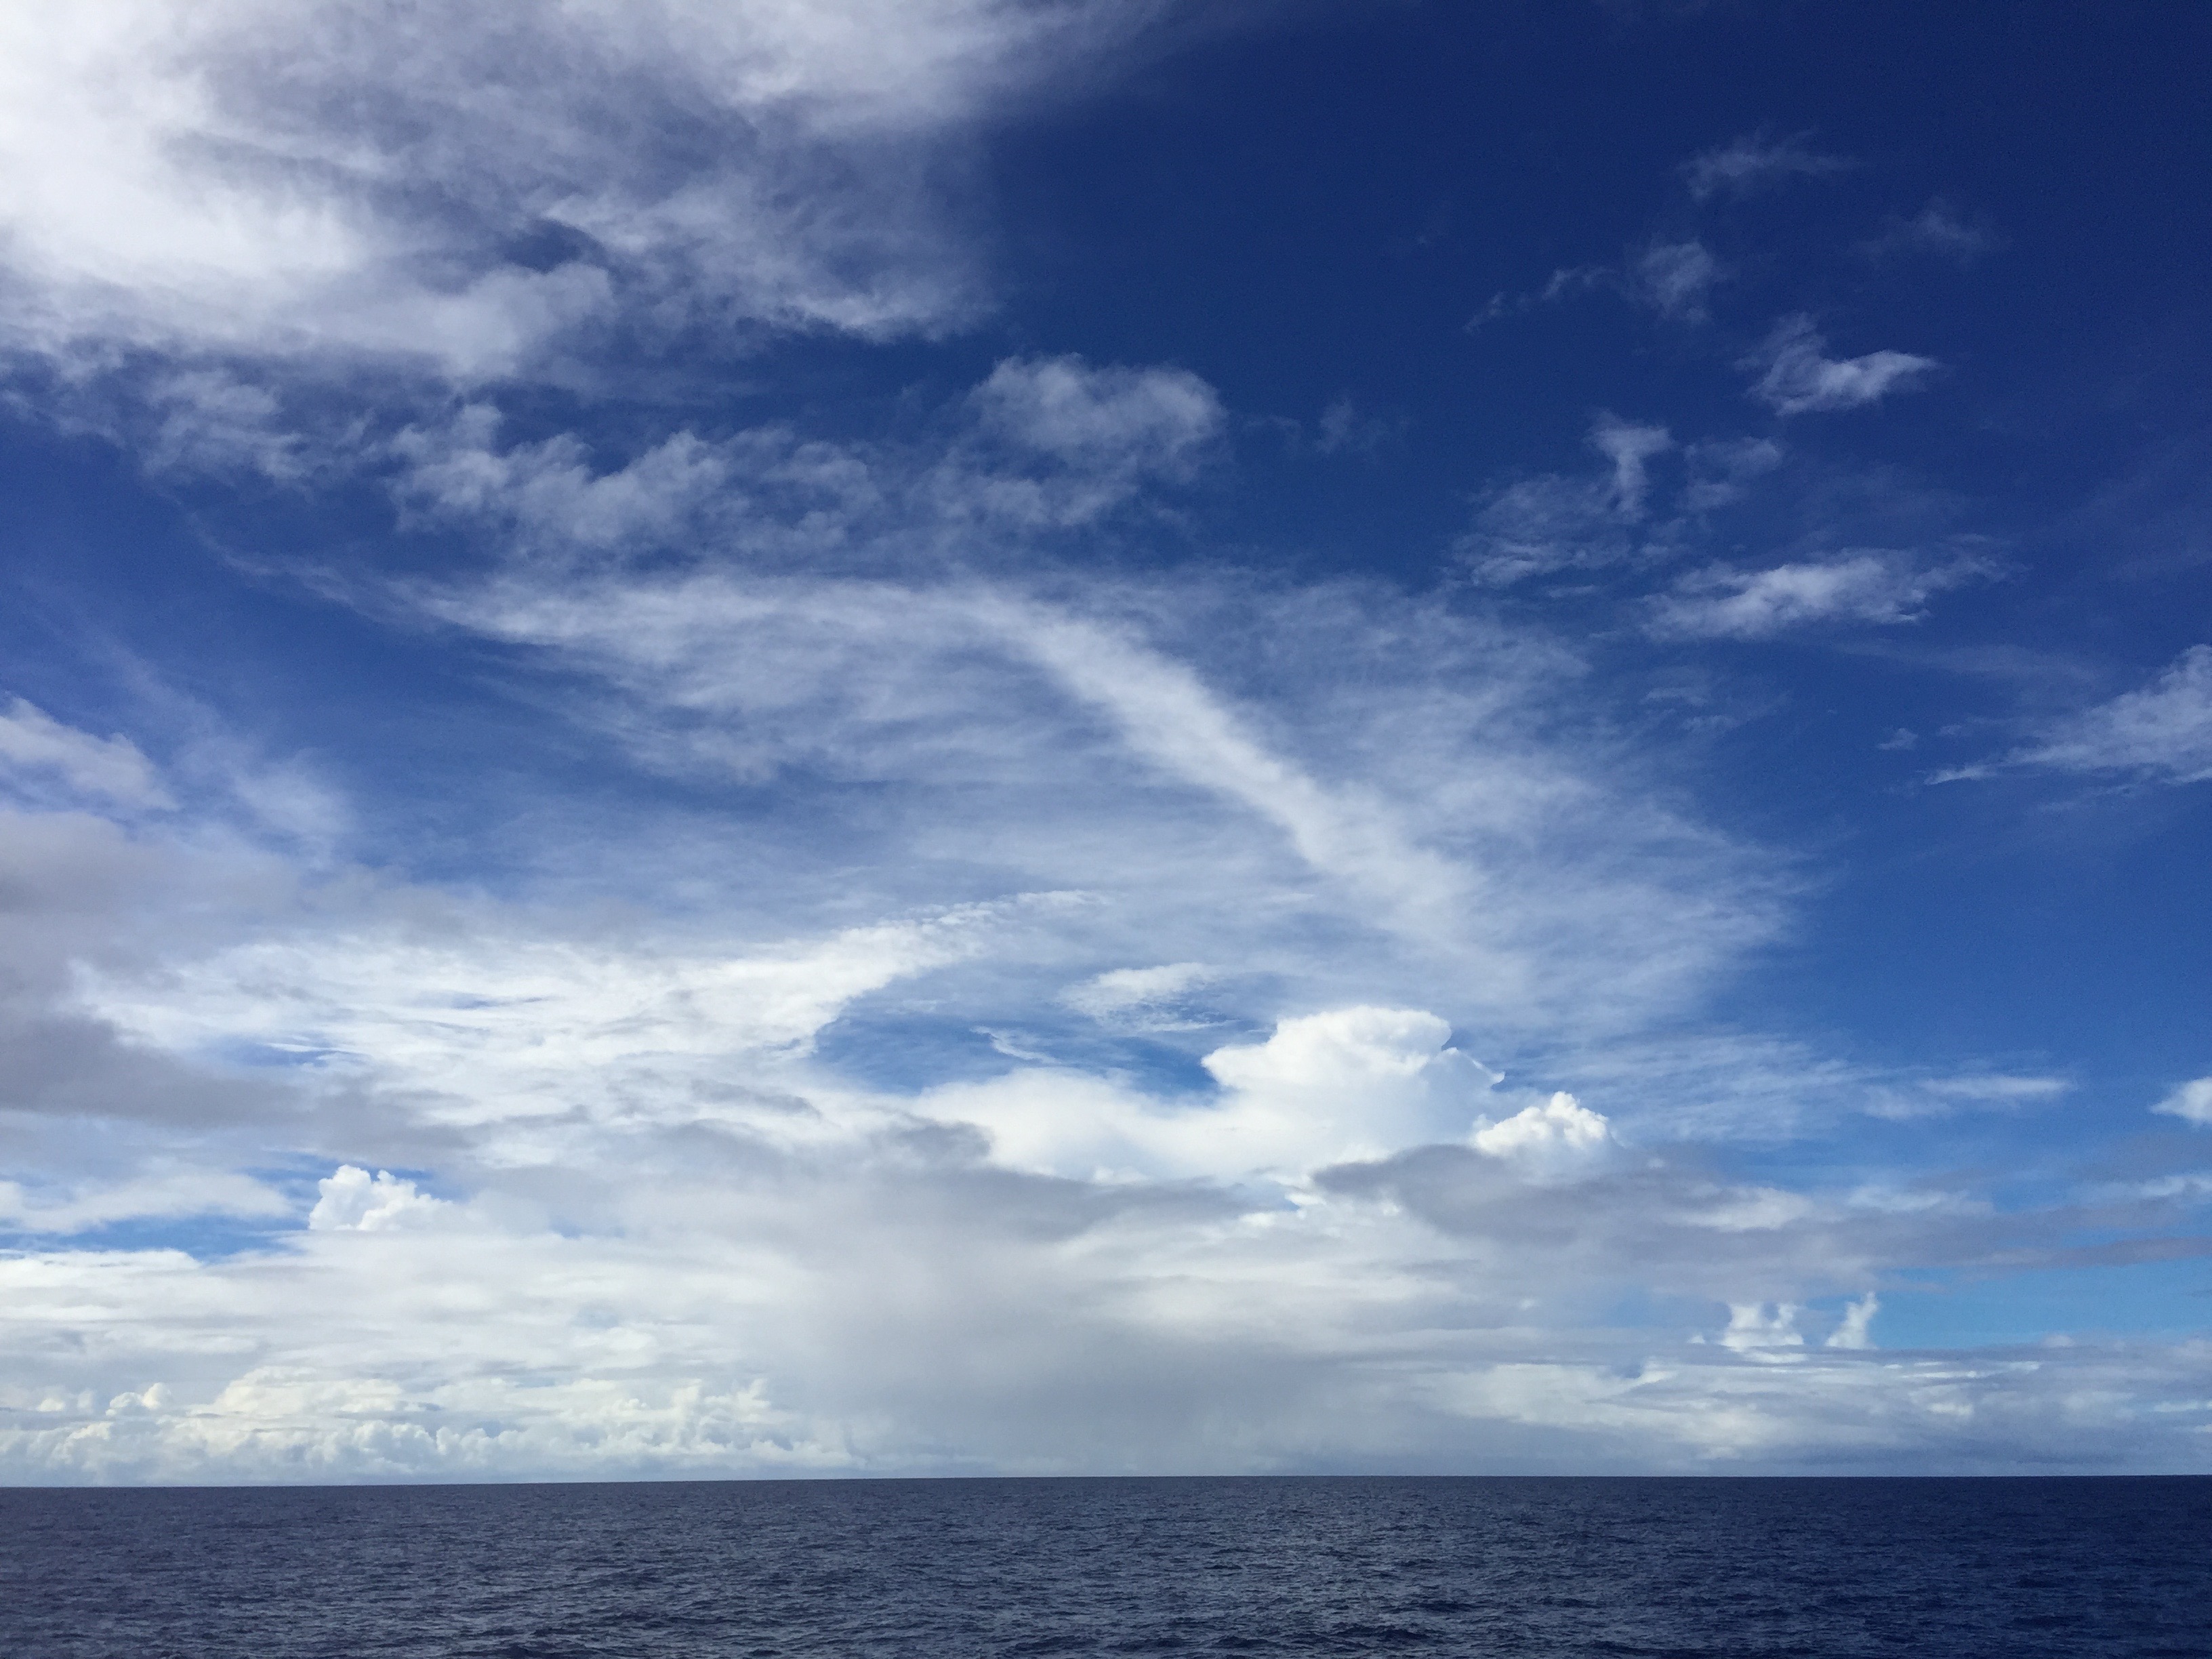
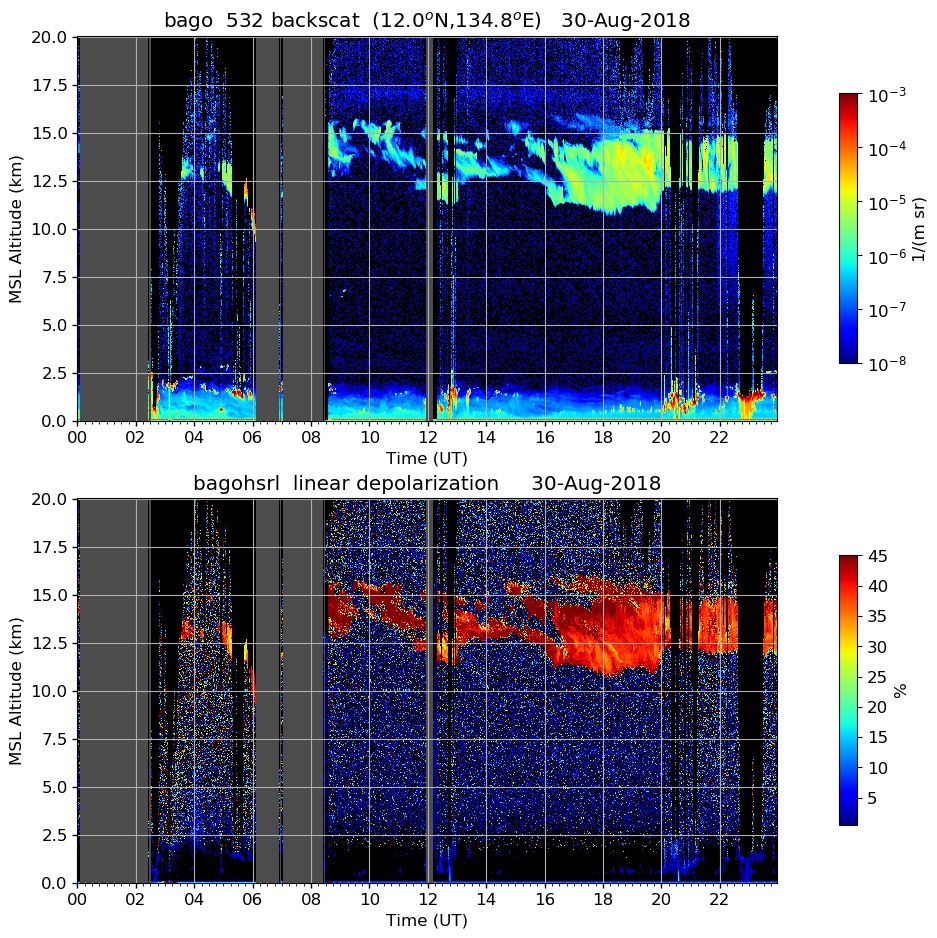
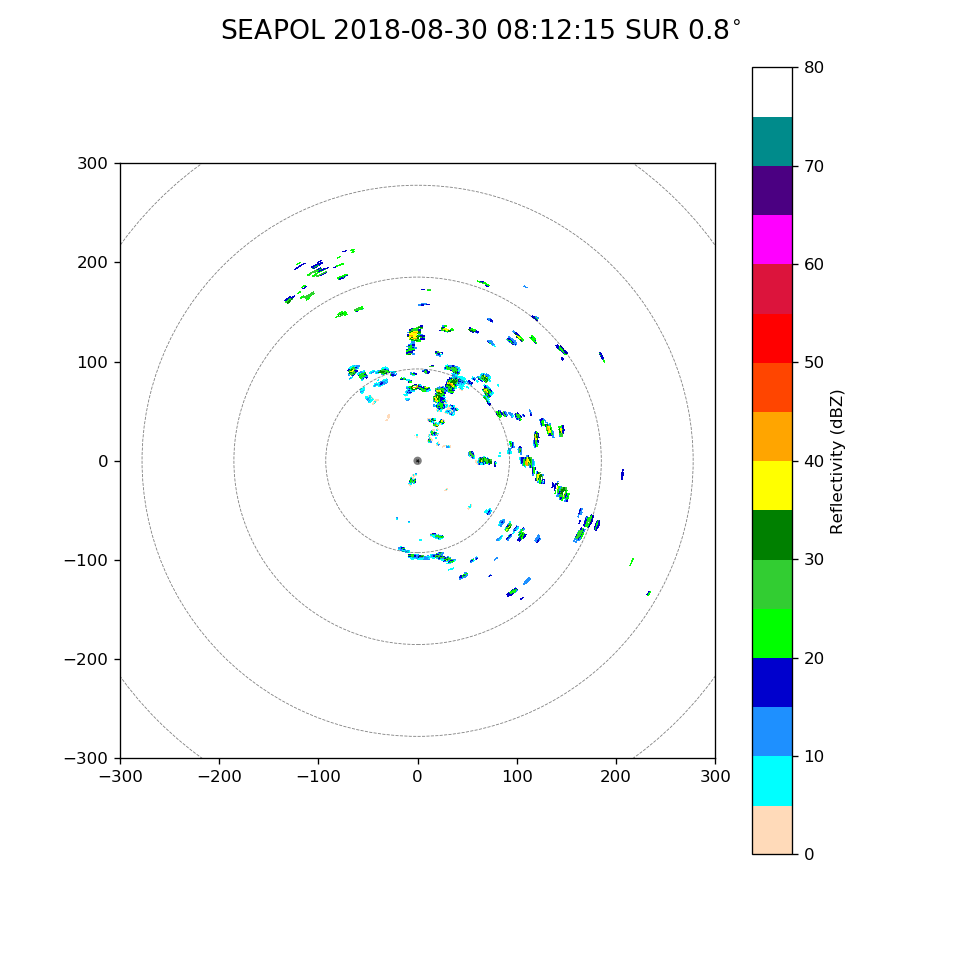
Scott Powell, Adam Sobel, Timothy Lang, Eric MaloneyIsolated convective elements continued to move through the SEAPOL domain to begin August 30. Visible satellite imagery in the morning (Figure 1) shows the ship (near 12N, 134.75E today) to the east of deep convection that had affected the ship two days prior. Zonally oriented boundary layer clouds were present over the ship. A low-angle sweep from 0130 UTC is seen in Figure 2 and depicts the typical areal coverage of precipitation throughout the morning. At the time, SEAPOL was blind toward the south. Most of the cells were 5 to 10 km deep, but a few cells reached up to around 15 km. Cloud photos for the day at 00, 03, 06, 09, and 21 UTC (Figure 3; read from left to right as in the top row is 00 and 03 UTC) also show several shallow clouds with the occasional towering cell, all topped by cirrus level cloud. The 09 UTC photo in particular contains a great example of a narrow, sheared cumulus tower. (The ship's location is UTC+09.) The high cloud was effectively seen by the HSRL, was present between 10 and 15 km throughout the day, and became thicker after 16 UTC (Figure 4).
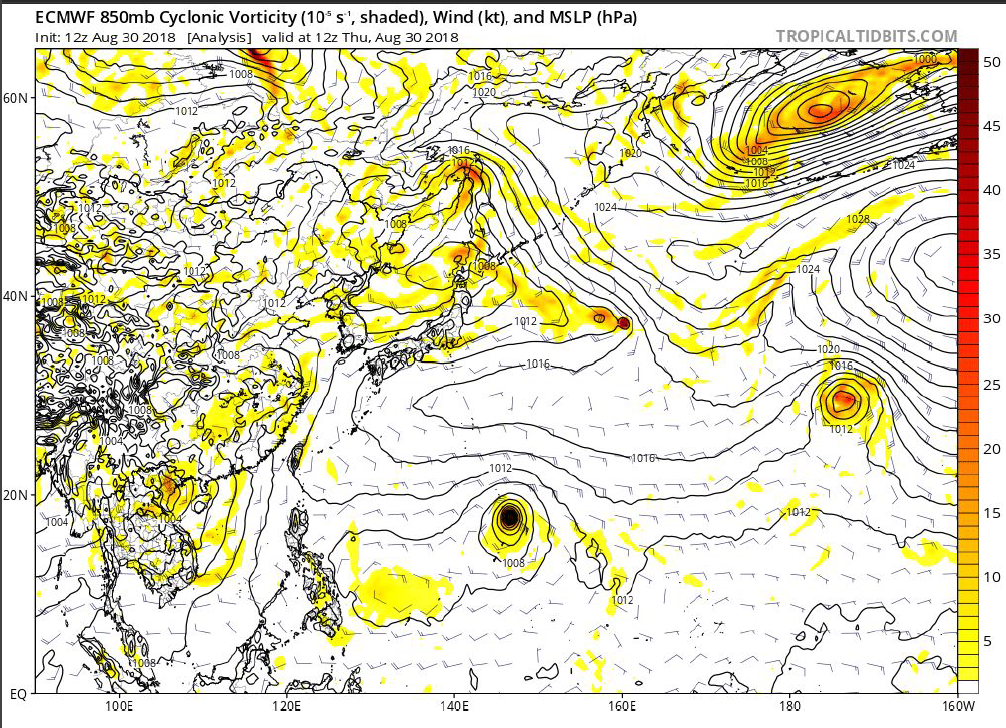
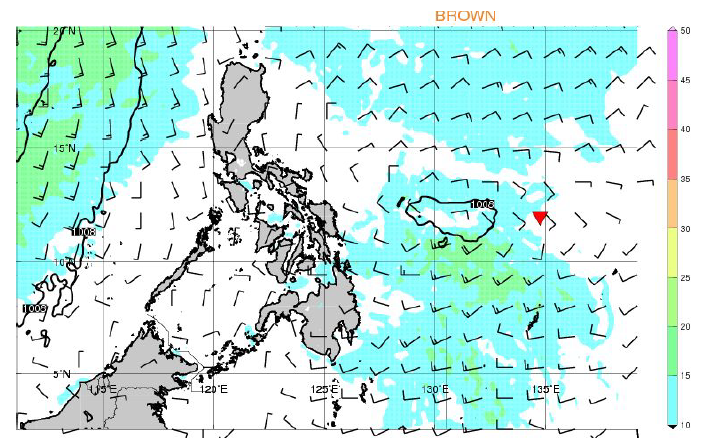
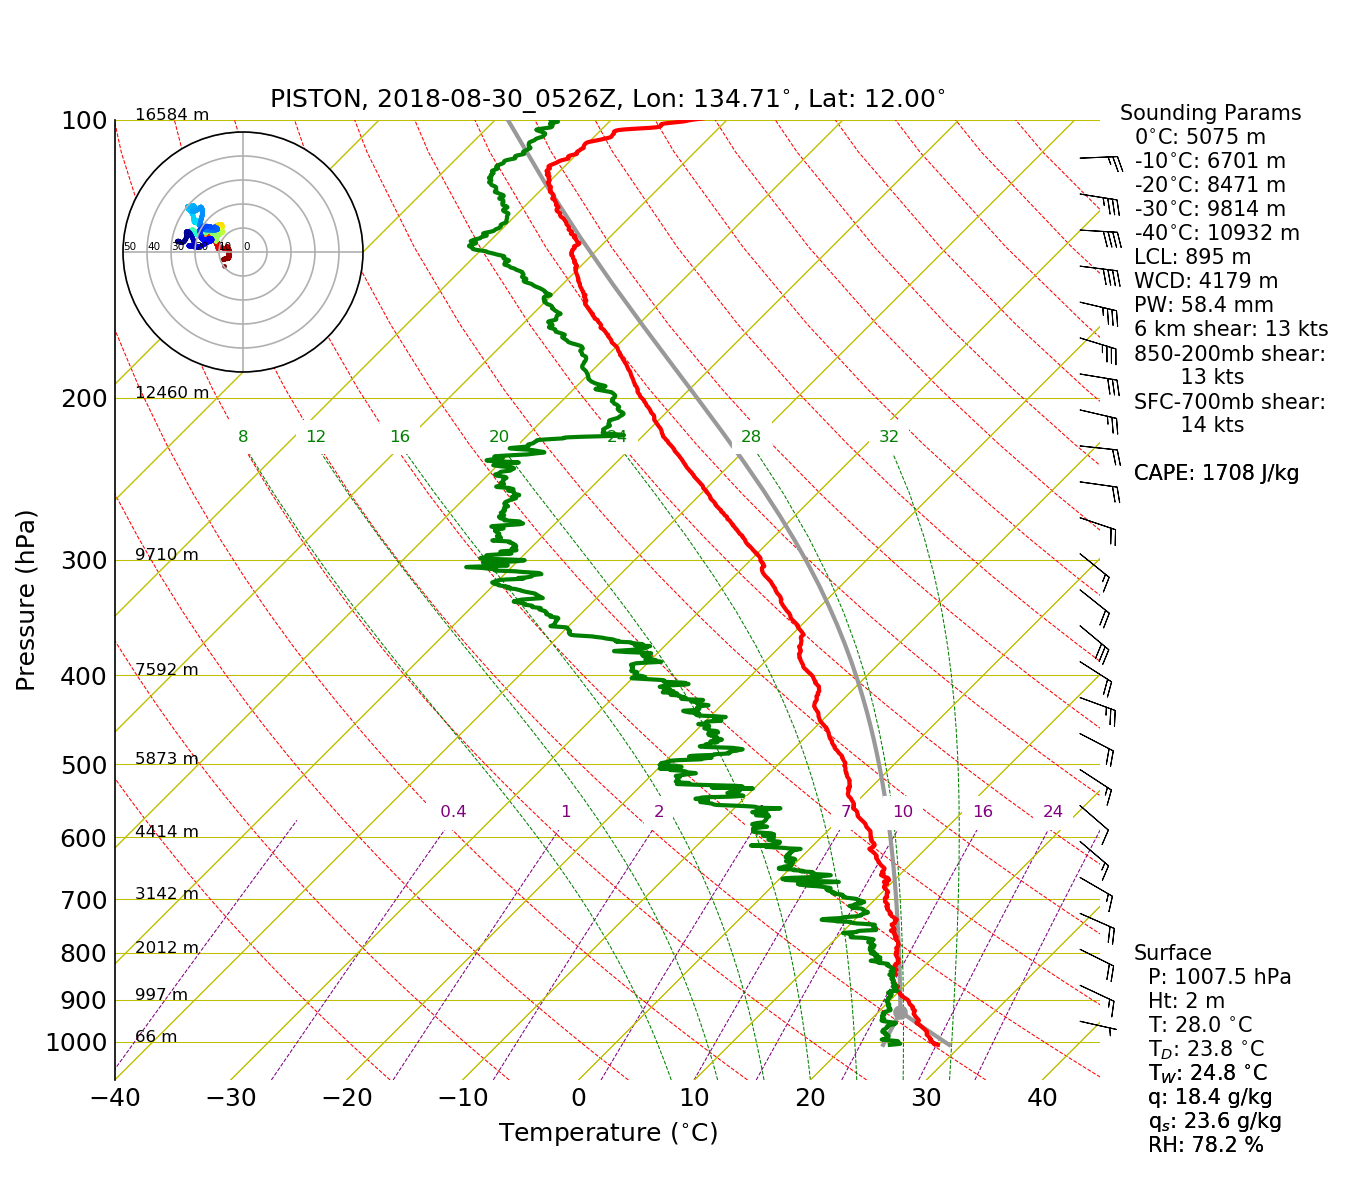
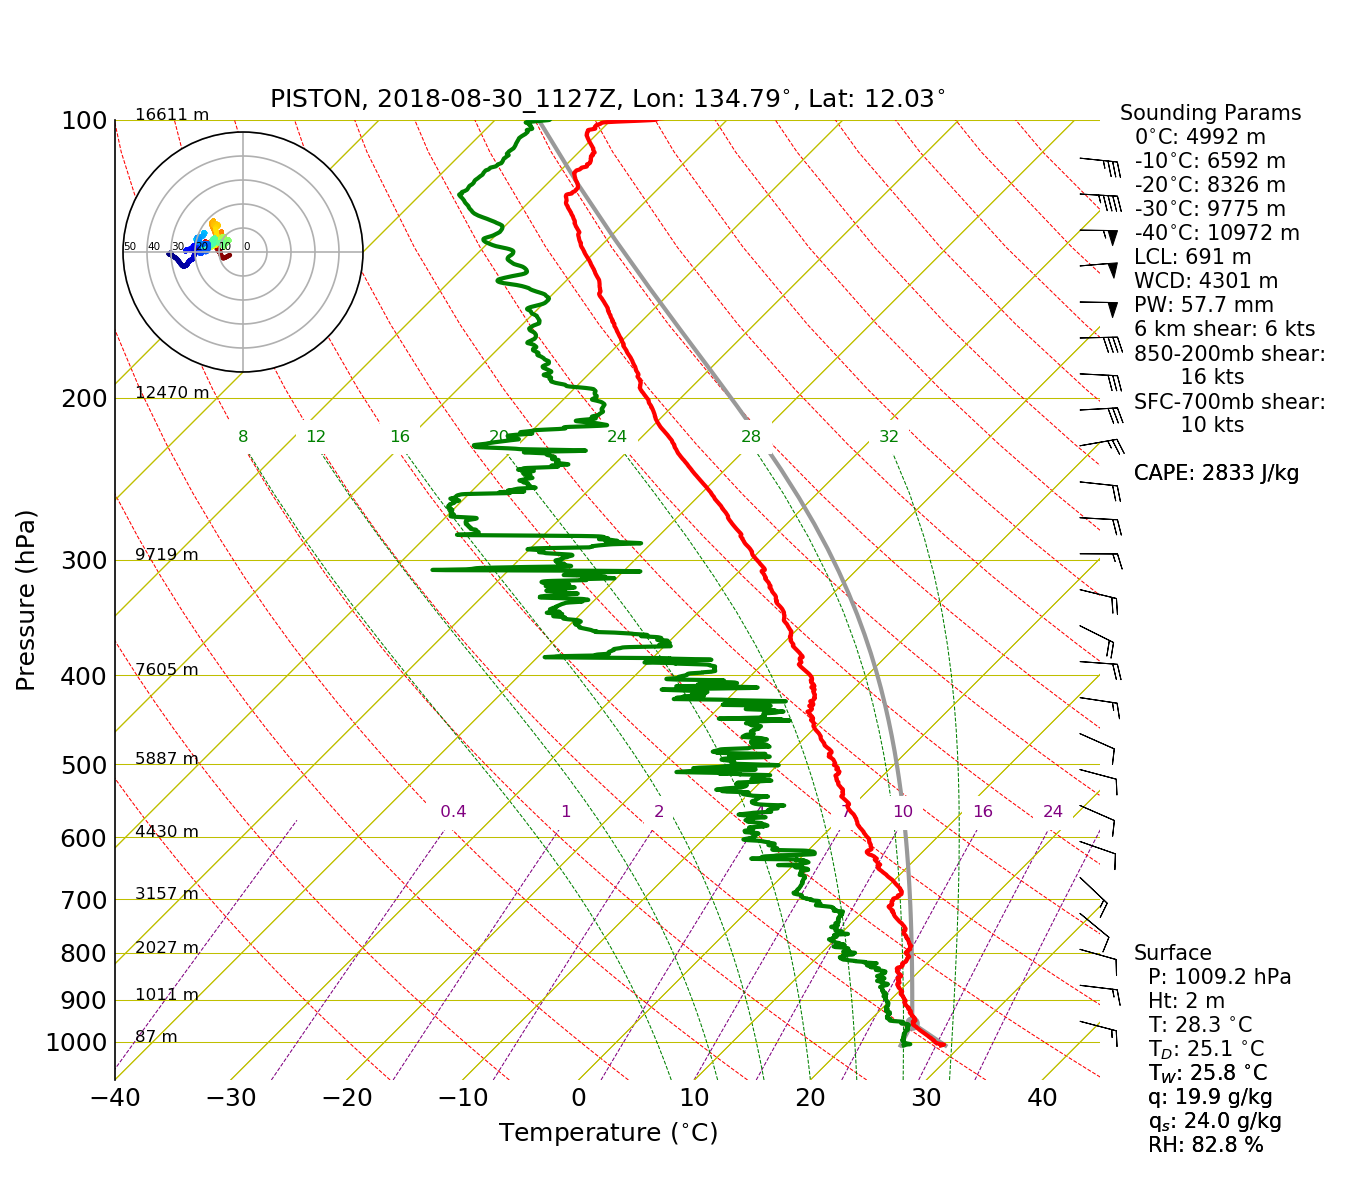
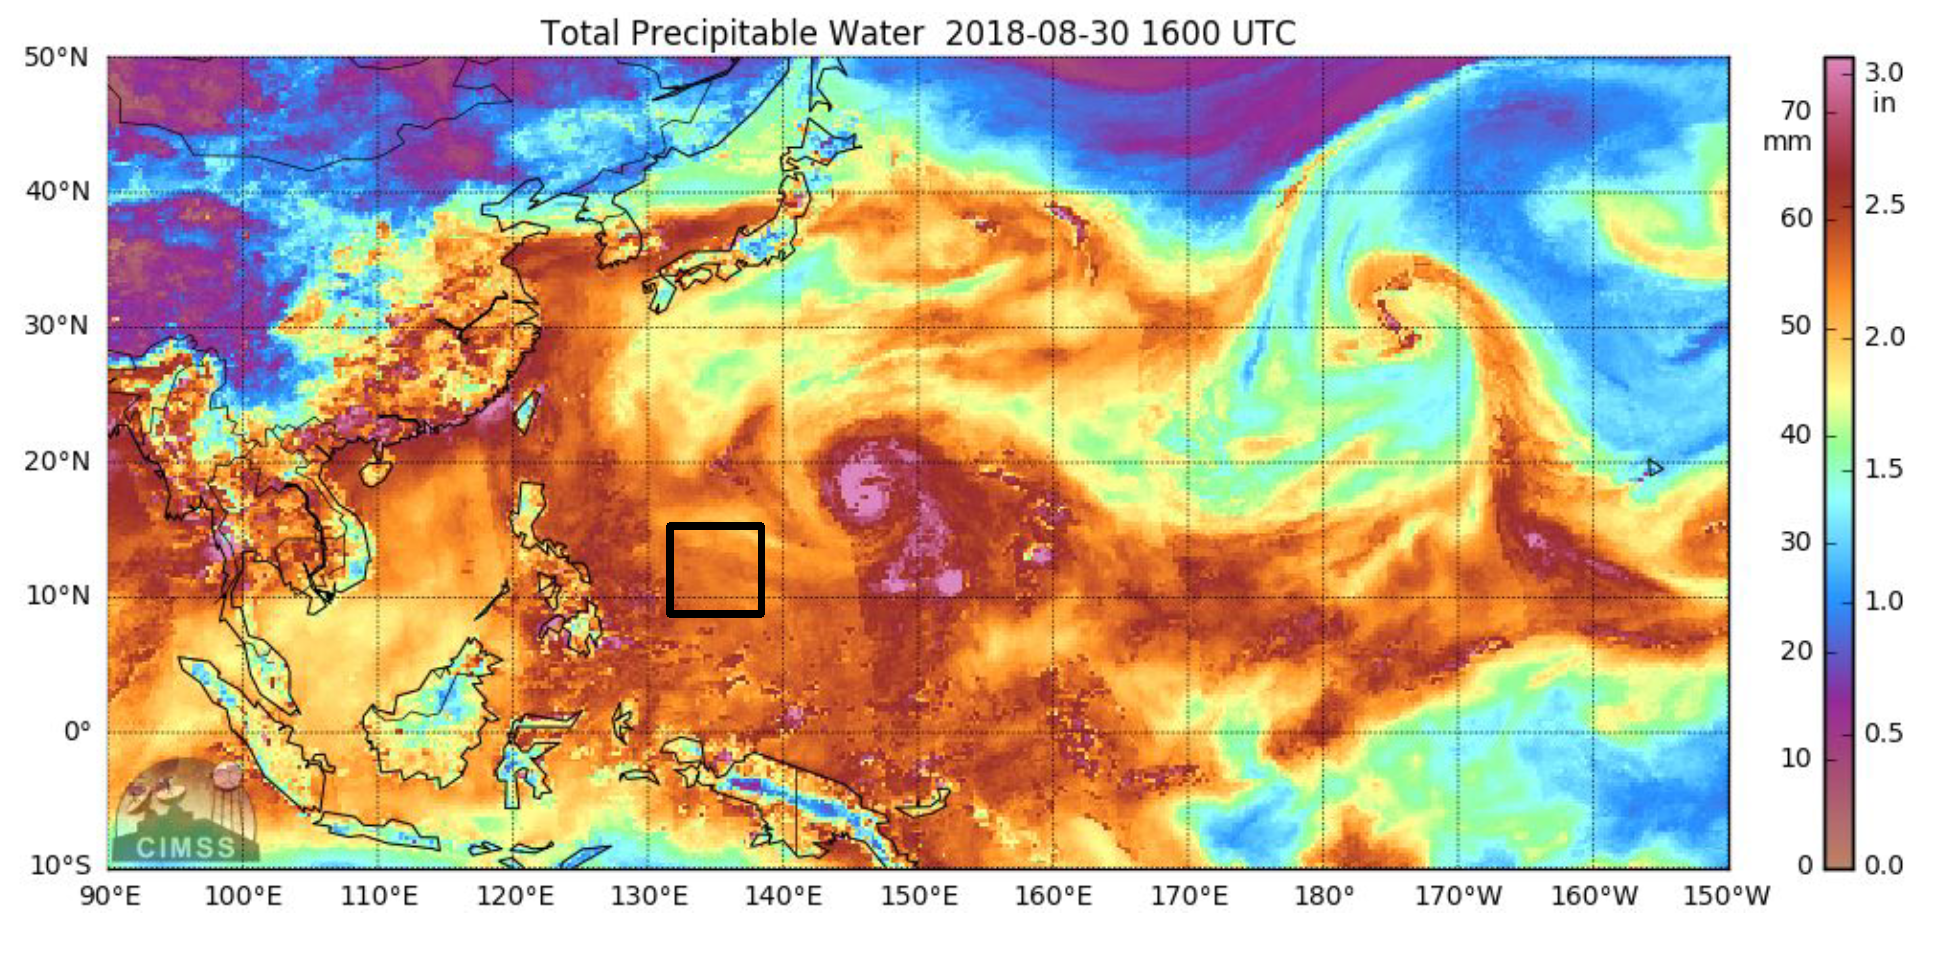
The 12 UTC ECMWF analysis (Figure 5) placed the ship under 15-20 kt easterlies at 850 hPa and on the eastern side of a weak low pressure center. Typhoon "Jebi" was located well to the northeast, and diffluent flow was developing at low-levels between the two features. The COAMPS 12 hour forecast for 12 UTC (Figure 6; the red triangle is approximately the location of the ship) depicts a similar picture, with light southeasterlies at 10 meters above the surface present on the eastern side of the low. Temperature and humidity profiles in the soundings were quite similar throughout the day (Figure 7). Winds were easterly to southeasterly through the atmosphere, with modest shear, but in the 21 UTC sounding we see the winds near the surface beginning to turn towards the south as the weak low moved east and the monsoon westerlies feeding Jebi from the south approached. About 55 mm of precipitable water was present in the column, which was consistent with satellite-derived analysis of TPW (Figure 8). Low-level winds were southeasterly at 00 UTC, easterly at 06 and 12 UTC, then back to a light southeasterly wind by 21 UTC. Despite drying of the middle to upper-troposphere, which is highlighted in the 7 micron IR band (Figure 9), the lowest 200 mb remained relatively moist.
A GPM overpass occurred near the area around 0815 UTC. At the time, scattered convection was viewed near the radar in its 300 km long range scan (Figure 10). In this case, the convection was probably too shallow to be detected beyond 200 km. By this time and throughout the afternoon and evening, the clouds appeared to be organized into short lines parallel to the low-level flow, although this is more easily seen in an animation of images. By the end of 30 August, echoes steered by low-level flow to the south of SEAPOL were moving more toward the north than echoes on the north side of SEAPOL, which were moving more westerly. This complex flow regime resulted in an area of convergence and more intense convection near the radar after 22 UTC on August 30. The discussion of this event will be contained in the summary for August 31.