August 31, 2018
An Early Convergence Zone along a Wind Shift Line, then Persistent Isolated Convection
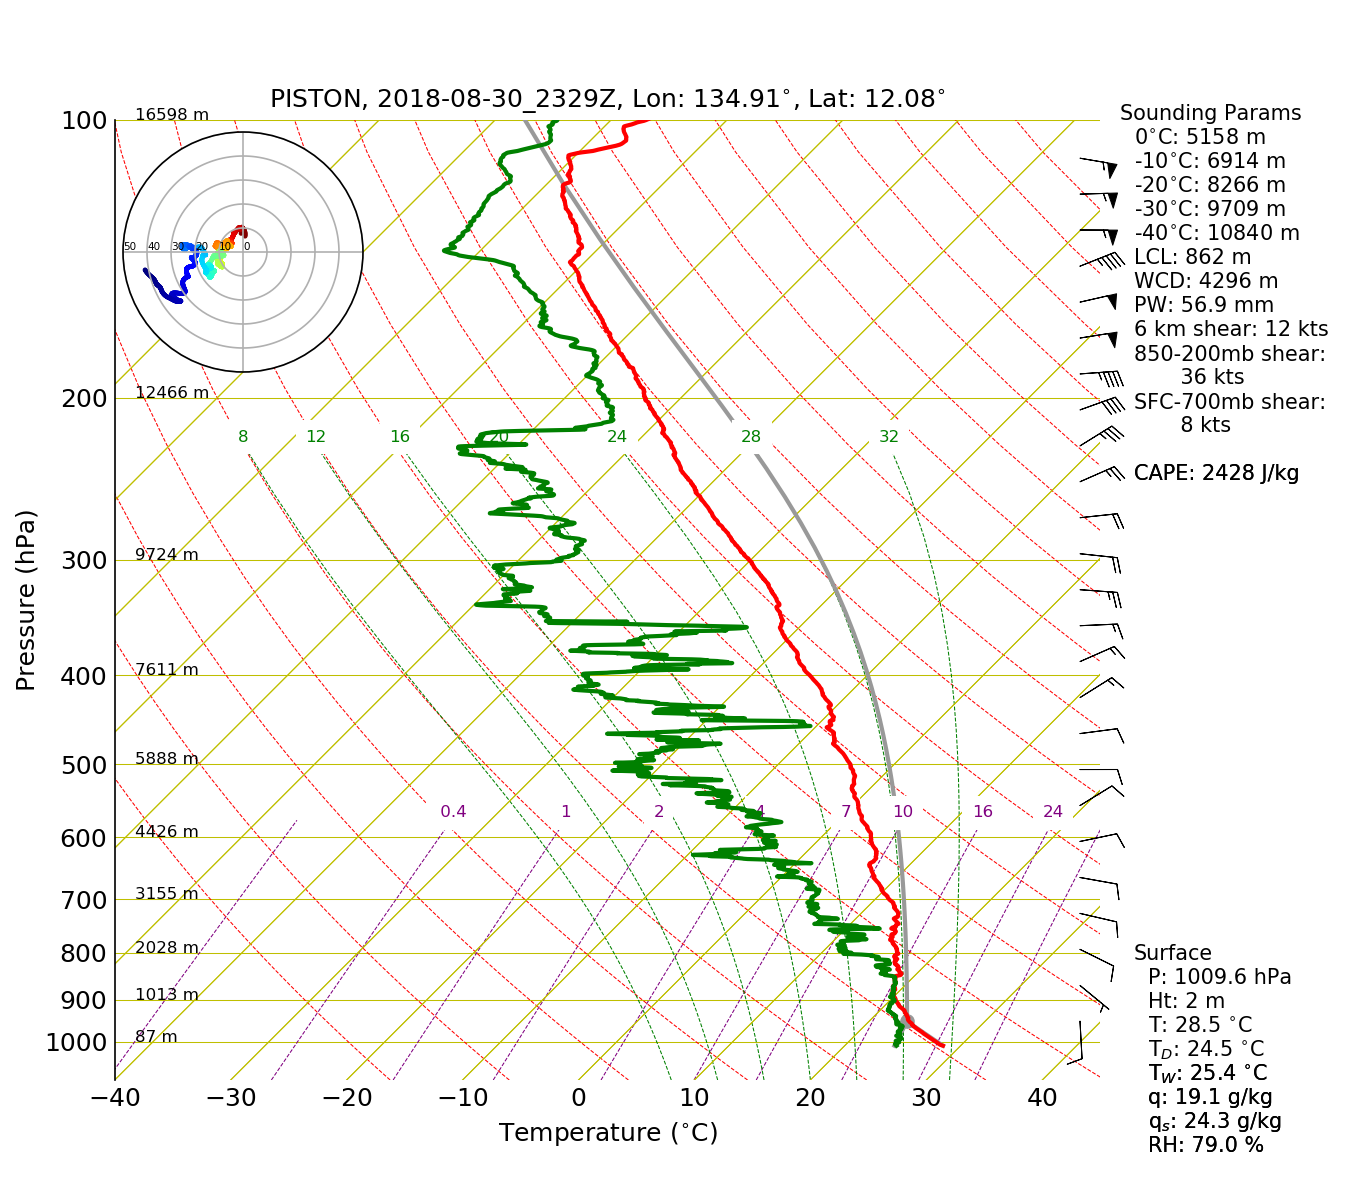
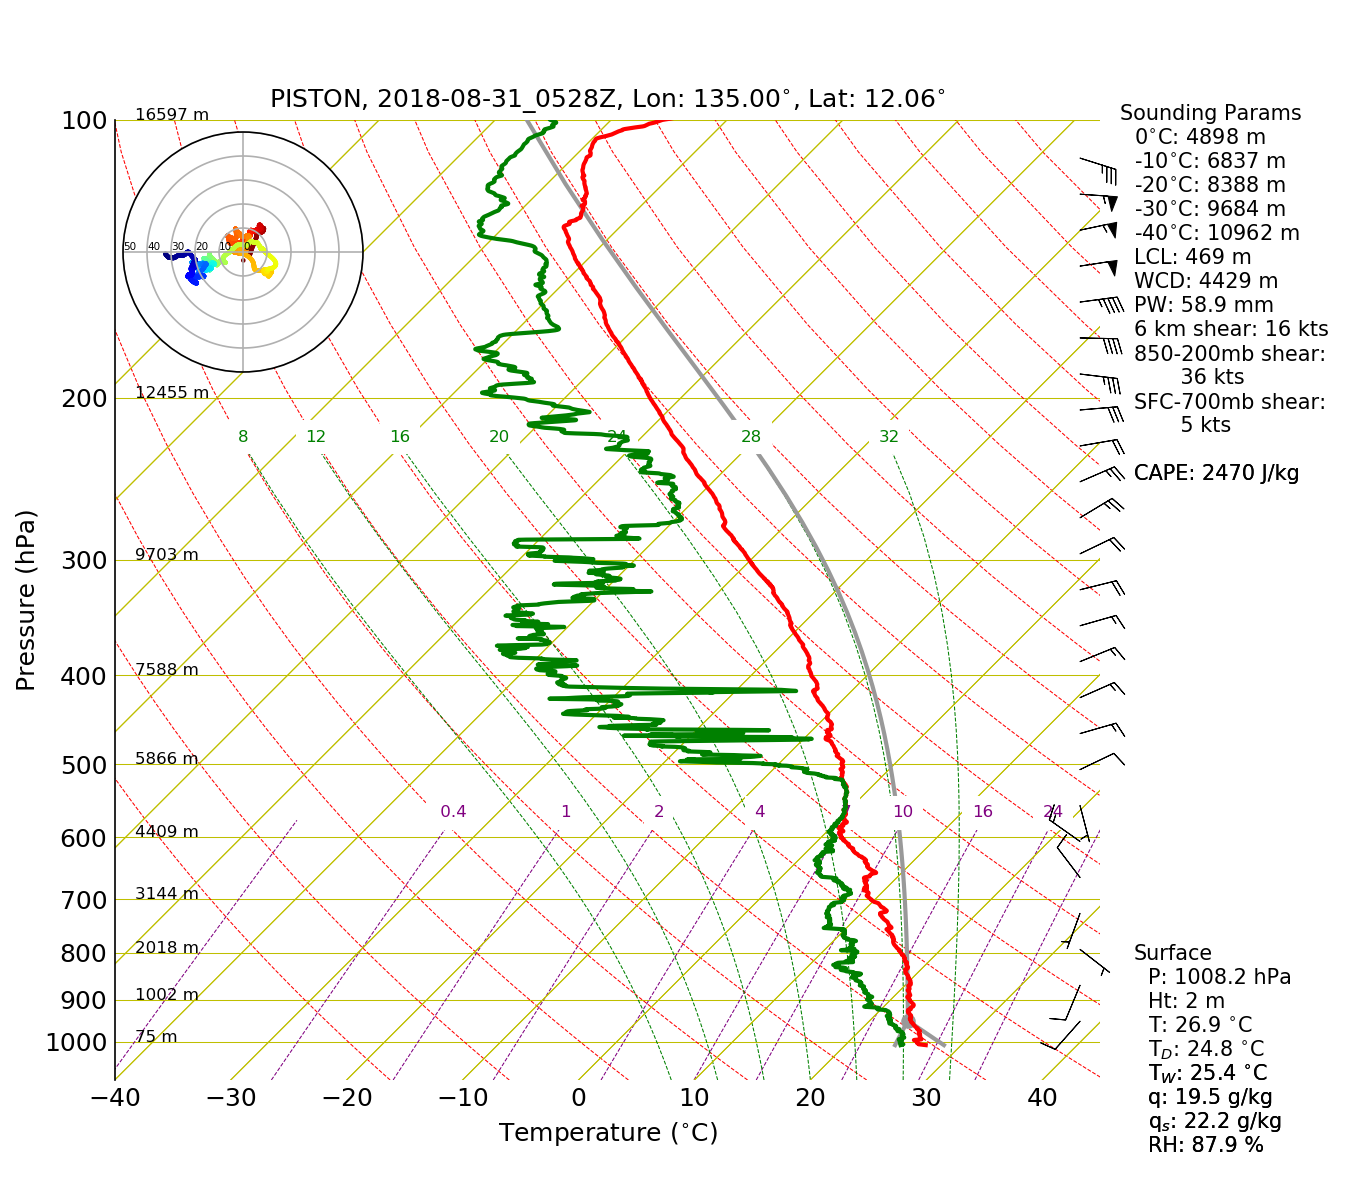
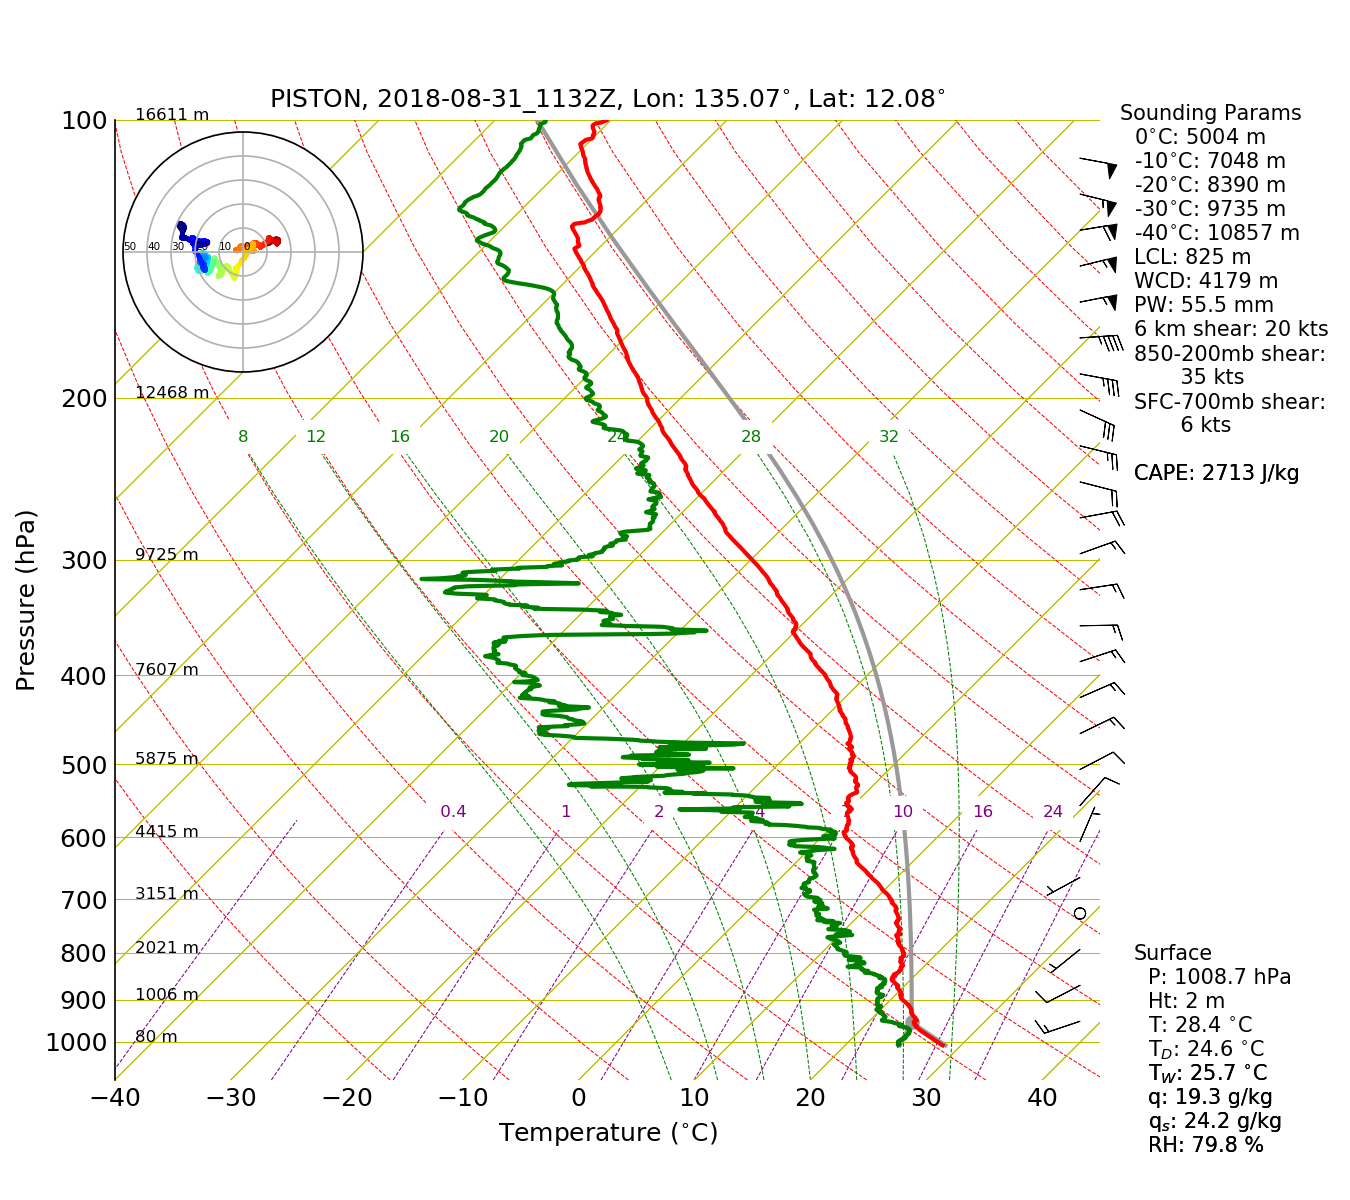
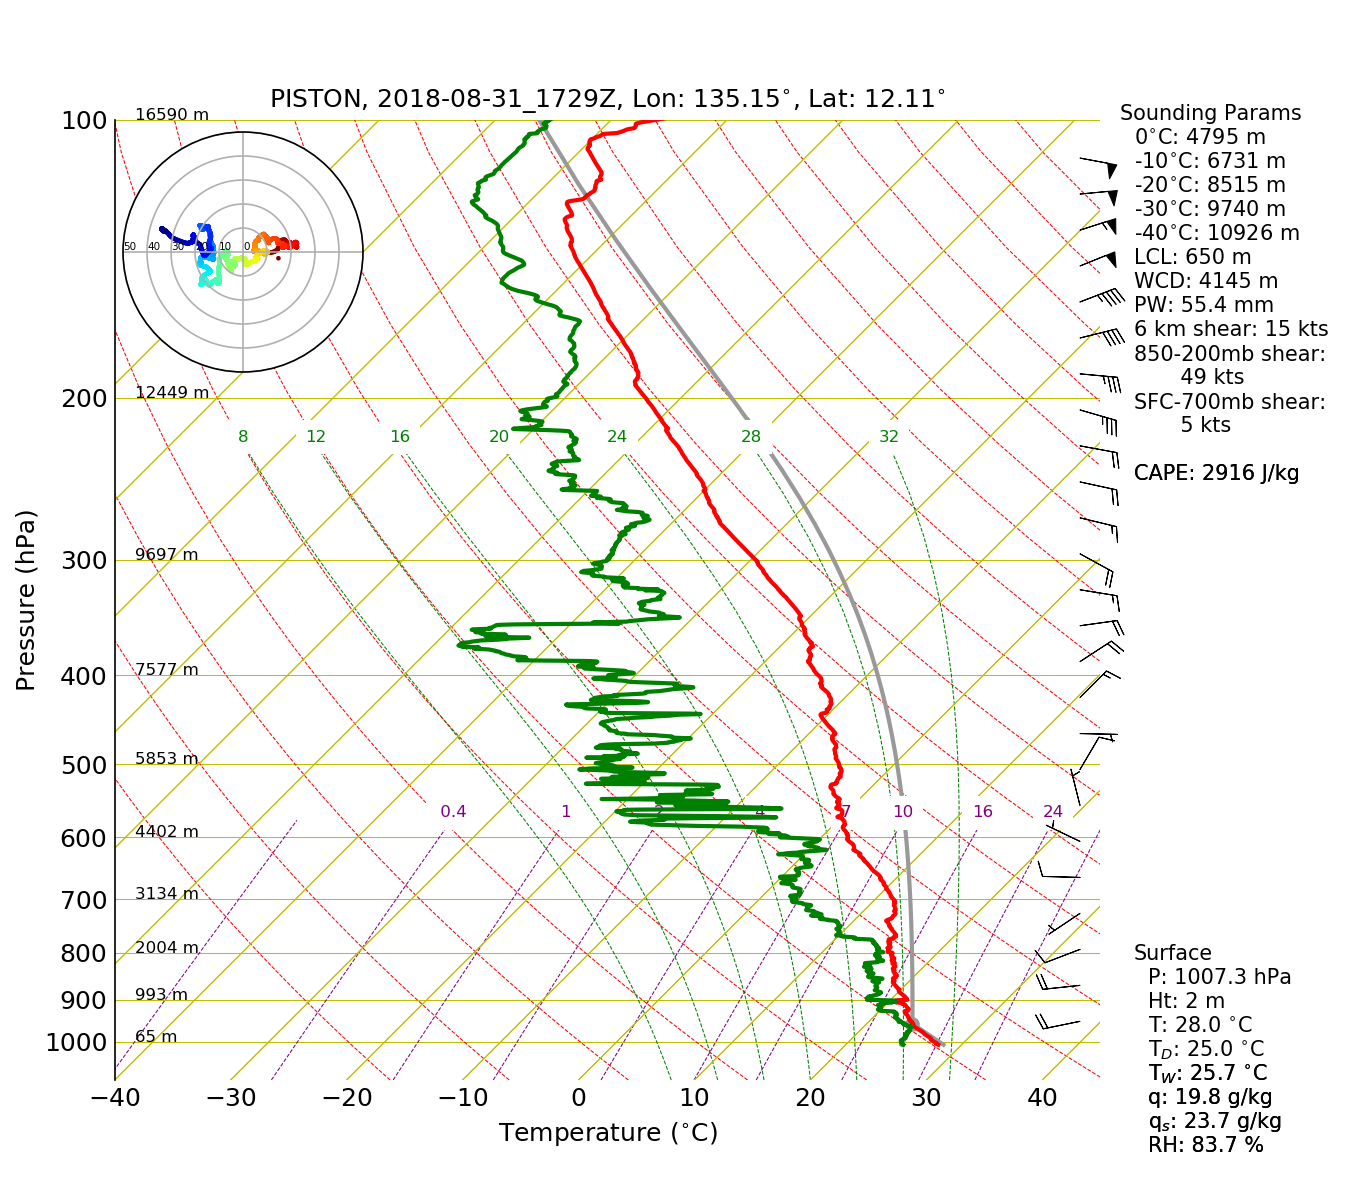
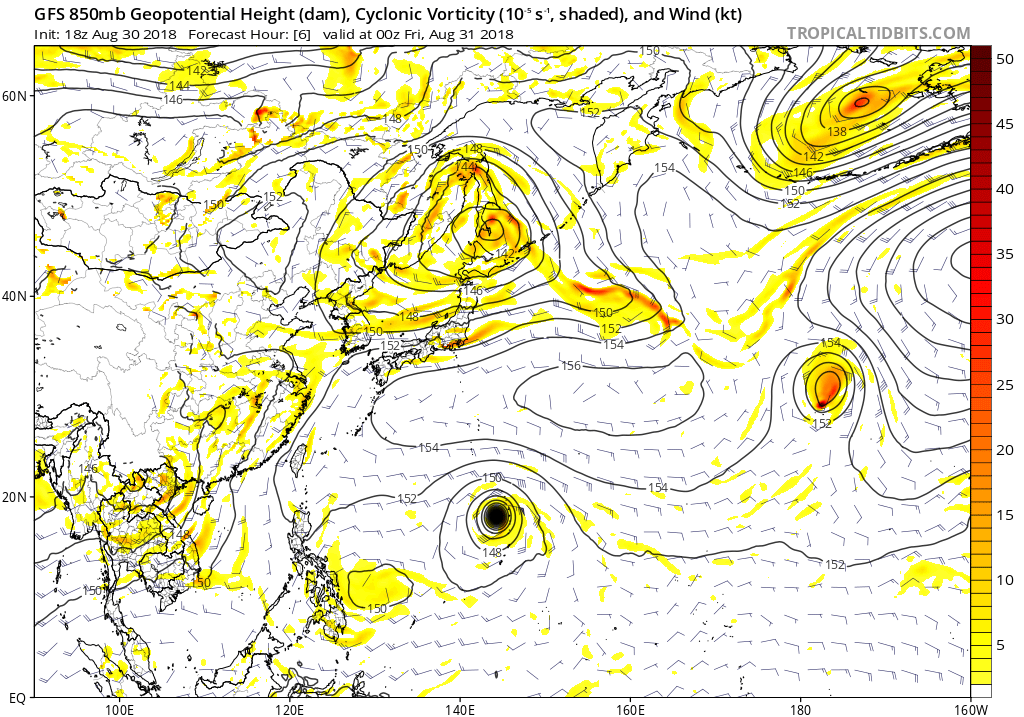
Adam Sobel, Scott Powell, Timothy Lang, Eric Maloney, Byron Blomquist, Simon DeSzoekeThe change to low-level flow that had begun the previous day took hold today. The low-level winds turned from easterly to westerly before strengthening, as shown by the soundings in Figure 1. The soundings also show a familiar thermodynamic structure, with a roughly moist adiabatic stratification between the mixed layer top and around 700 hPa, a barely stable layer above that, and another, cooler nearly moist adiabatic stratification and drier upper troposphere above a saturated or nearly saturated freezing level. On the larger scale, Jebi, far to our northeast, had become a category 5 super typhoon, as indicated in the JTWC warning graphic from 03 UTC in Figure 2, and visible in the Himawari visible image from 05 UTC in Figure 3. Also apparent in this image are Jebi's convective "tail", or perhaps outer rainband, extending to its southeast, as well as convection over the Philippines associated with the weak low that had just moved east away from the ship over the past day or so. The low-level large scale flow at the start of the day is shown in the GFS 6-hour forecast (a close proxy to the 0-hour analysis) from 0 UTC in Figure 4.
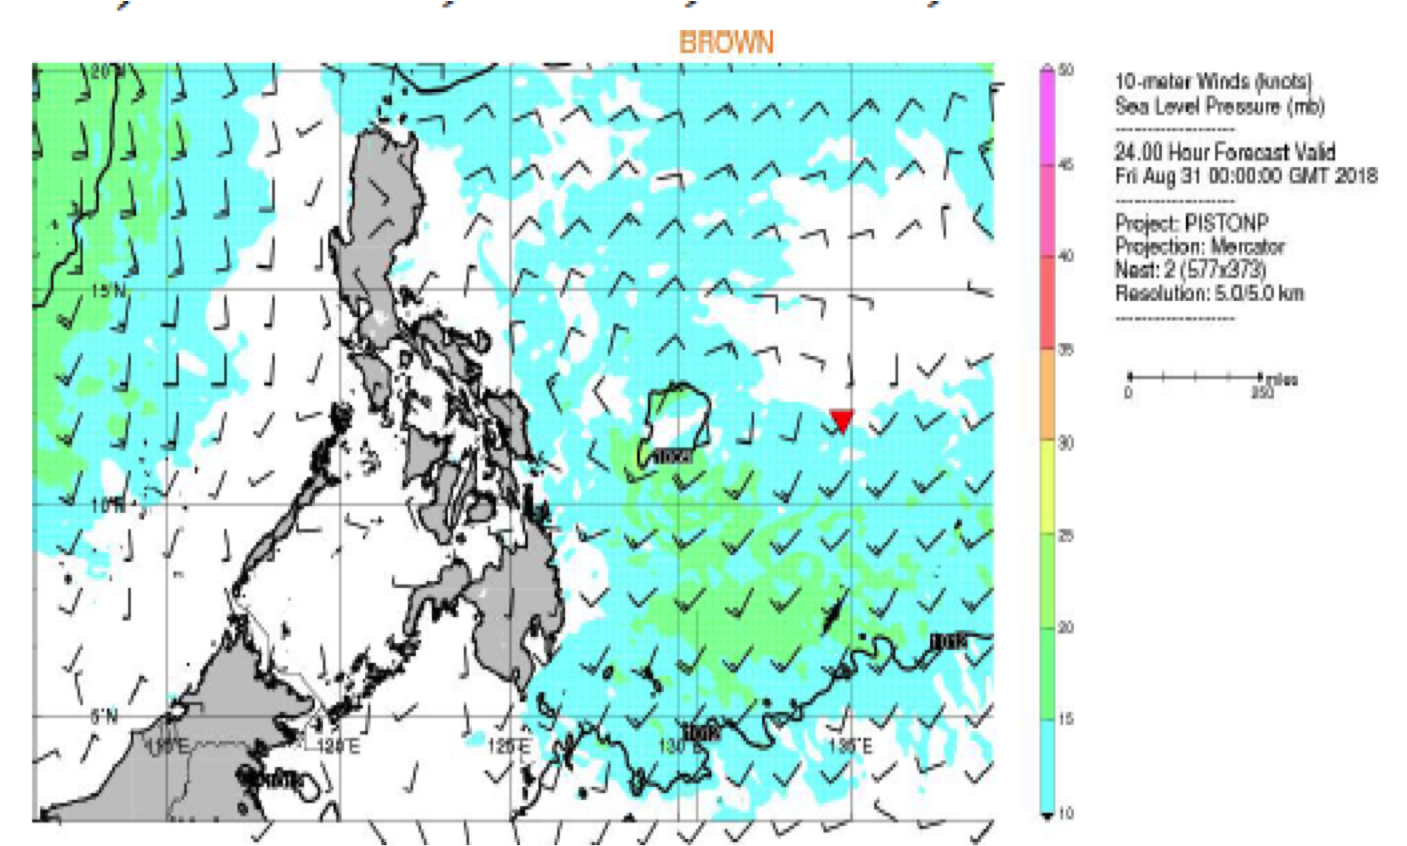
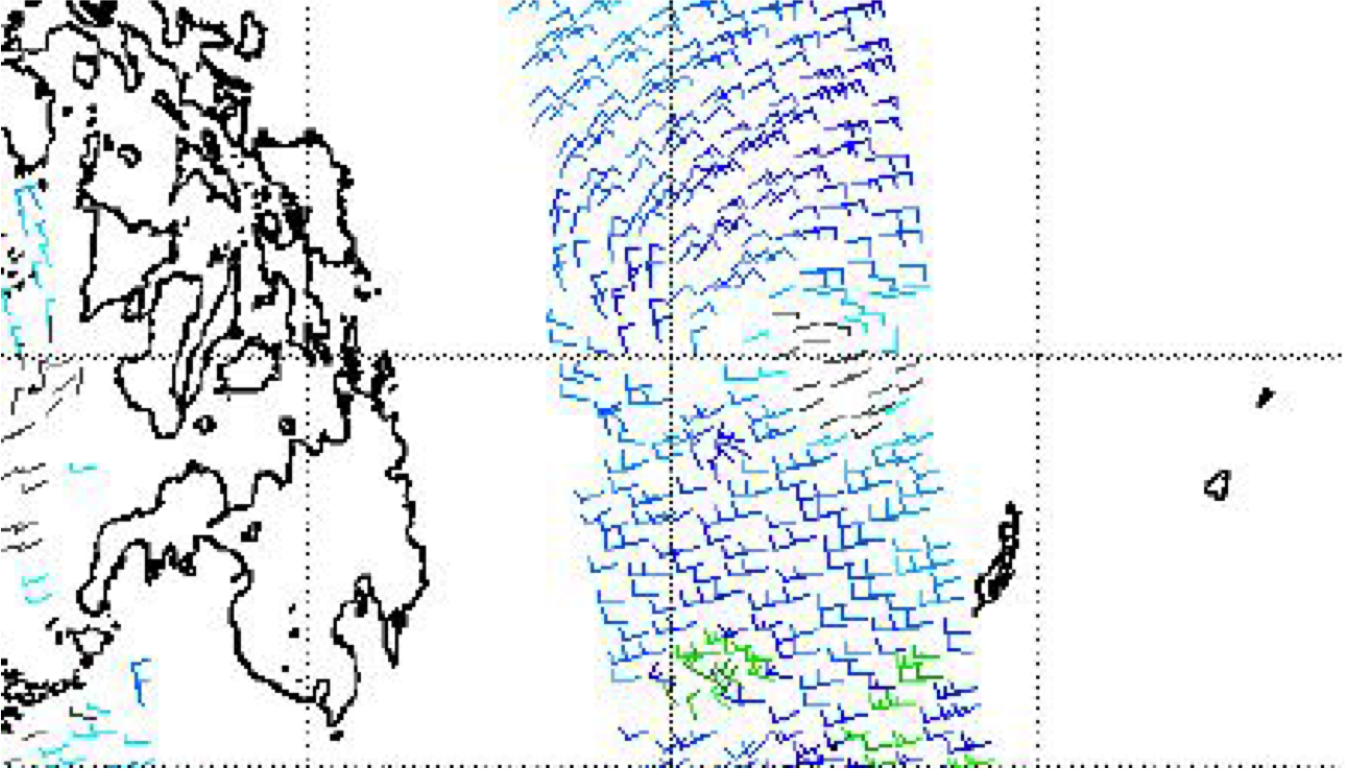
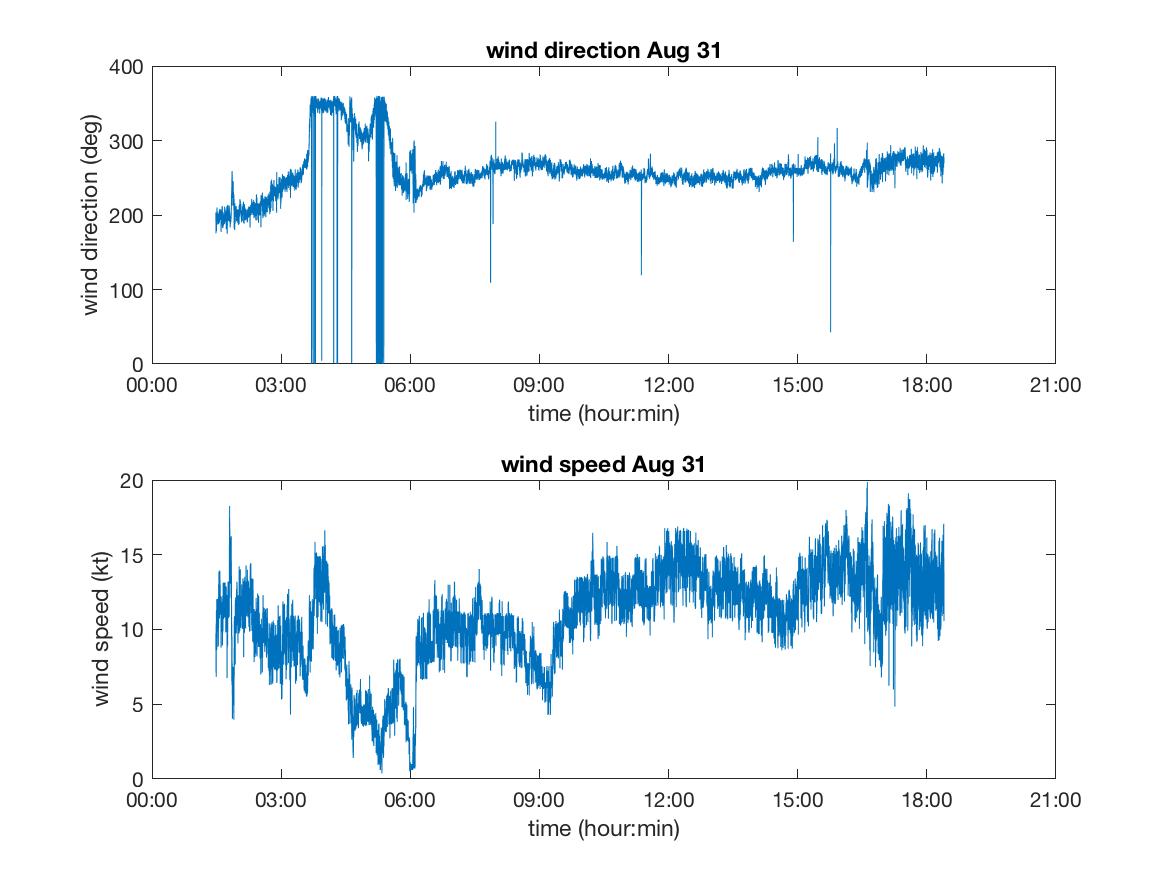
A more zoomed-in estimate of the surface flow field, from the COAMPS 24-hour forecast shown in Figure 5, indicates a sharp turn from southerly to easterly just north of the ship, indicated by the red triangle. An ASCAT pass from 18 UTC the previous day (Figure 6) shows a similar feature slightly further west, at the eastern edge of the swath. Animations of radar imagery from early in the day showed that the ship was quite close enough to this flow feature that the sharp turn of the low-level wind was evident within the radar's view, with echoes just north of the ship moving westward echoes just south of the ship moving north or northeastward, and even hints of echoes moving southward to the northwest of the radar during a brief period between 03 and 06 UTC when the surface wind turned northerly as shown by the ship's SCS system (Figure 7), presumably due to a local flow feature, perhaps a gust front associated with one of the nearby convective systems.
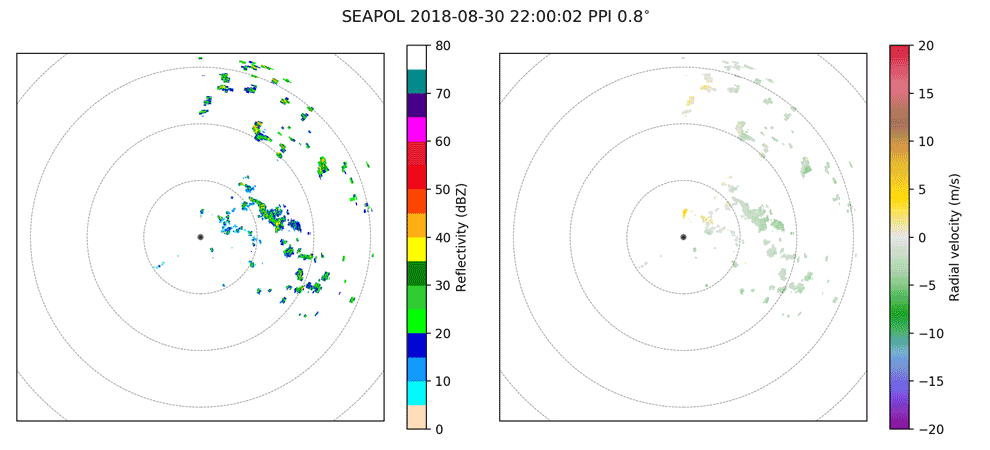
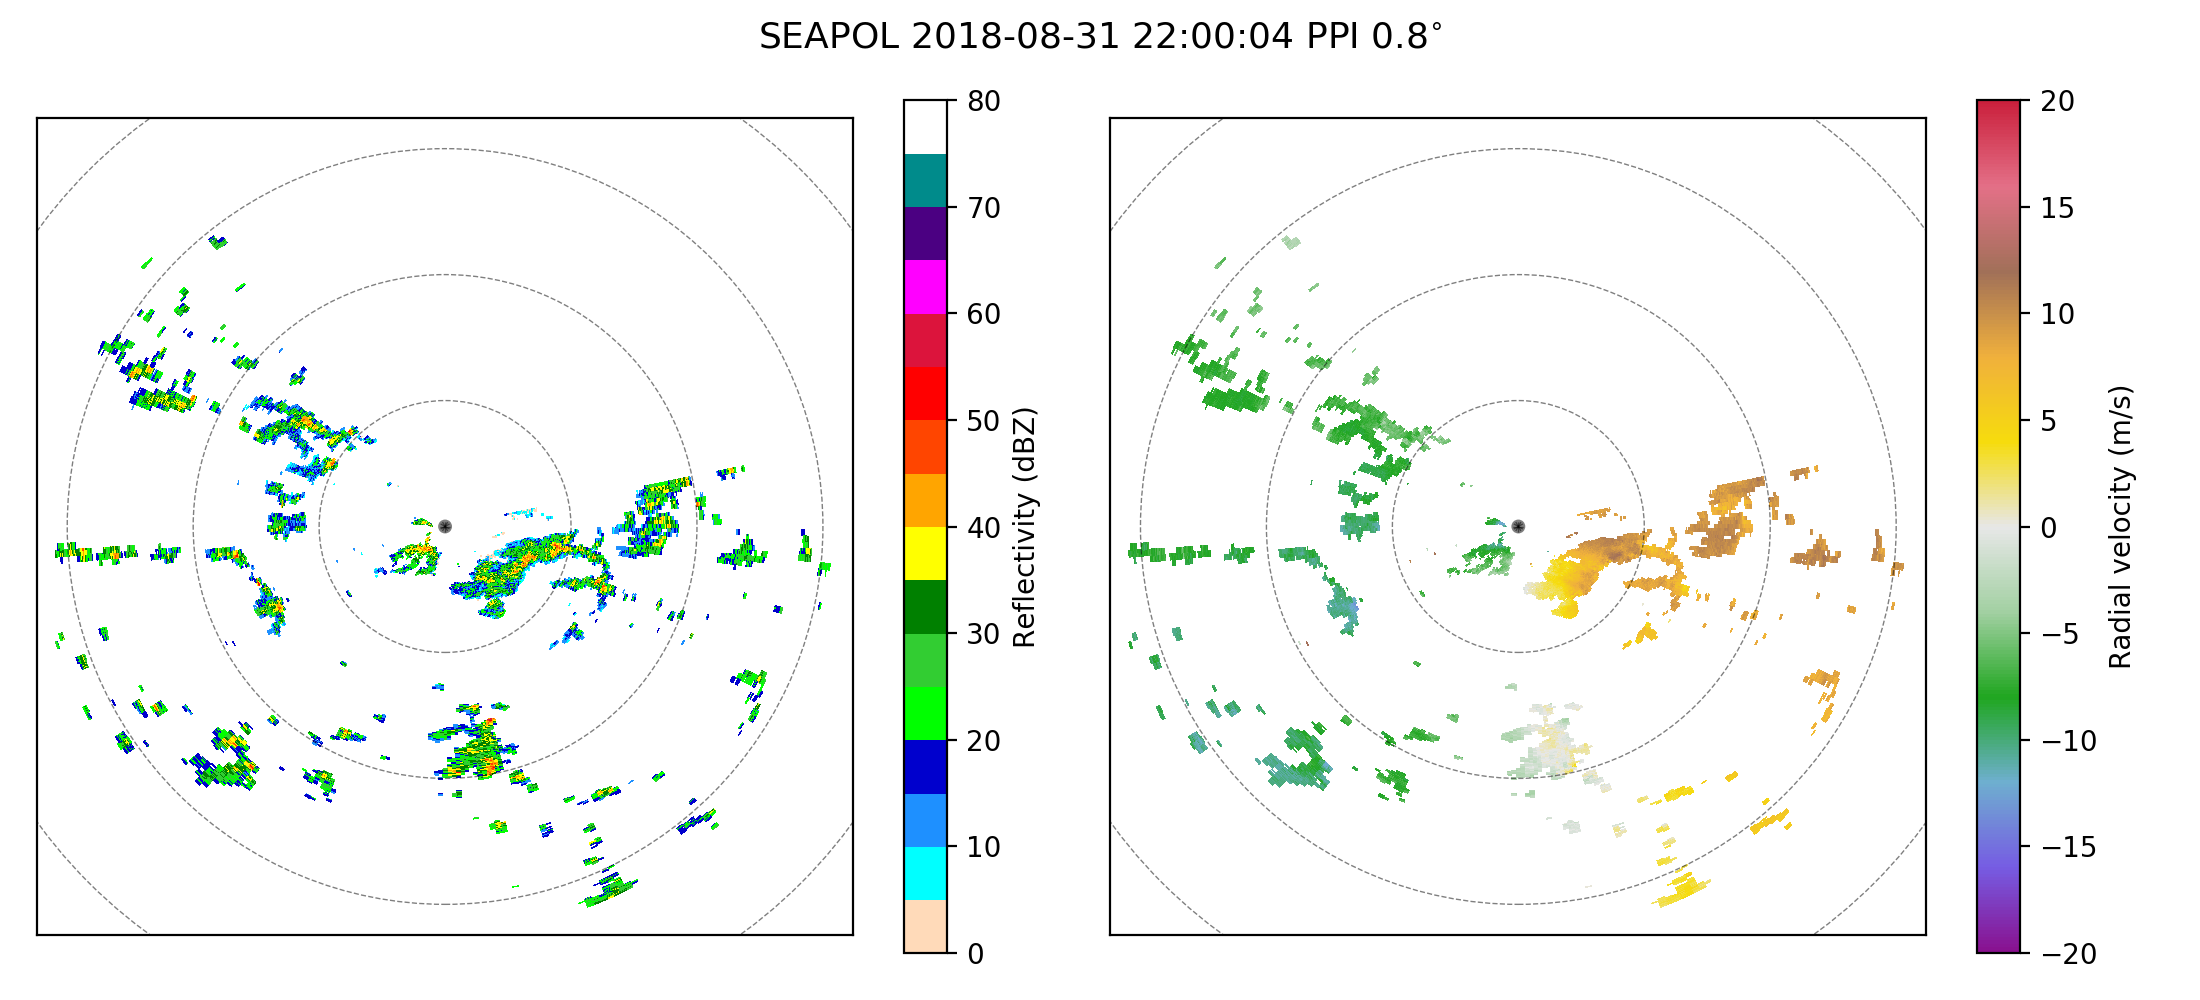
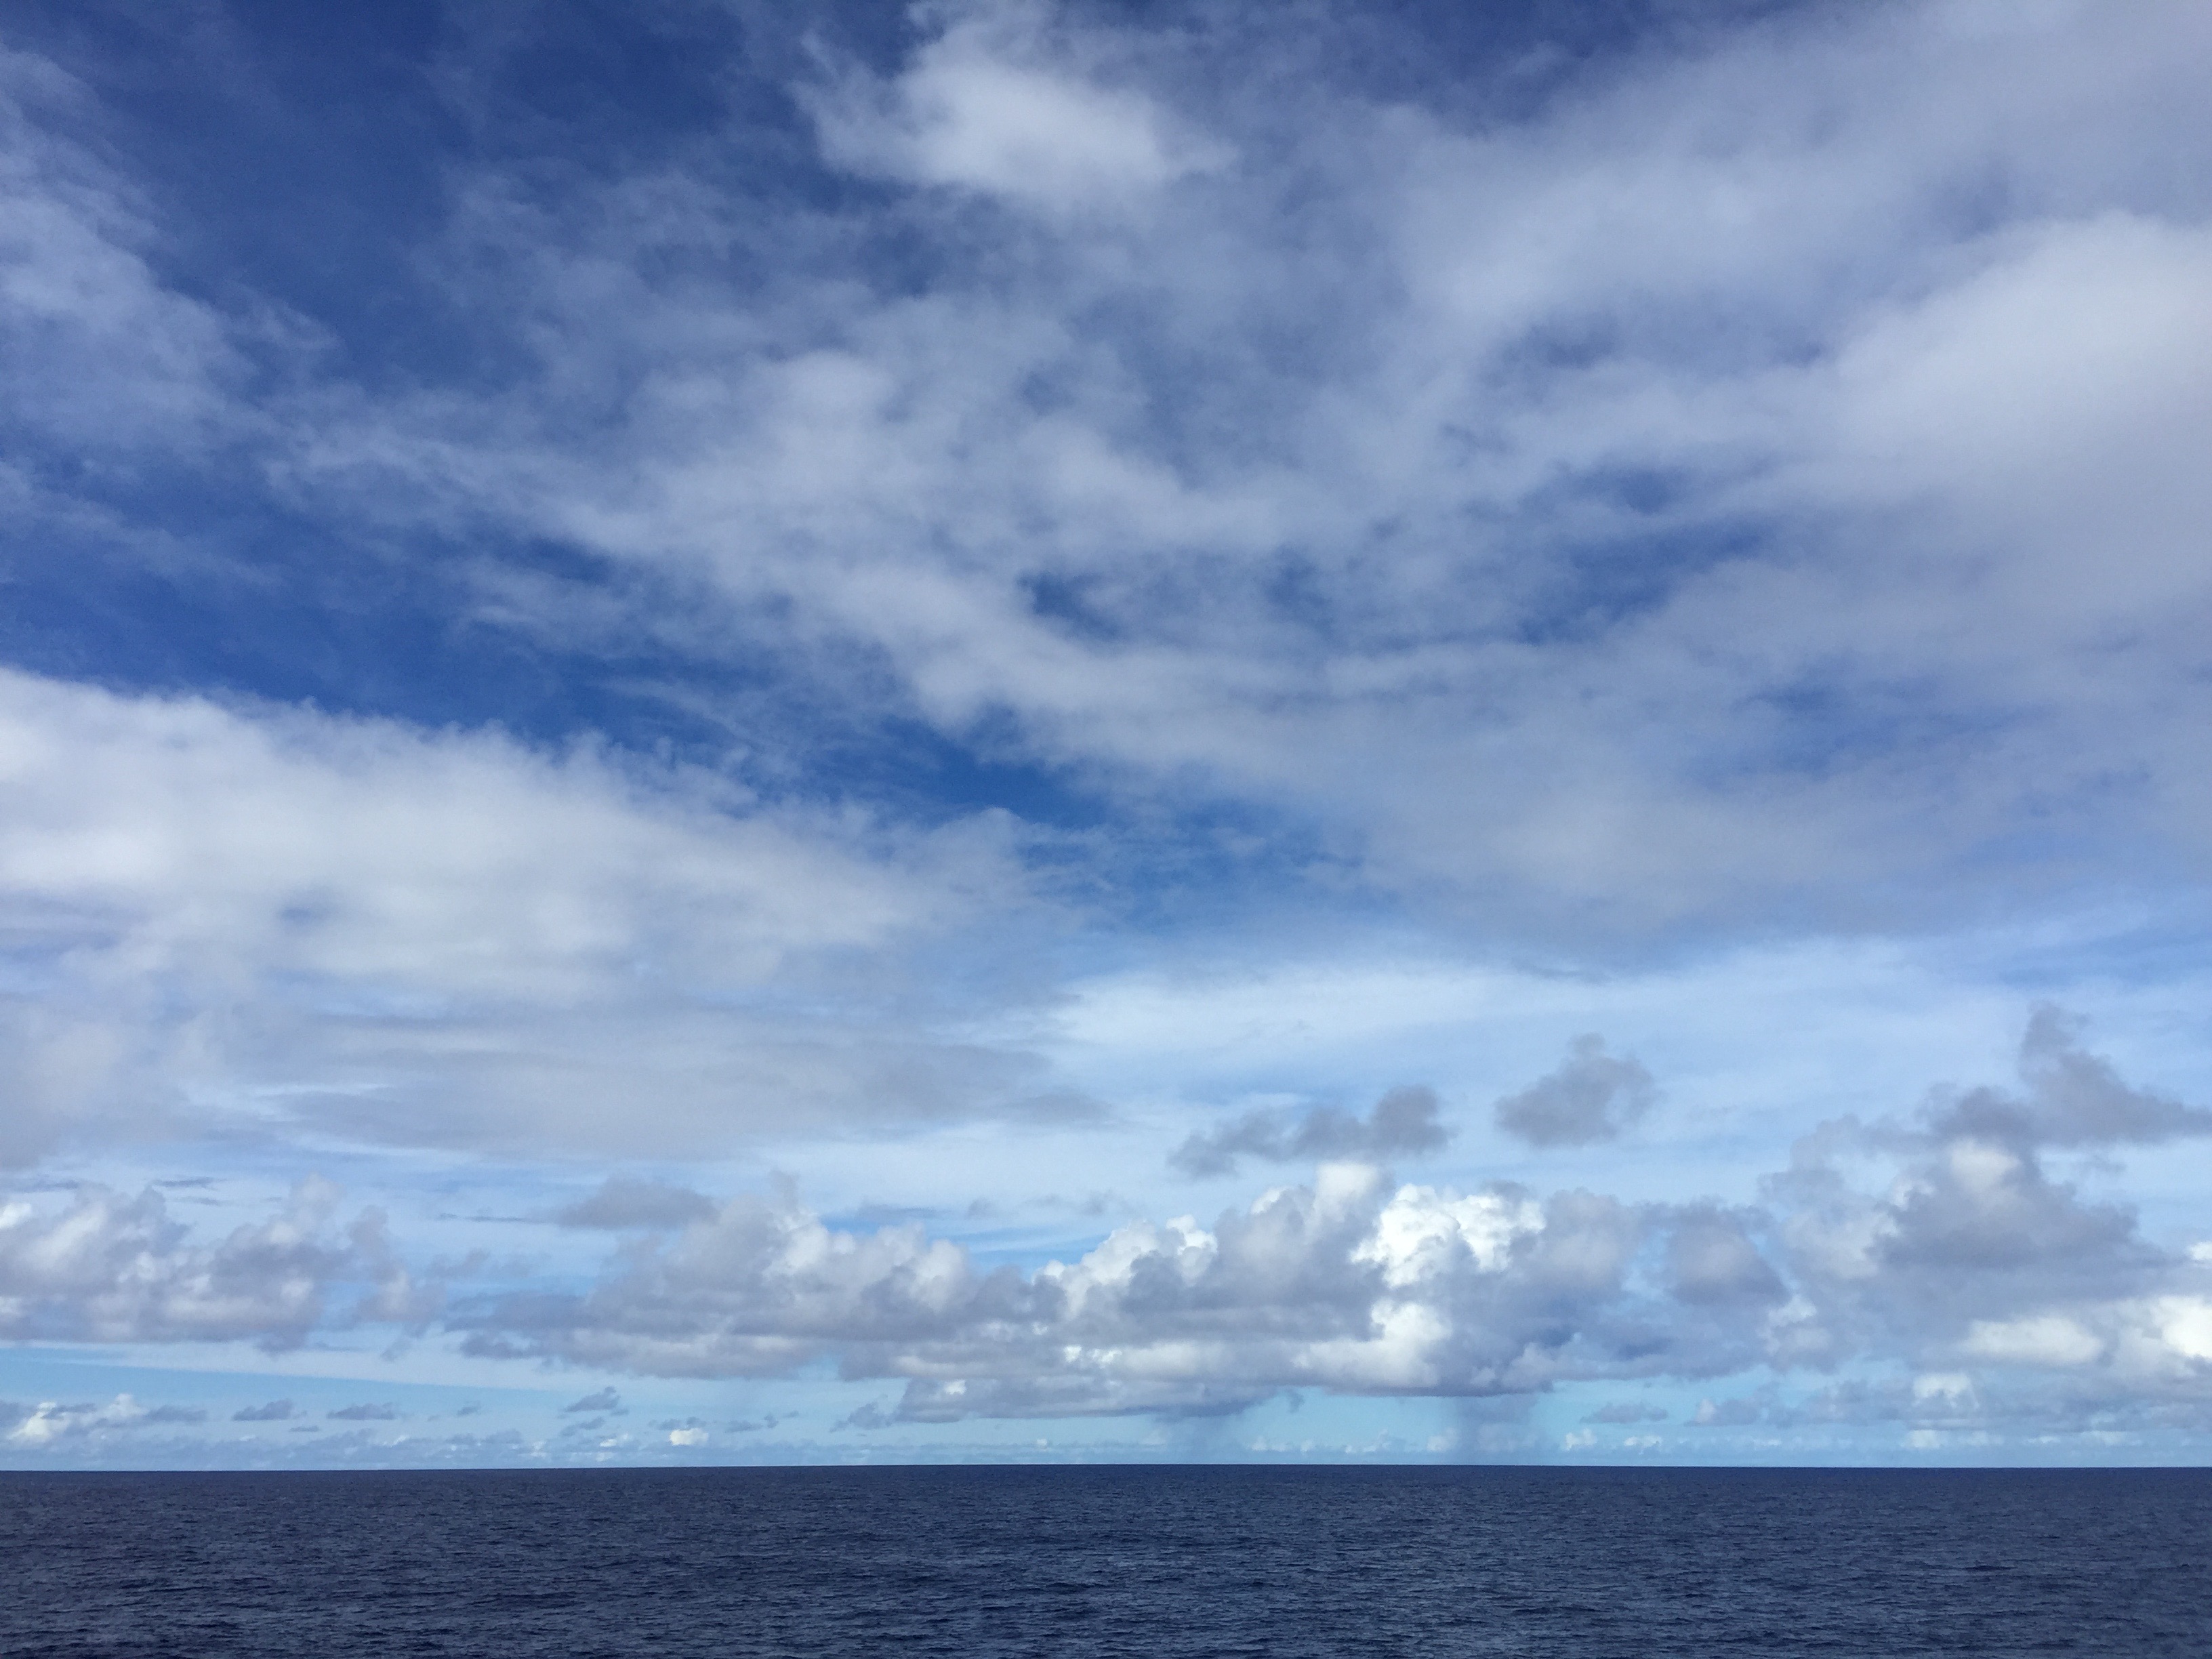
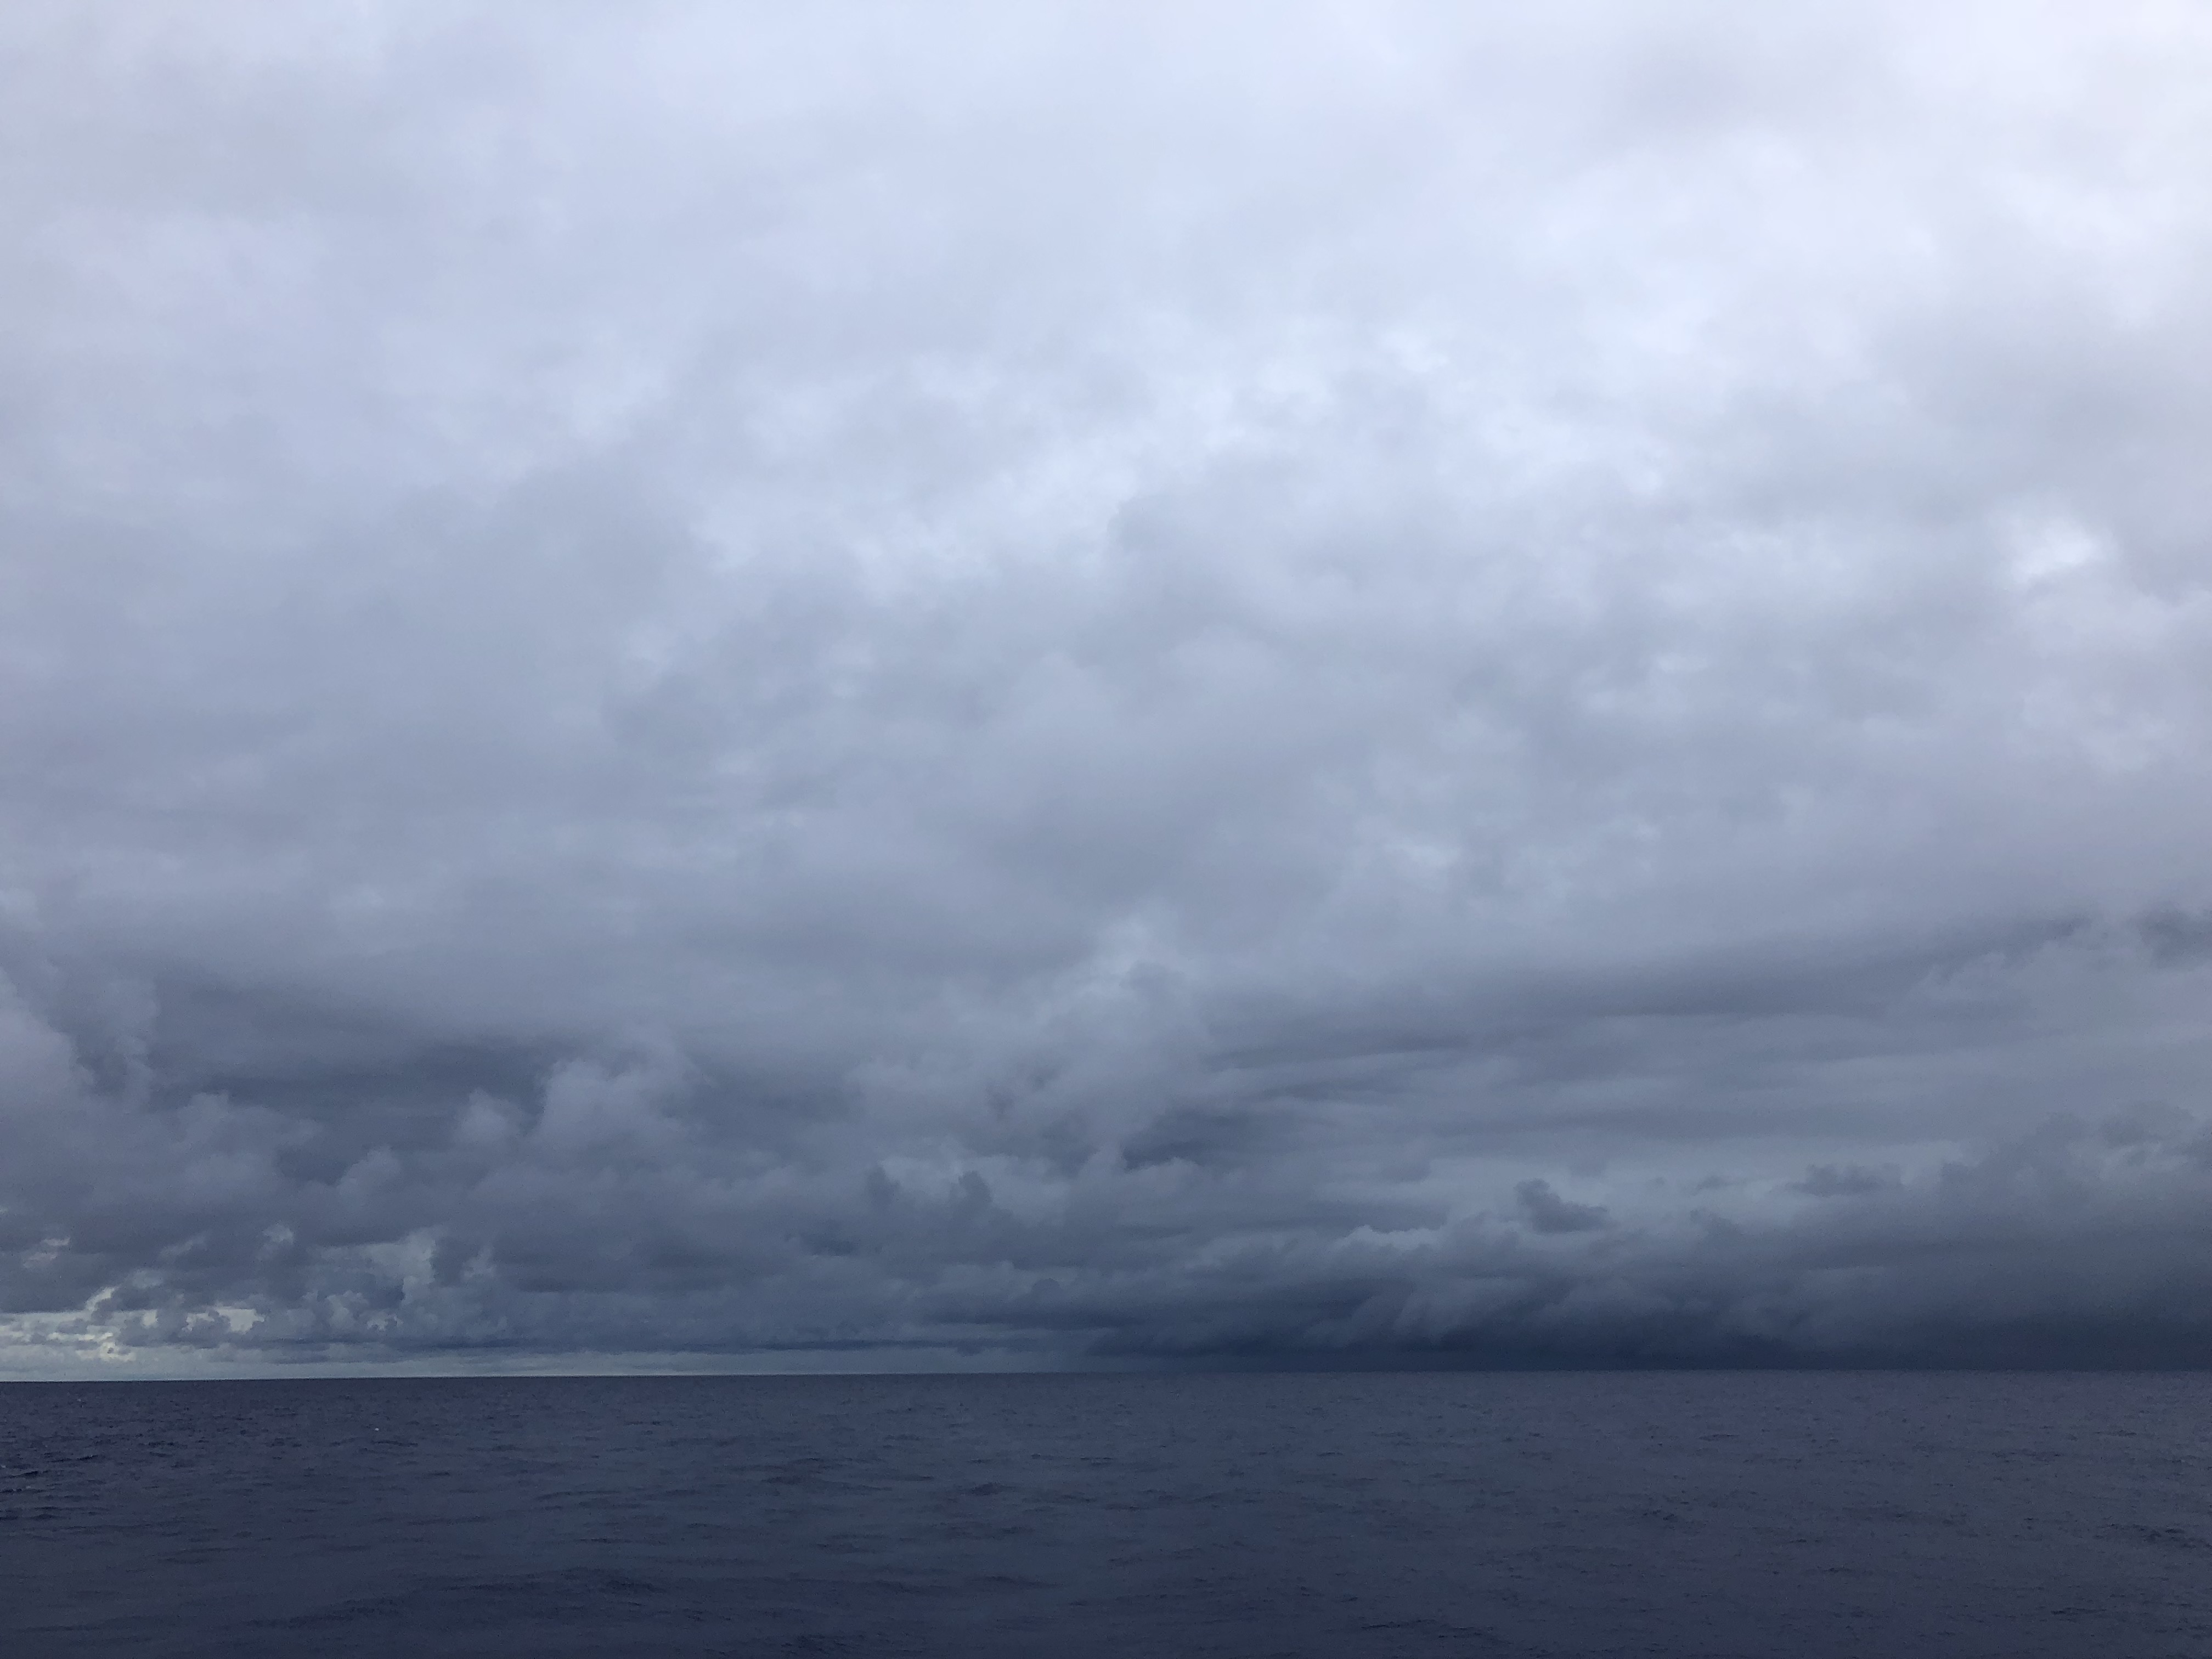
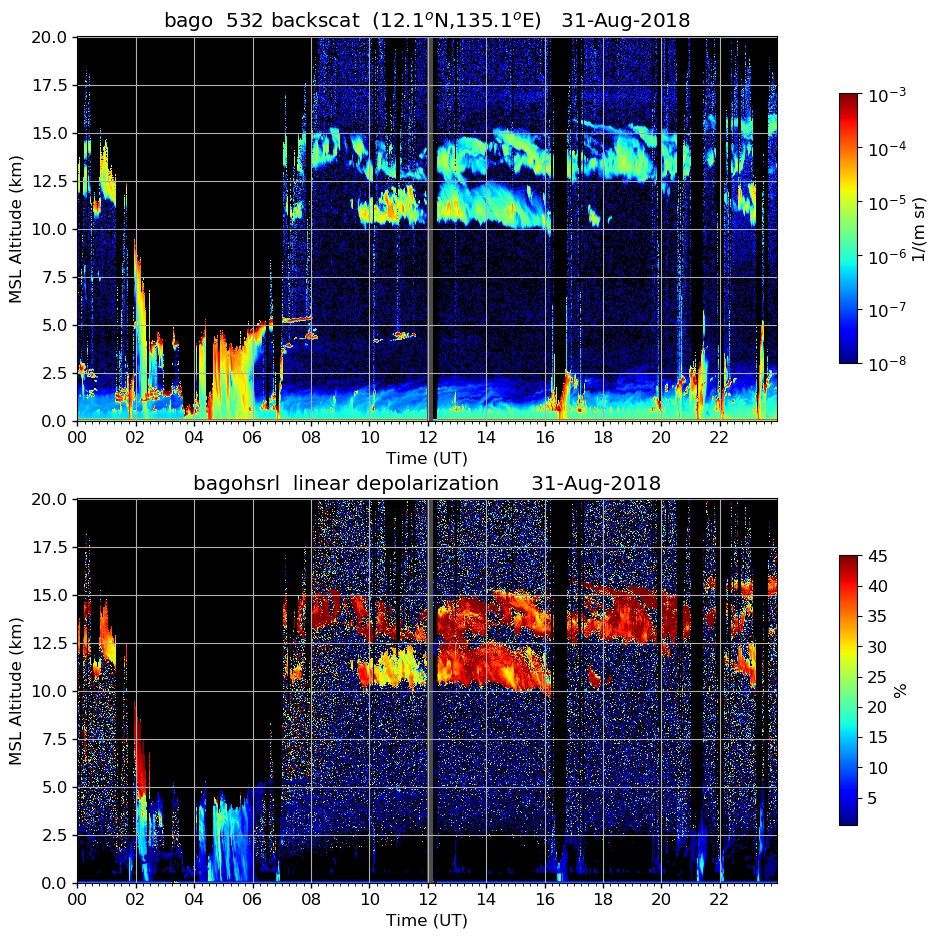
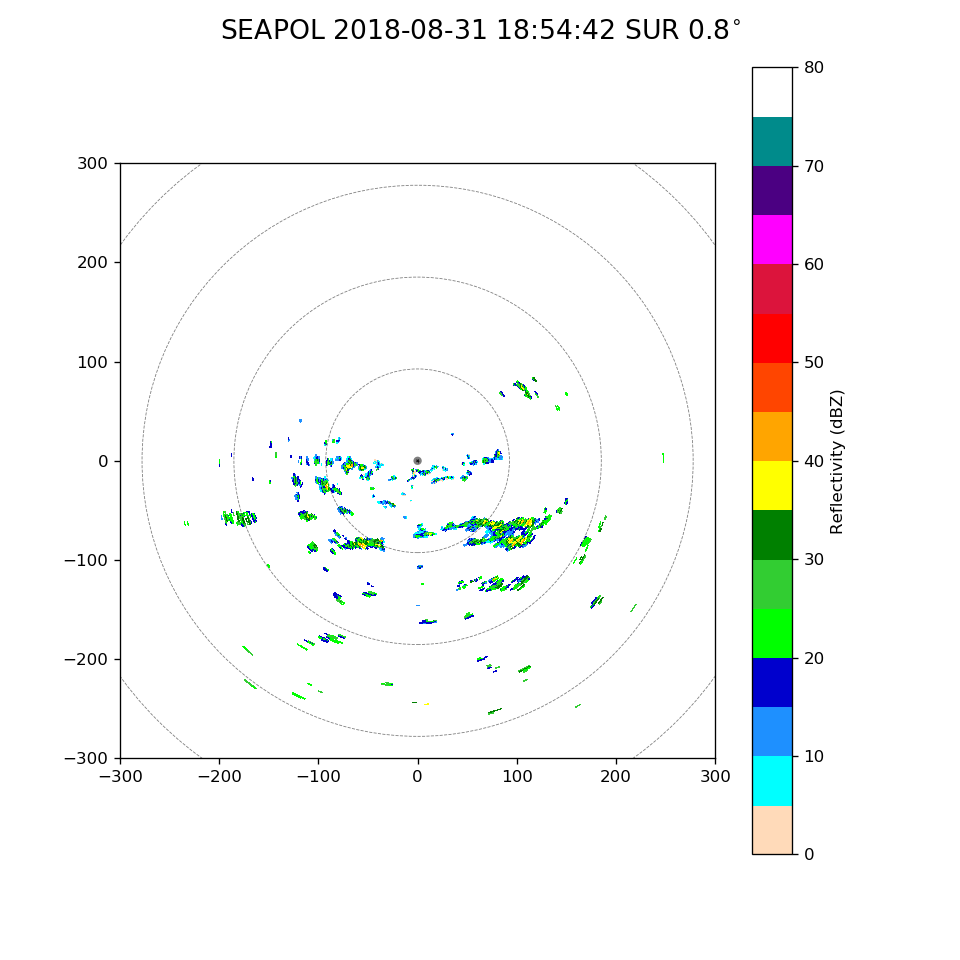
In Figure 3, the ship was located near the narrow band of convection seen near 12°N between 132°E and 136°E. Figure 8 is an animation of low-level 0.8° scans from SEAPOL between 2200 UTC 30 August and 0600 UTC, including the time of the Himiwari image. The animation highlights the split flow pattern discussed above. By 07 UTC, convection started moving east-northeasterly, consistent with the low-level wind direction that appeared in the 12 UTC sounding and the ship wind displayed in Figure 7. Isolated convective echoes continued to move through the radar domain for the remainder of 31 August; however, most of the cells were weak and maintained a small areal coverage through 17 UTC. After that time, several larger O(100km^2) echo objects were observed, such as in the 0.8° scan at 2200 UTC (Figure 9). Cloud photos taken throughout the day (Figure 10) pattern the echoes seen by radar during the day. Persistent high cloud is seen, and was detected between 10 and 15 km by HSRL (Figure 11).
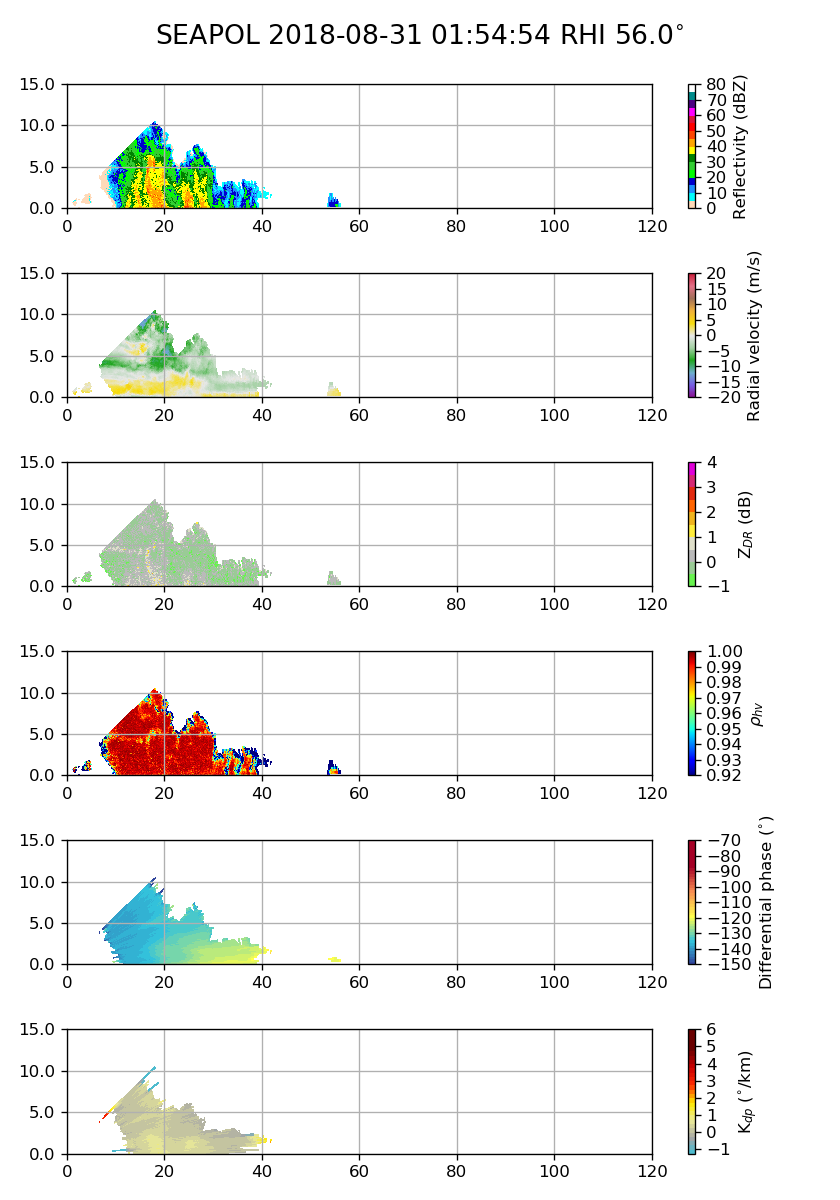
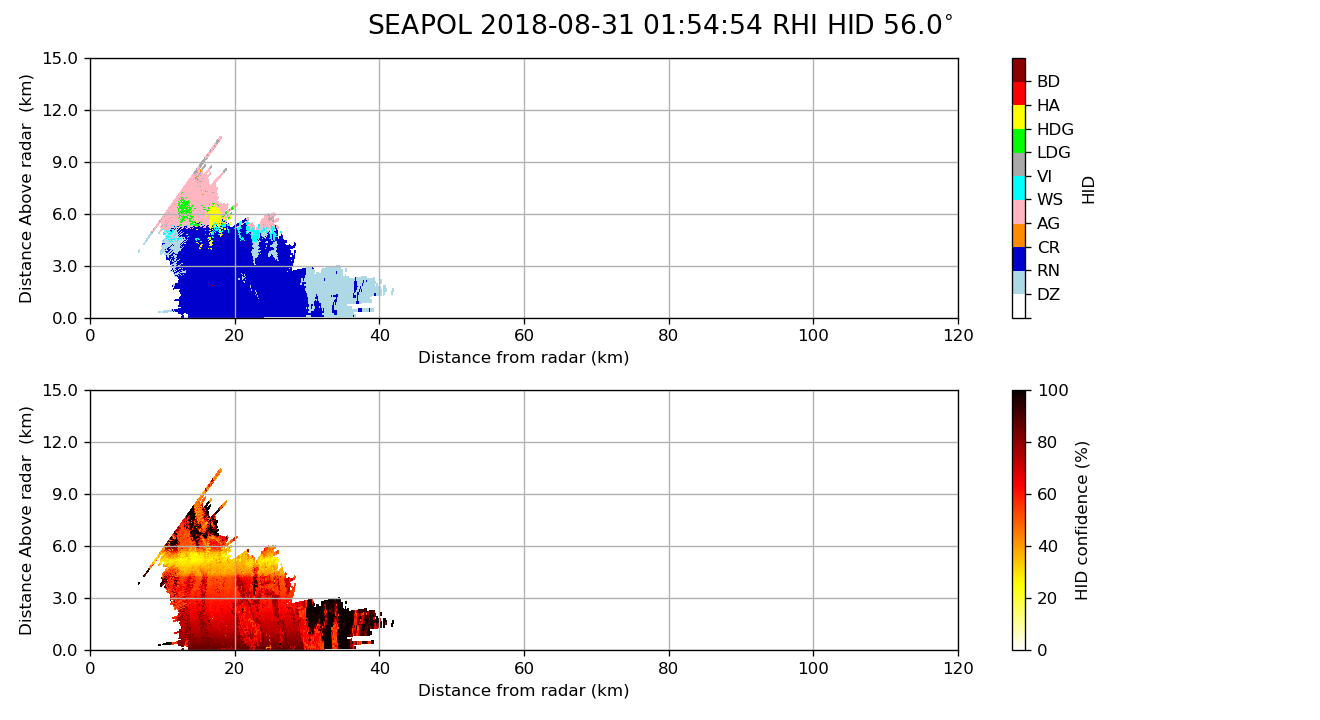
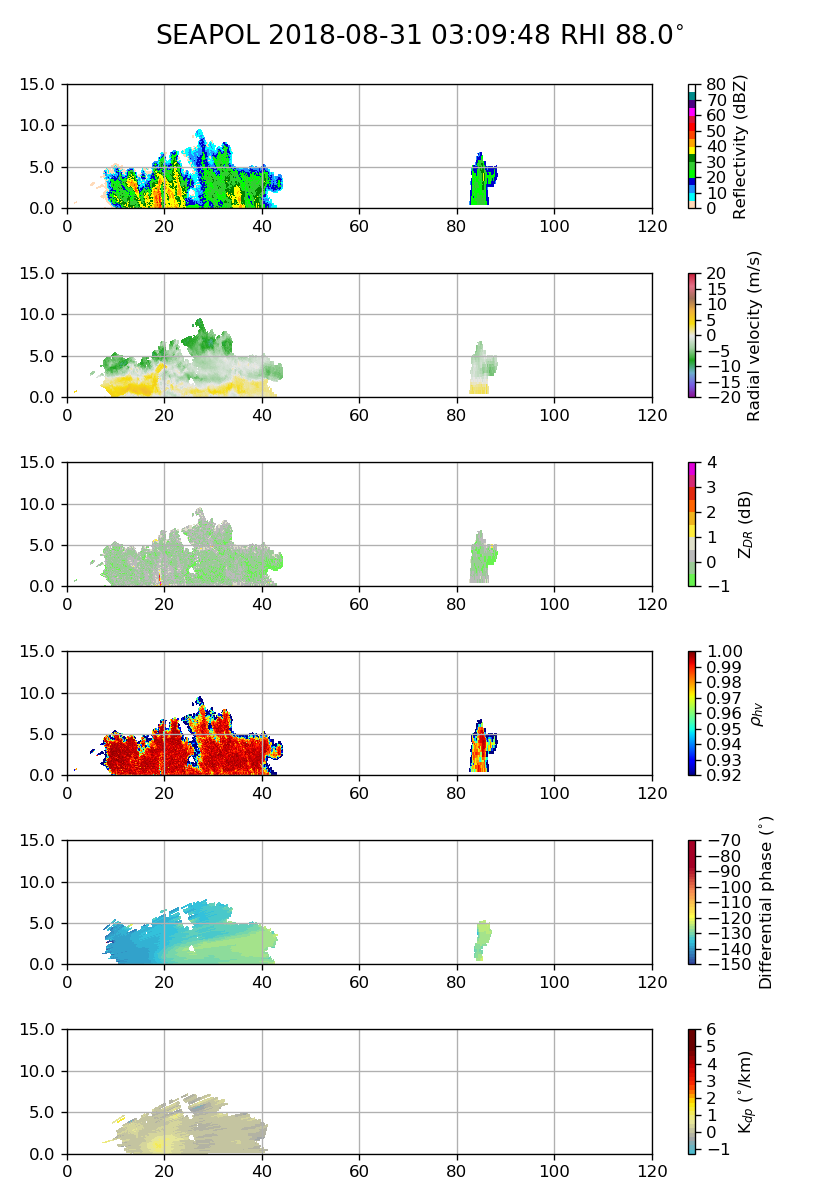
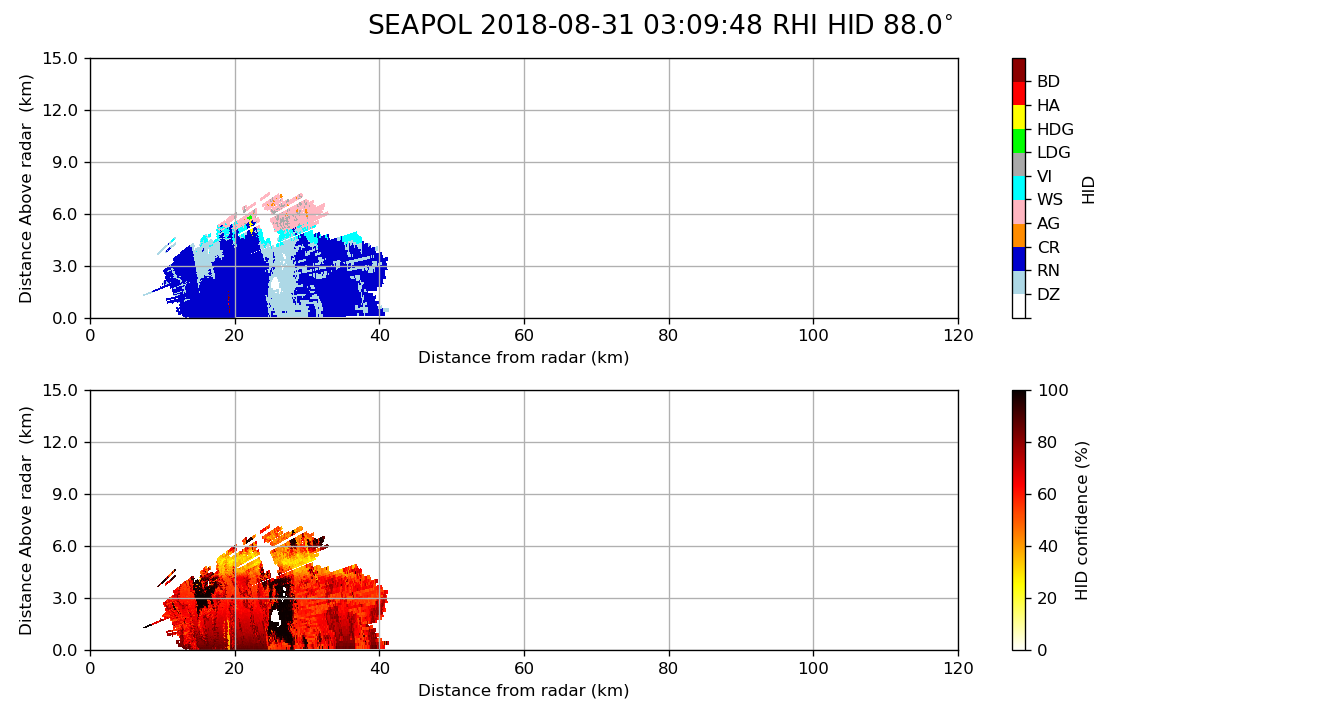
As the convergence line serendipitously formed very near the ship, it was first fairly shallow--only about 5–8 km deep. Between 02 and 03 UTC, the convection briefly pulsed to 10 km or a little higher. An RHI of convection typically observed is seen in Figure 12, and the example of deeper convection is illustrated by Figure 13. Corresponding hydrometeor identifications (HIDs) in each figure are sensible, indicating rain or light rain below the freezing level, and ice aggregates above. The occasional RHI HID indicated low density graupel above the stronger--yet still shallow--convective elements. The remainder of the day featured unremarkable convection that was contained mostly below 5 km, with an occasional cell reaching as high as 10 km after 17 UTC.
There were several NASA satellite overpasses today. CYGNSS overpasses betwen 0445 and 0506 captured the shallow convective complex and complicated wind field observed in the morning. There were two GPM overpasses. One was at 0721 UTC, when convection was mostly suppressed. The 1854 UTC long-range surveillance scan (Figure 14) depicts the convection seen during the 1850 overpass. At the time, the ship was located near 12.08N, 135.17E.
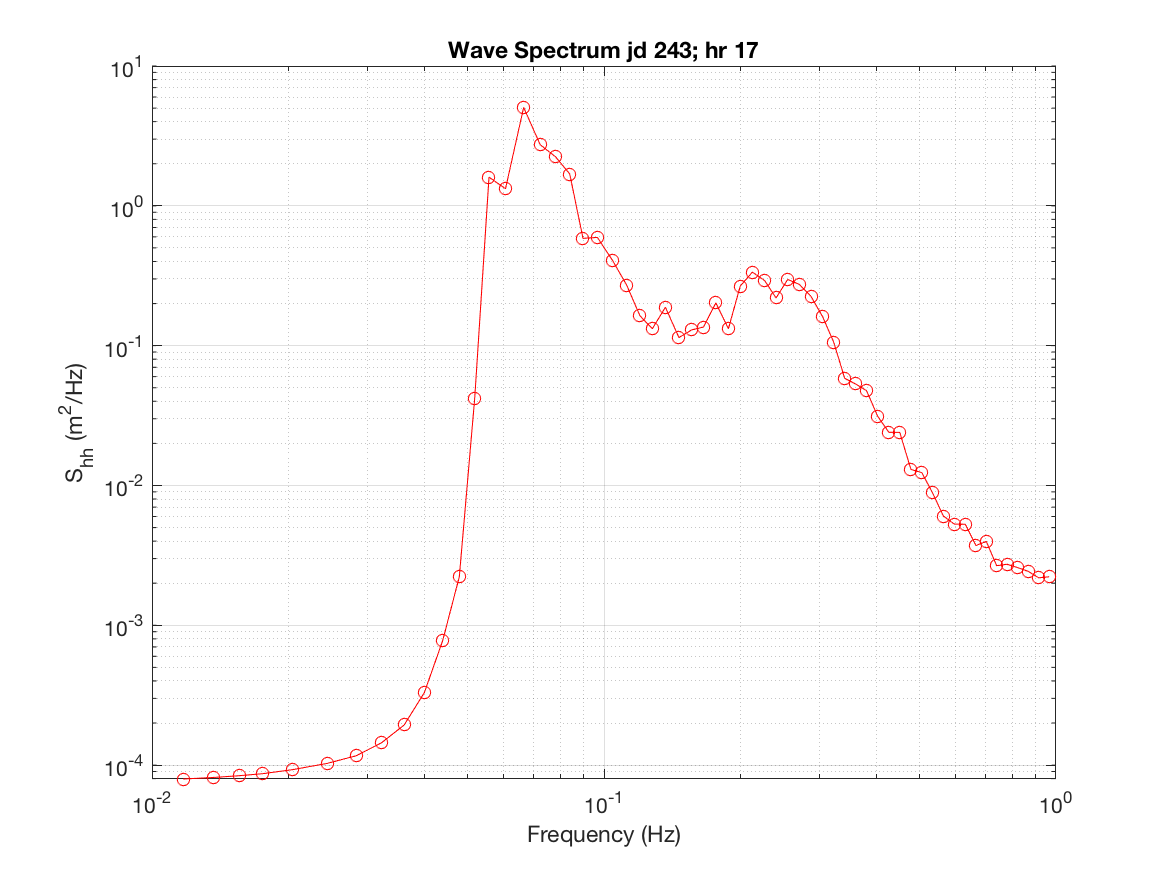
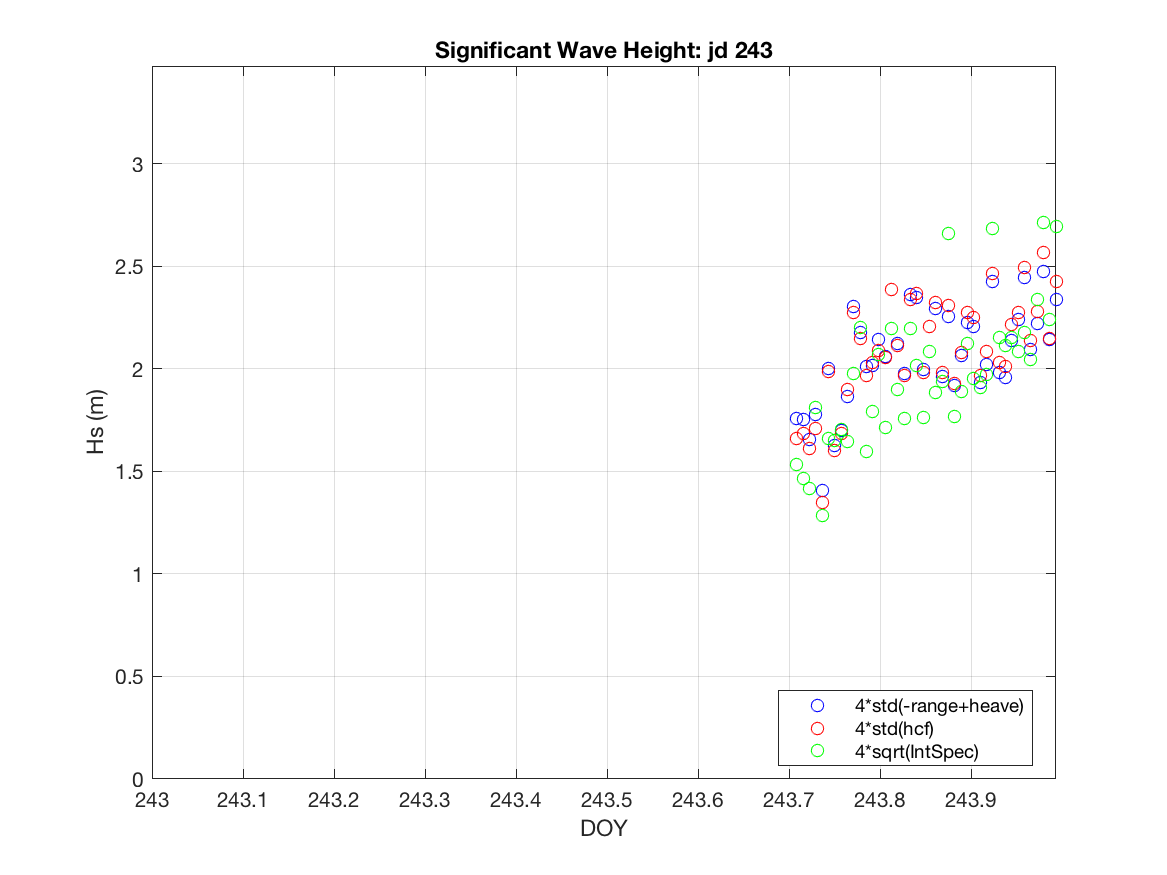
At the ship, we began feeling the swell from Jebi, its center something like 800 km to the northeast. Figure 15 shows a one-dimensional wave spectrum from tne NOAA laser range finder. The large peak at low frequency is the swell from Jebi, while the smaller one represents the waves driven by the local westerlies, which had been increasing in amplitude for perhaps a day. The Wave and Surface Current Monitoring System (WAMOS) display on board the ship shows a spectrum with amplitude plotted as a function of both period and two-dimensional direction, and this showed a single spike to the northeast, Jebi's direction, with a period around 15s (Figure 16). The wind wave peak was not visible at all on this display, apparently because that display used a linear scale and this lesser peak was below the lowest contour interval. Visually, we could discern the Jebi swell from the upper decks, peaks moving opposite to the wind and the wind-driven waves. Note that the significant wave heights reported by WAMOS are inaccurate. Significant wave heights measured by the NOAA laser range finder climbed as the wind-driven waves increased their contribution (Figure 17), at least as of the later part of the day when data on this quantity were available from the NOAA instrument.