September 1, 2018
Sheared Convection in Strengthening Low-Level Westerlies
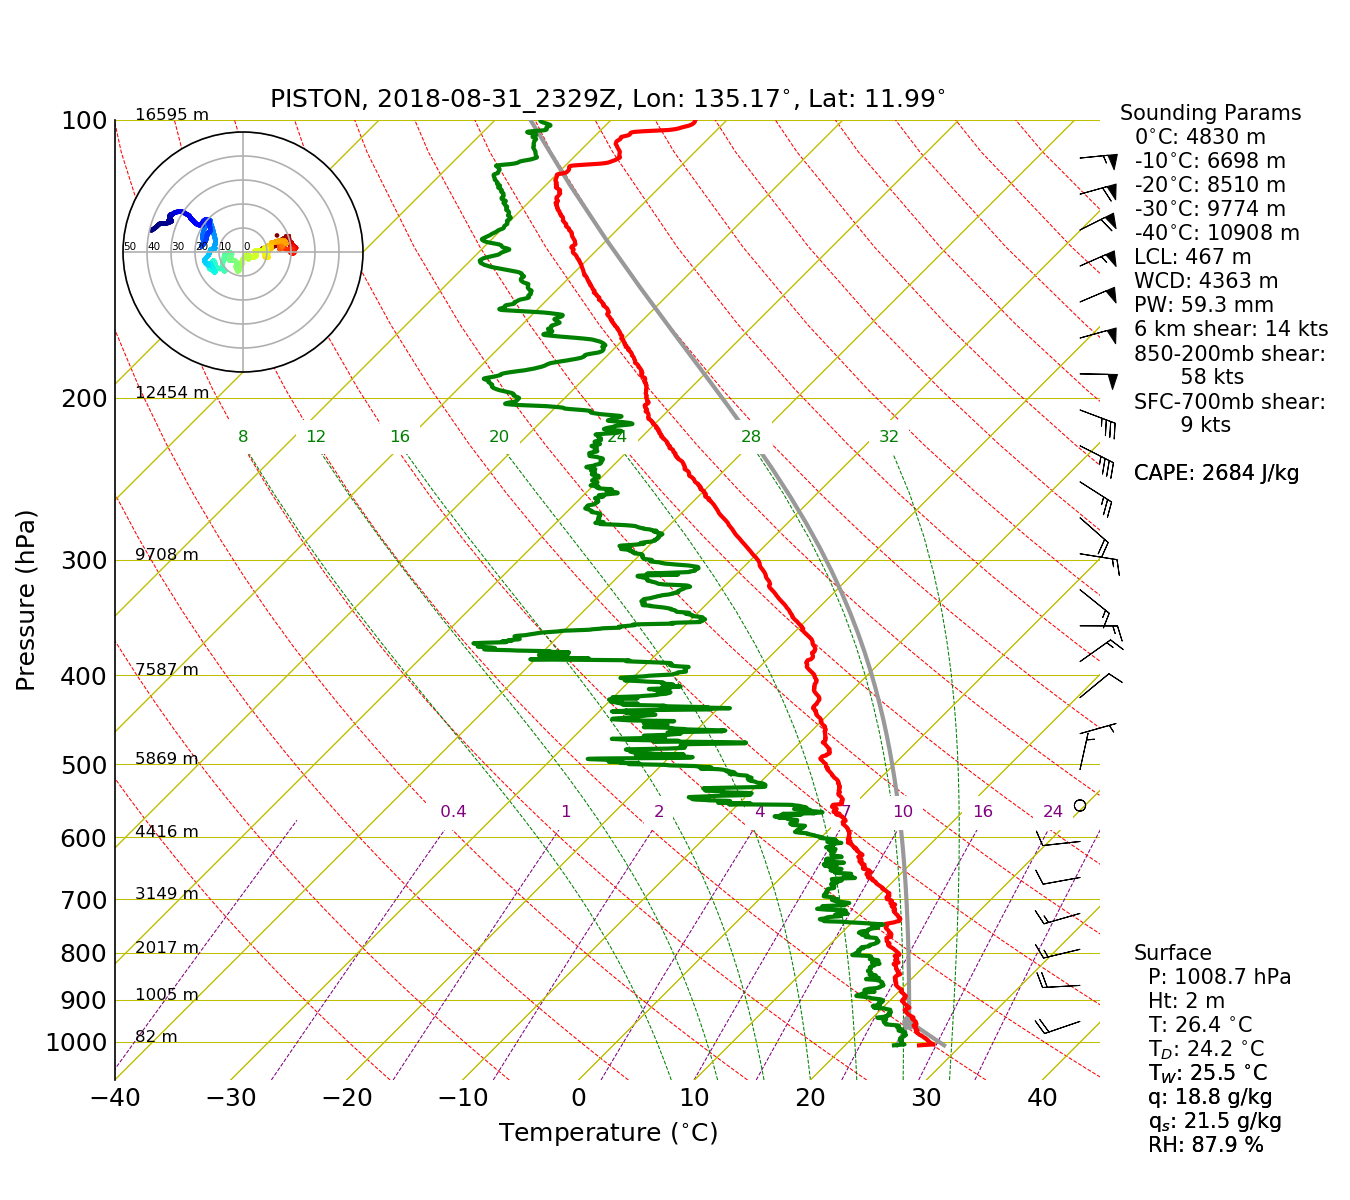
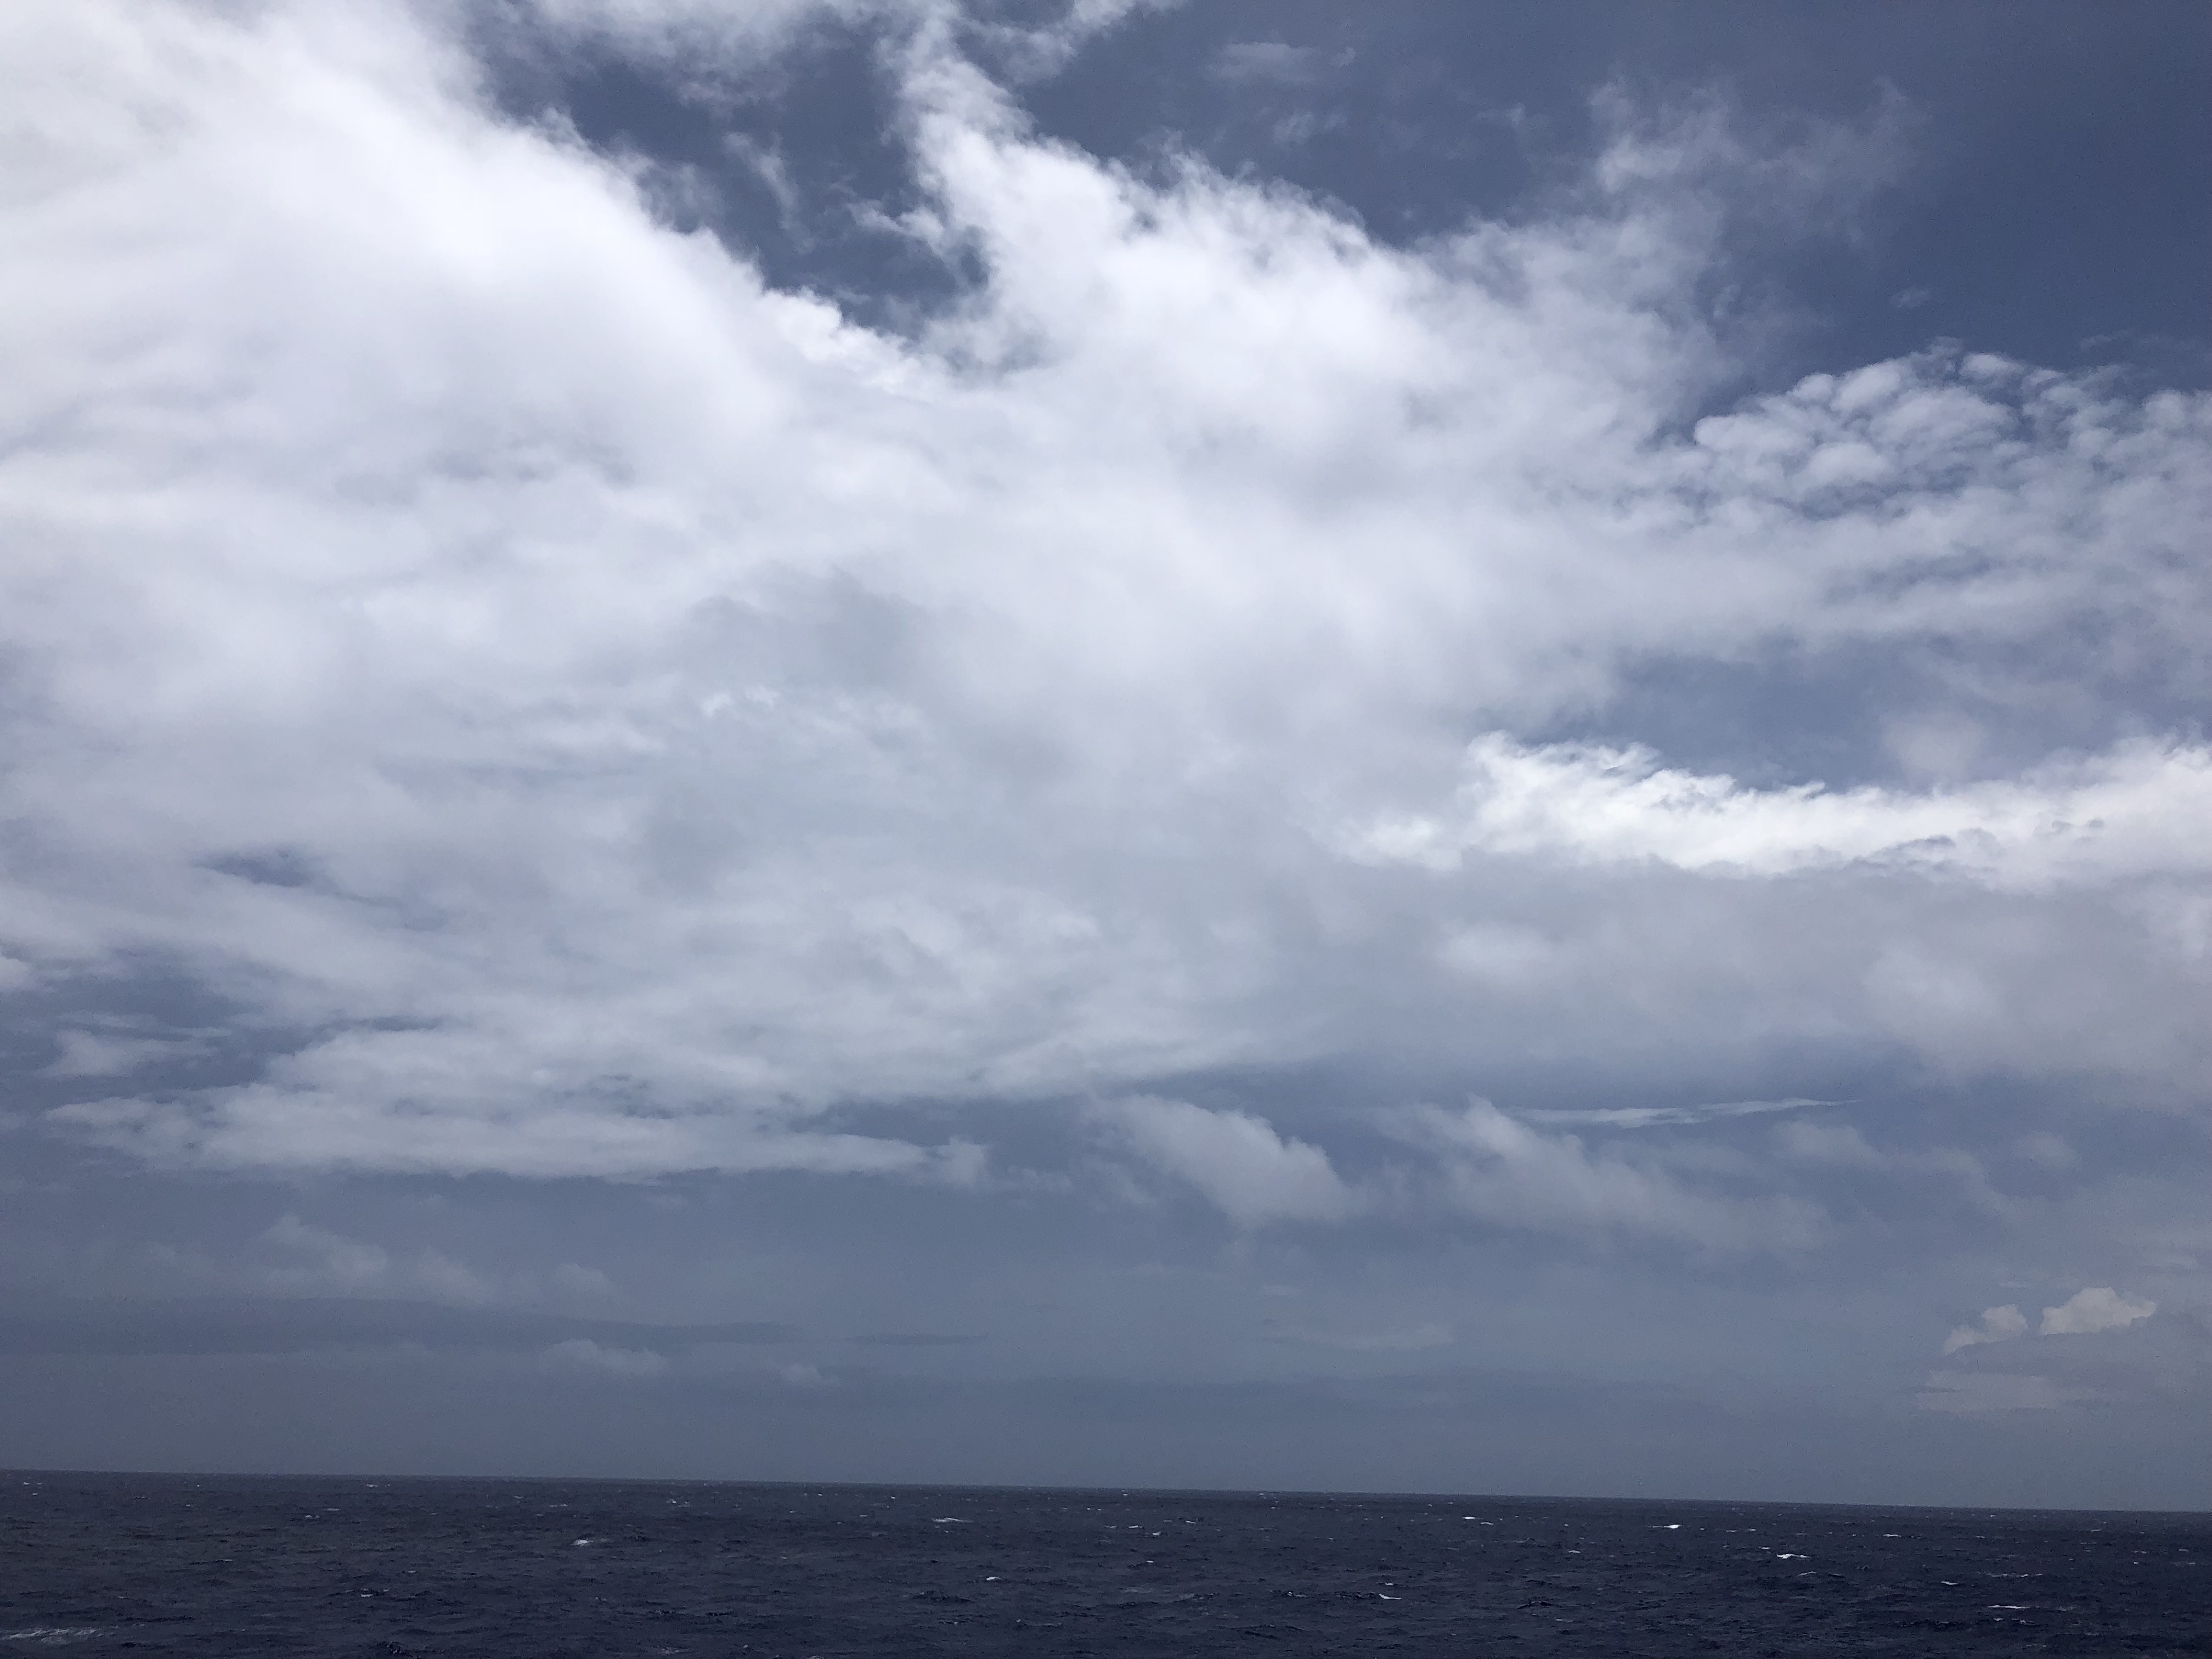
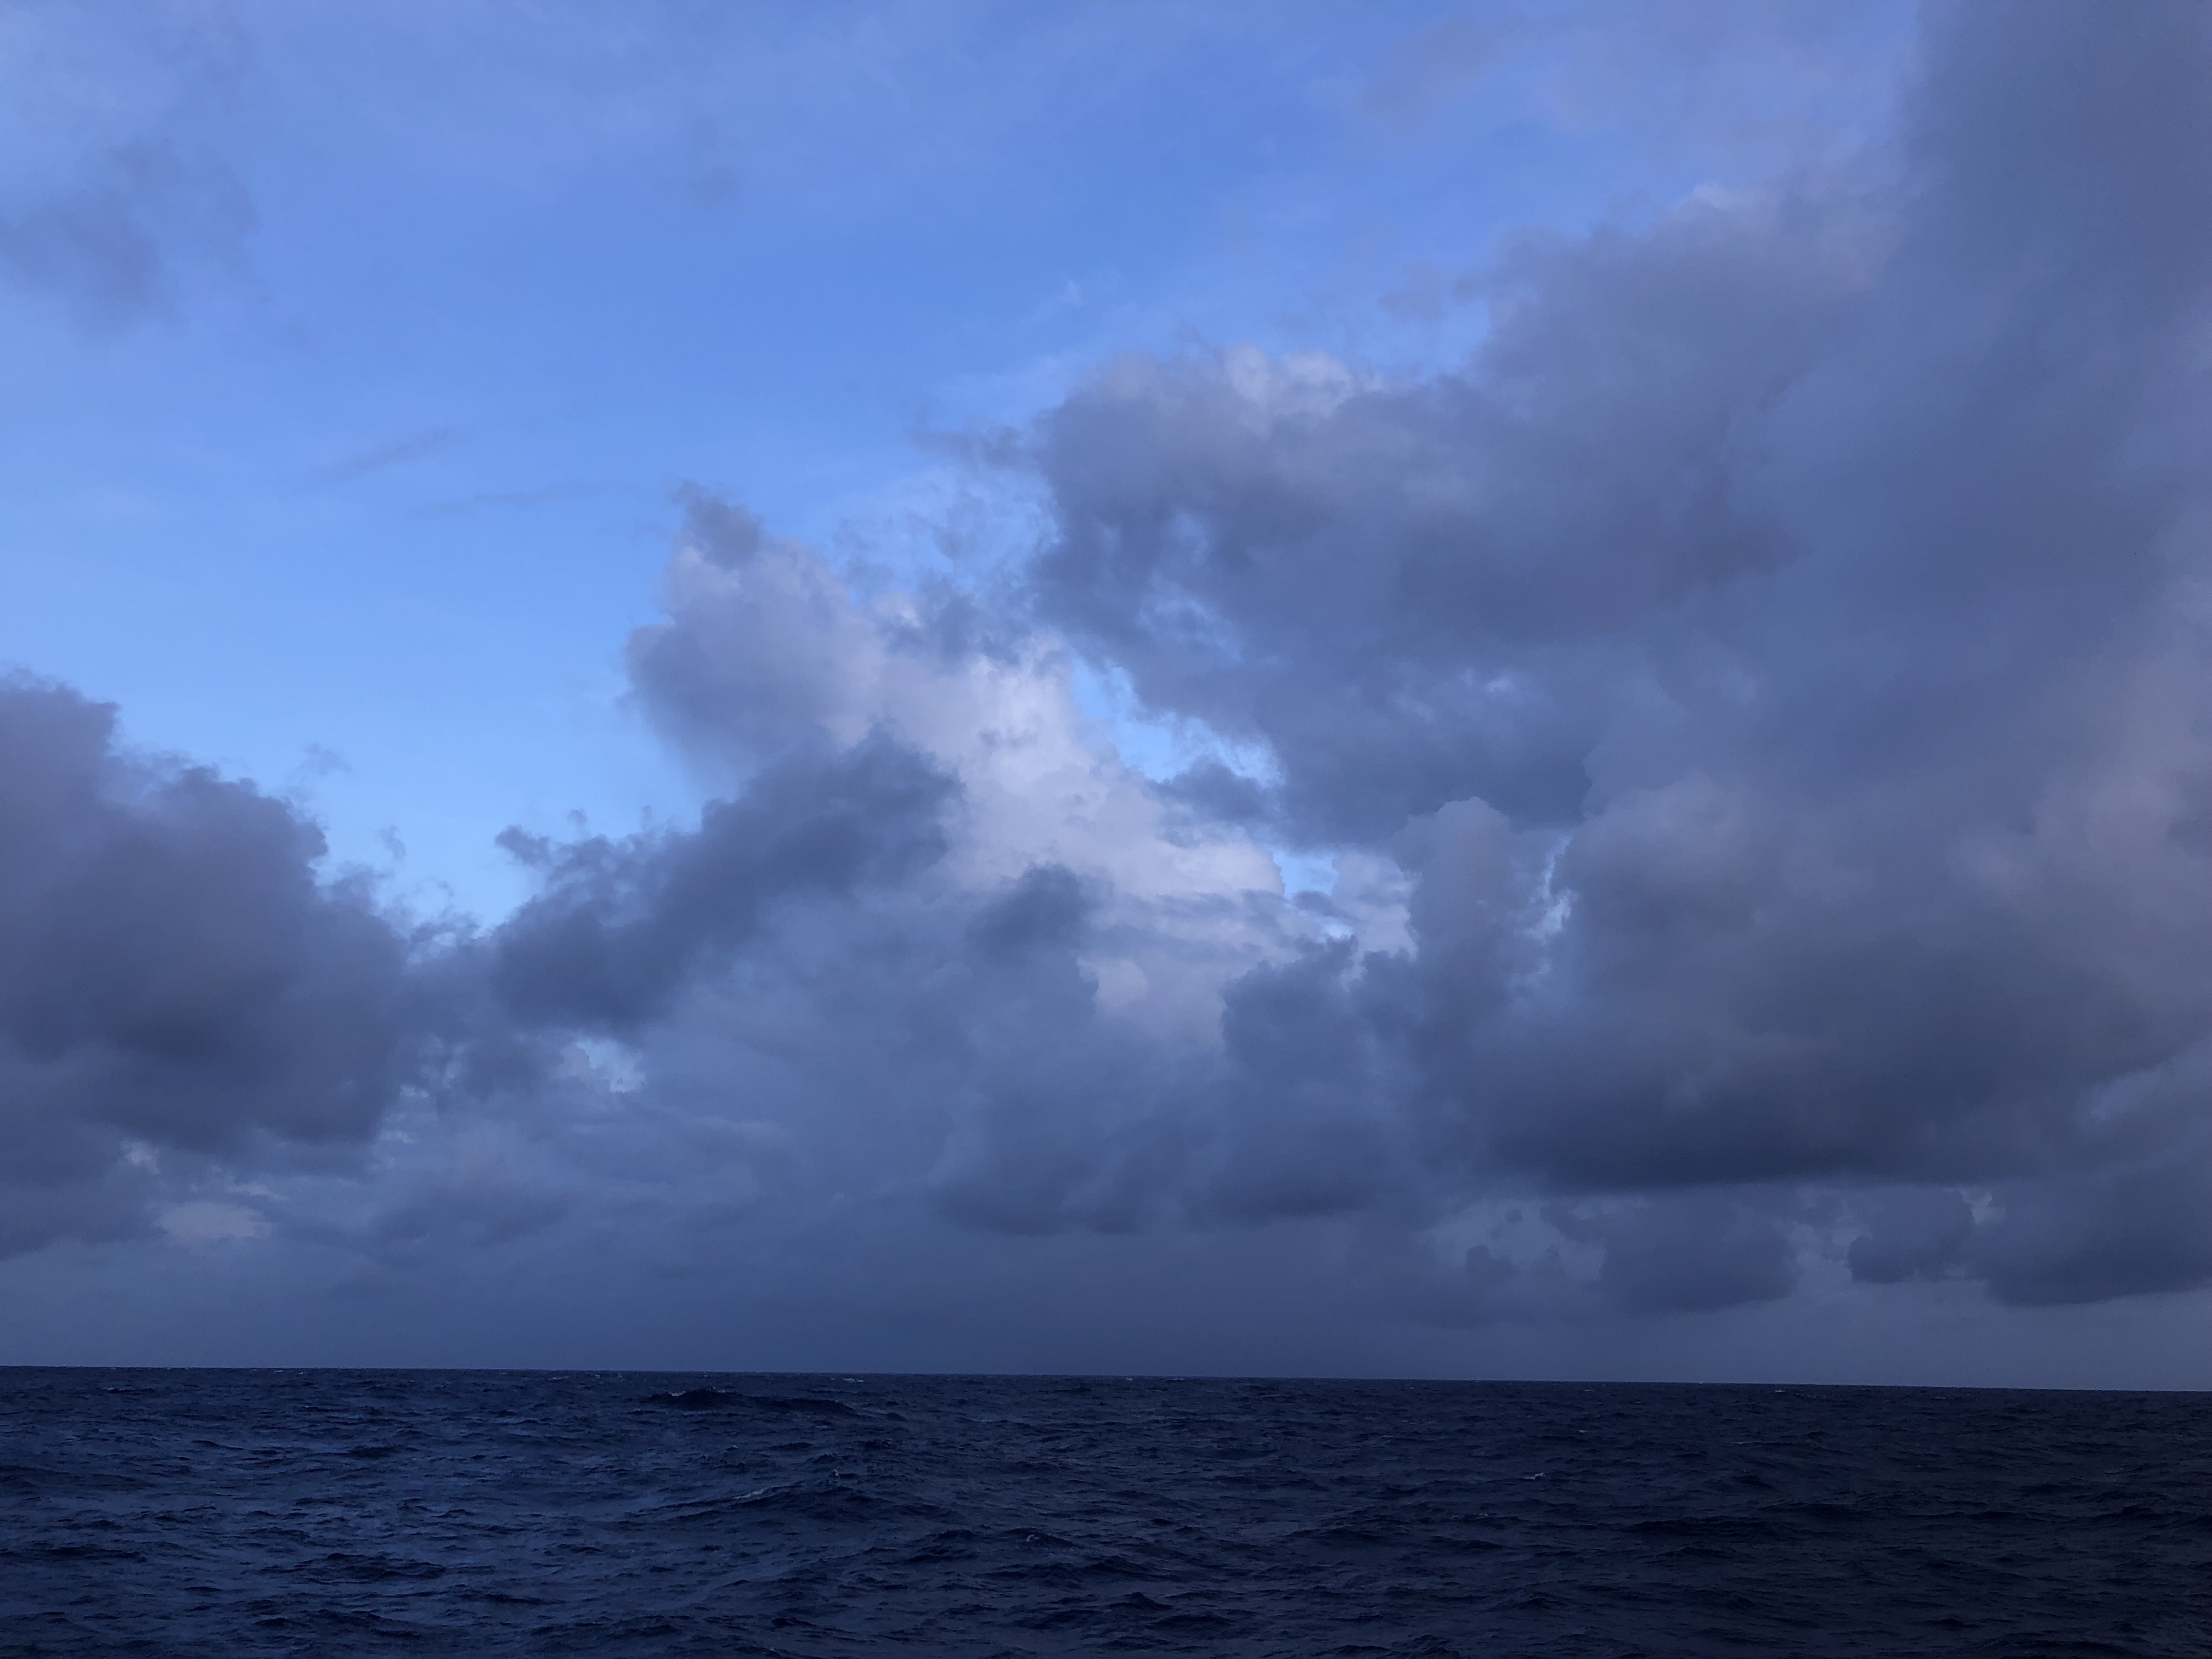
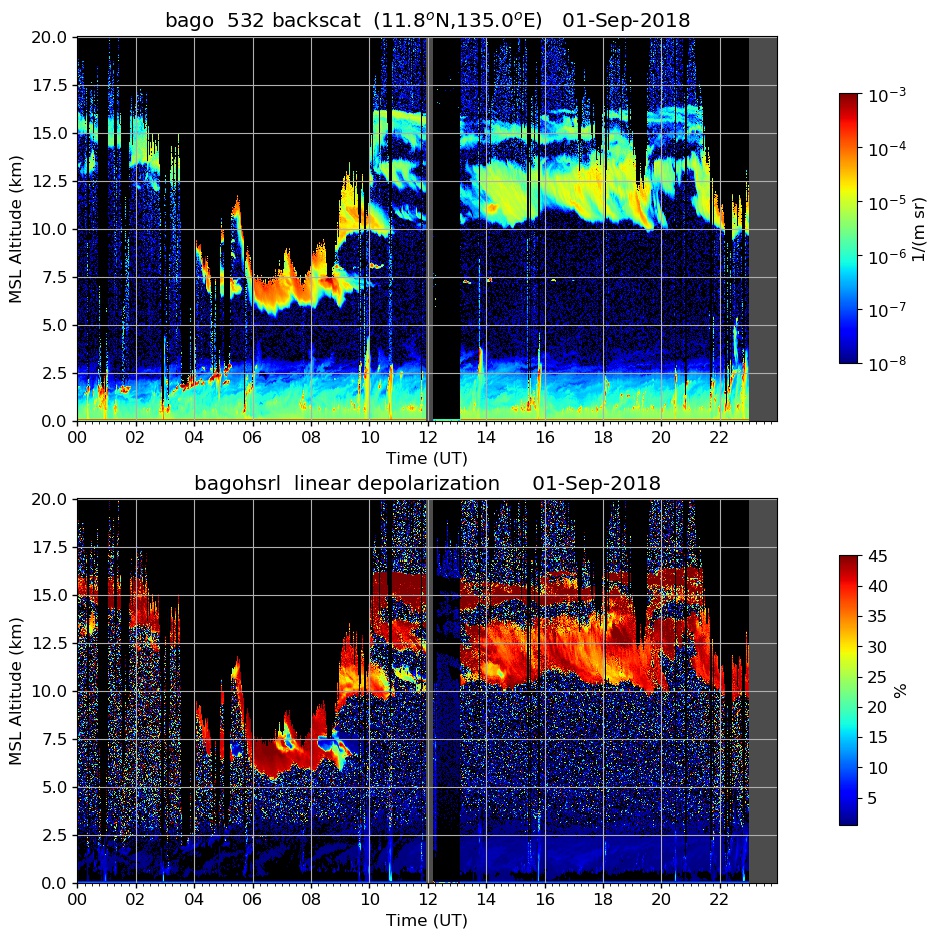
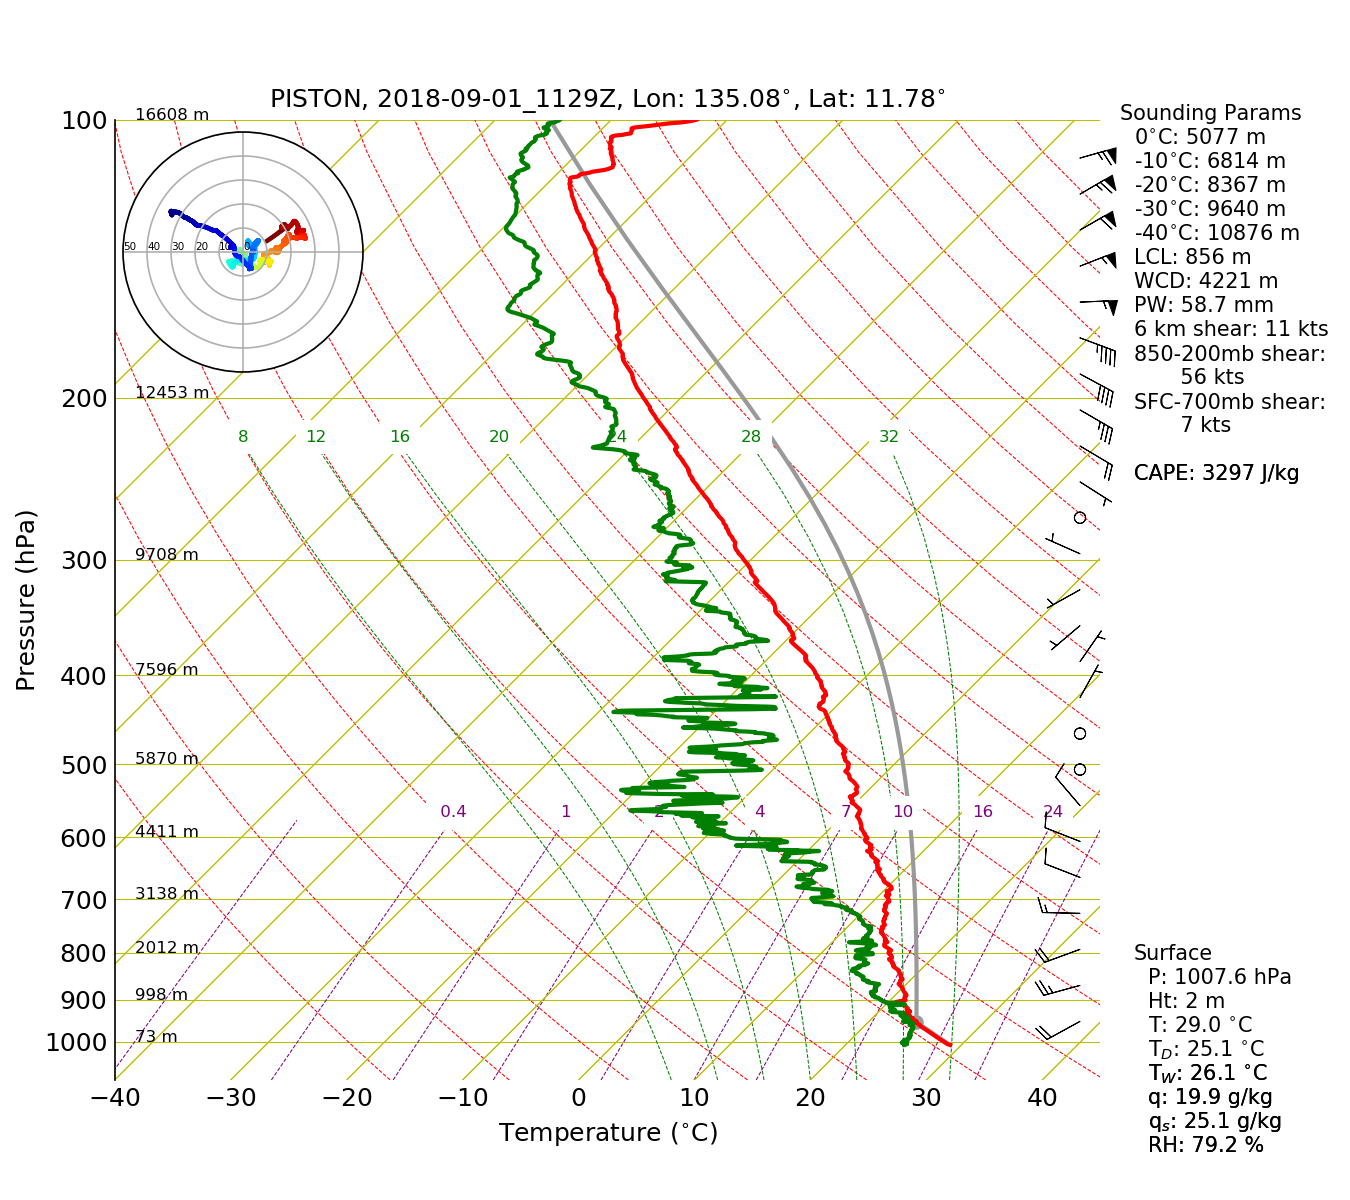
Scott Powell, Timothy Lang, Eric Maloney, Adam SobelLow-level westerlies continued to strengthen today. The 00 UTC sounding (Figure 1 indicated 20 kt west-southwesterlies near the surface (and what appeared to be a something like a trade inversion near 750 mb), and the 06 UTC GFS forecast (Figure 2) placed 20–25 kt westerlies at 850 mb over the ship. The strong westerlies were positioned to the south of Super Typhoon 25W and an apparent hint of an anticyclone near the equator around 140°E. Accompanying the strong low-level westerlies near the latitude of the ship were zonally oriented strips of enhanced relative vorticity. The 0110 UTC Himawari-8 visible image (Figure 3) showed only shallow cumuli over much of the West Pacific near the ship; however, a small band of zonally oriented convection is also seen near 11.5°N between 132°E and 135°E. This was where the ship was located. Farther east, a large complex of convection left behind by 25W was moving westward and would have a greater impact on the ship on 2 September. Interestingly, while much of the region around the ship appeared via satellite to be sunny, conditions were overcast at the ship for most of the afternoon (03–09 UTC). This was captured by photos of clouds (Figure 4) and the HSRL backscatter (Figure 5), which indicates presence of mid-level cloud with a base around 6–7 km between 04 and 10 UTC. In the second half of the day (or night at the ship), high cirrus remained above 10 km, and the occasional shower passed through.
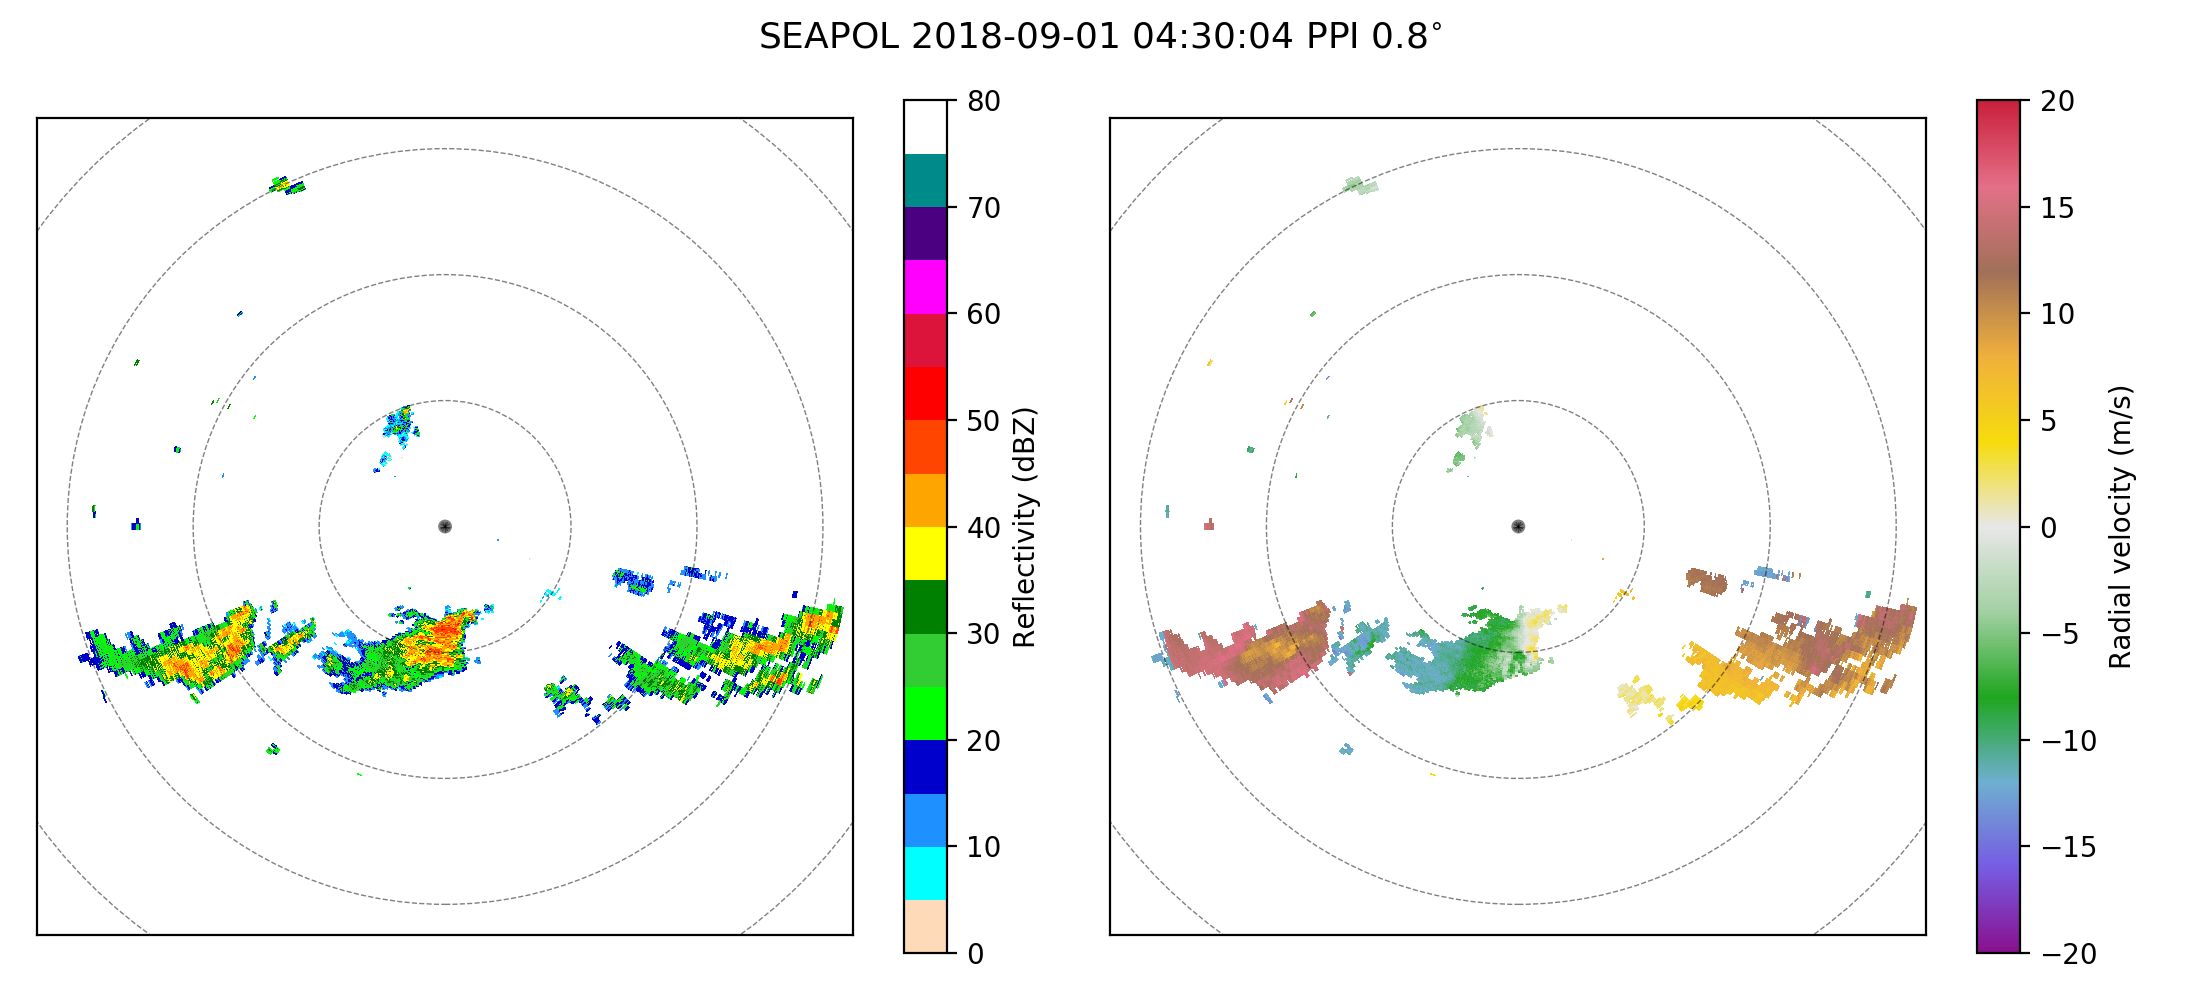
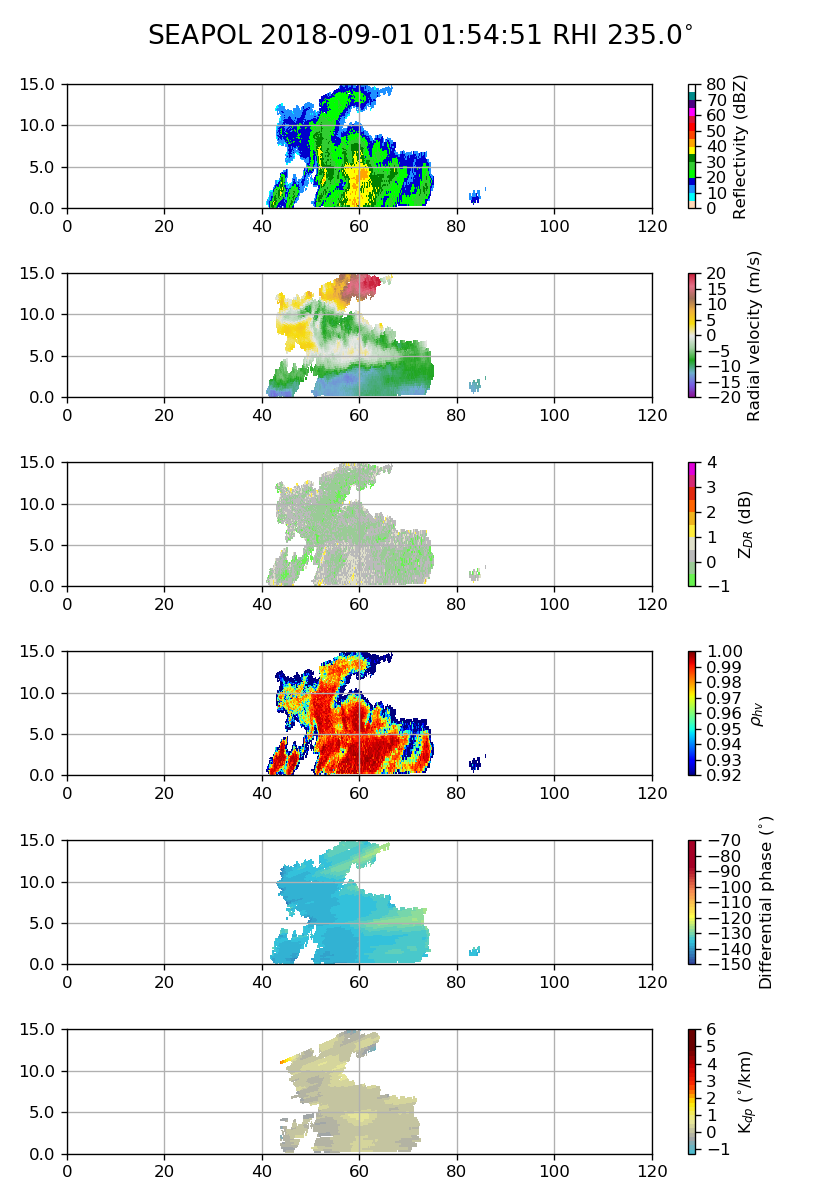
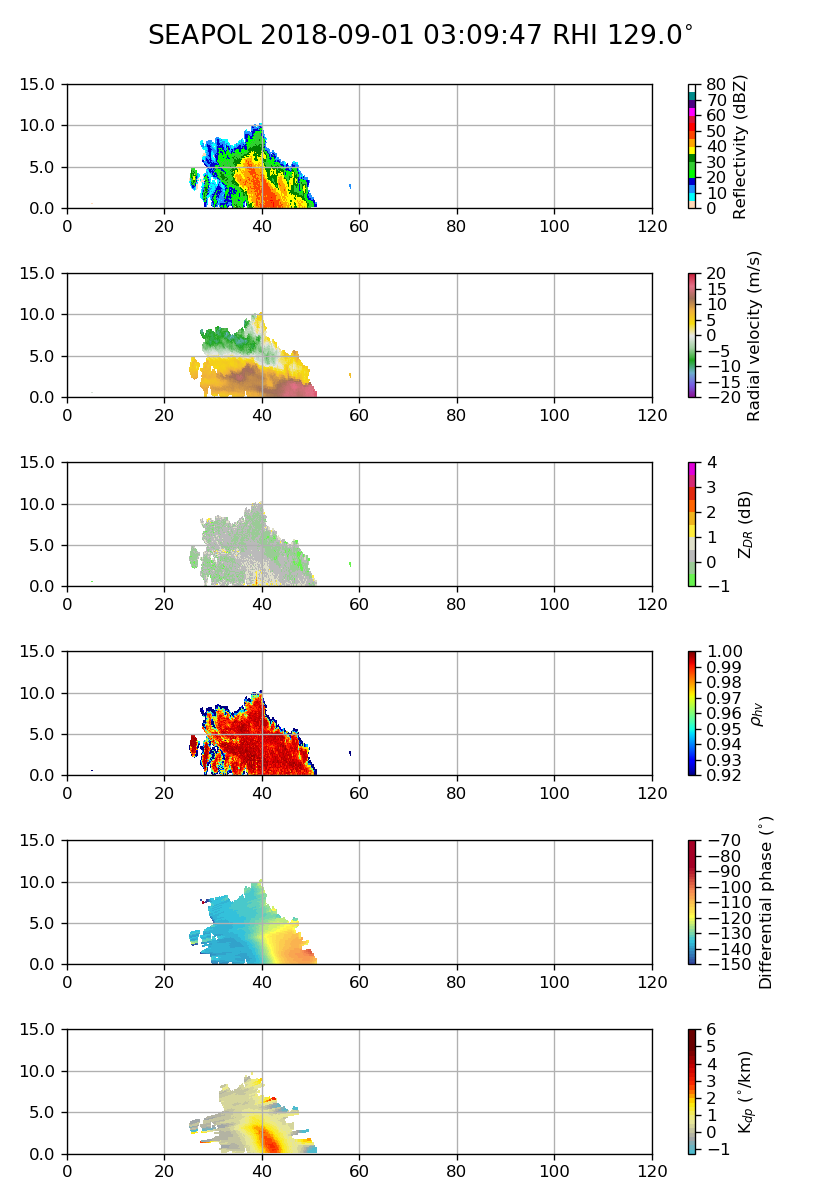
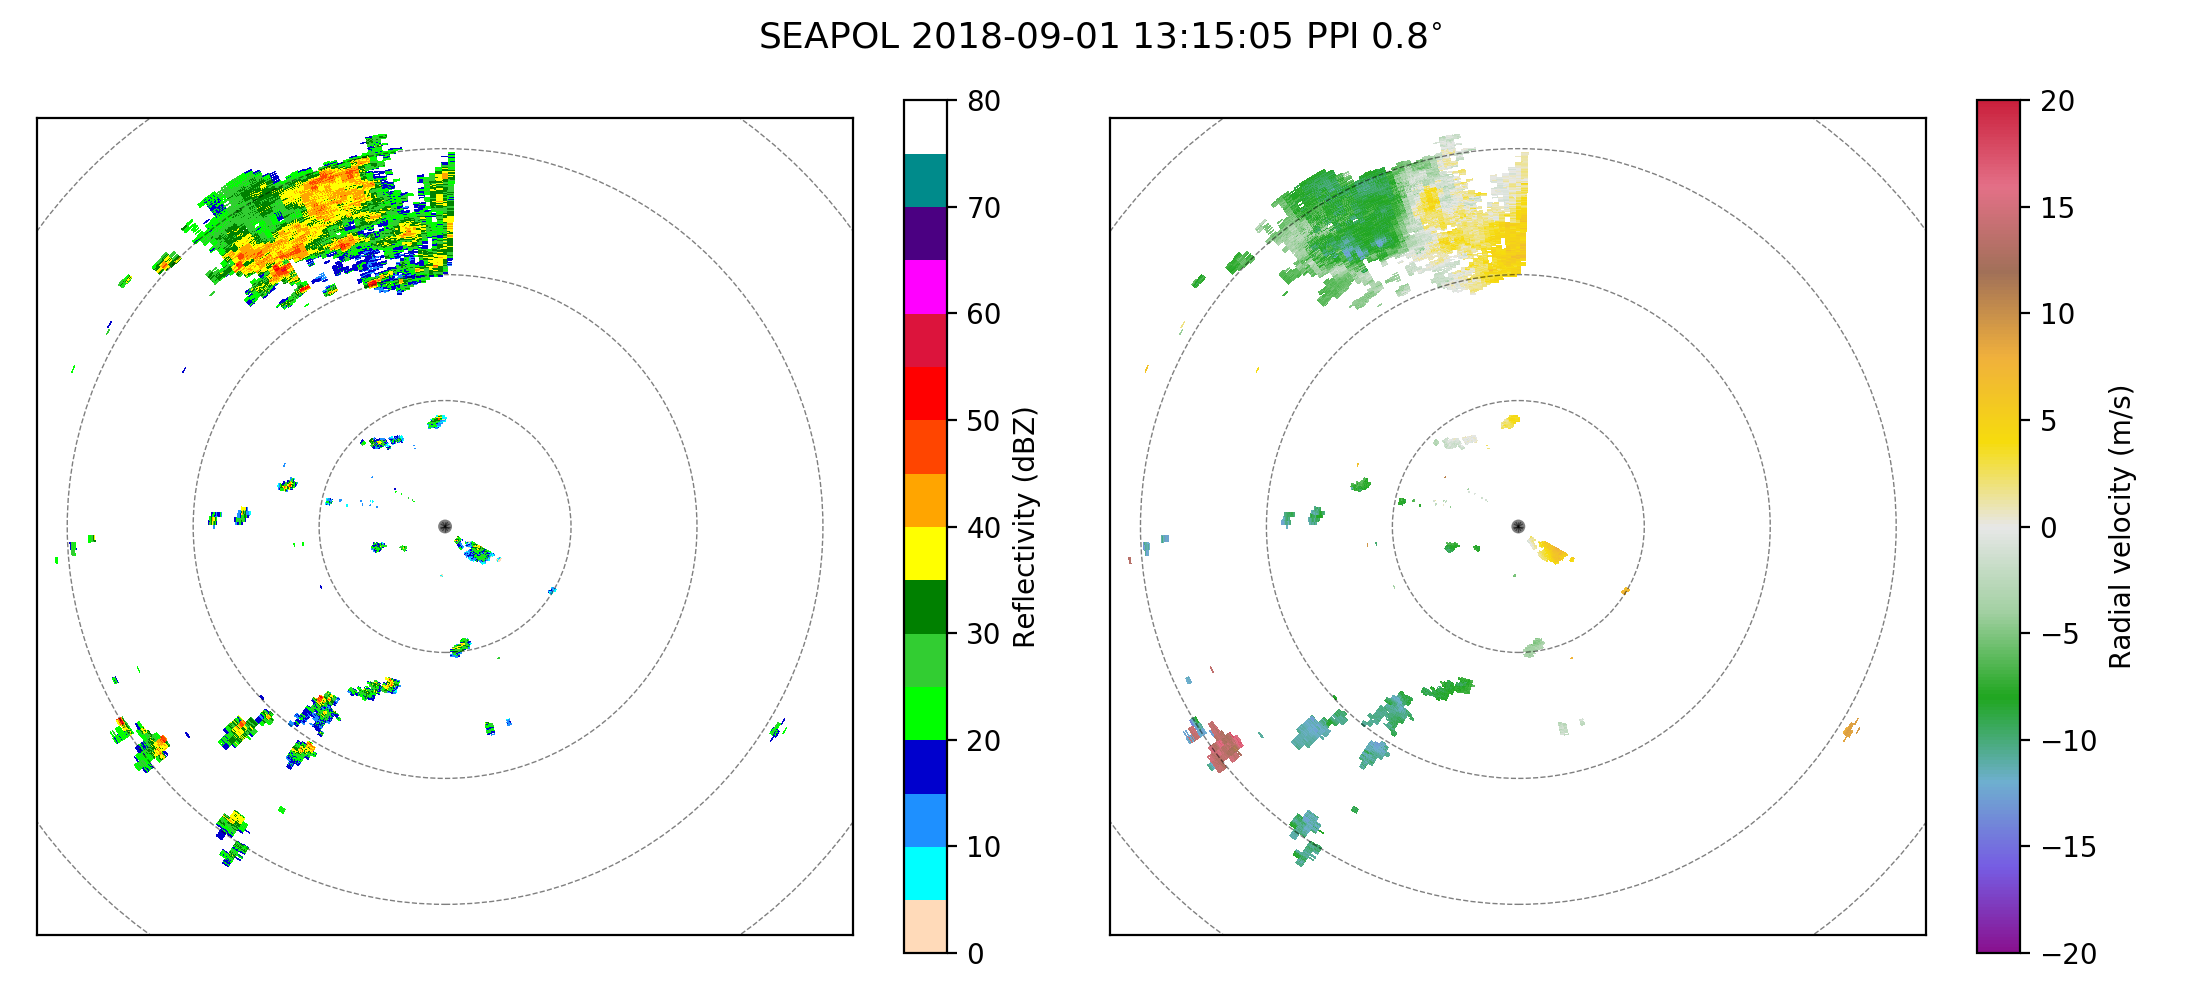
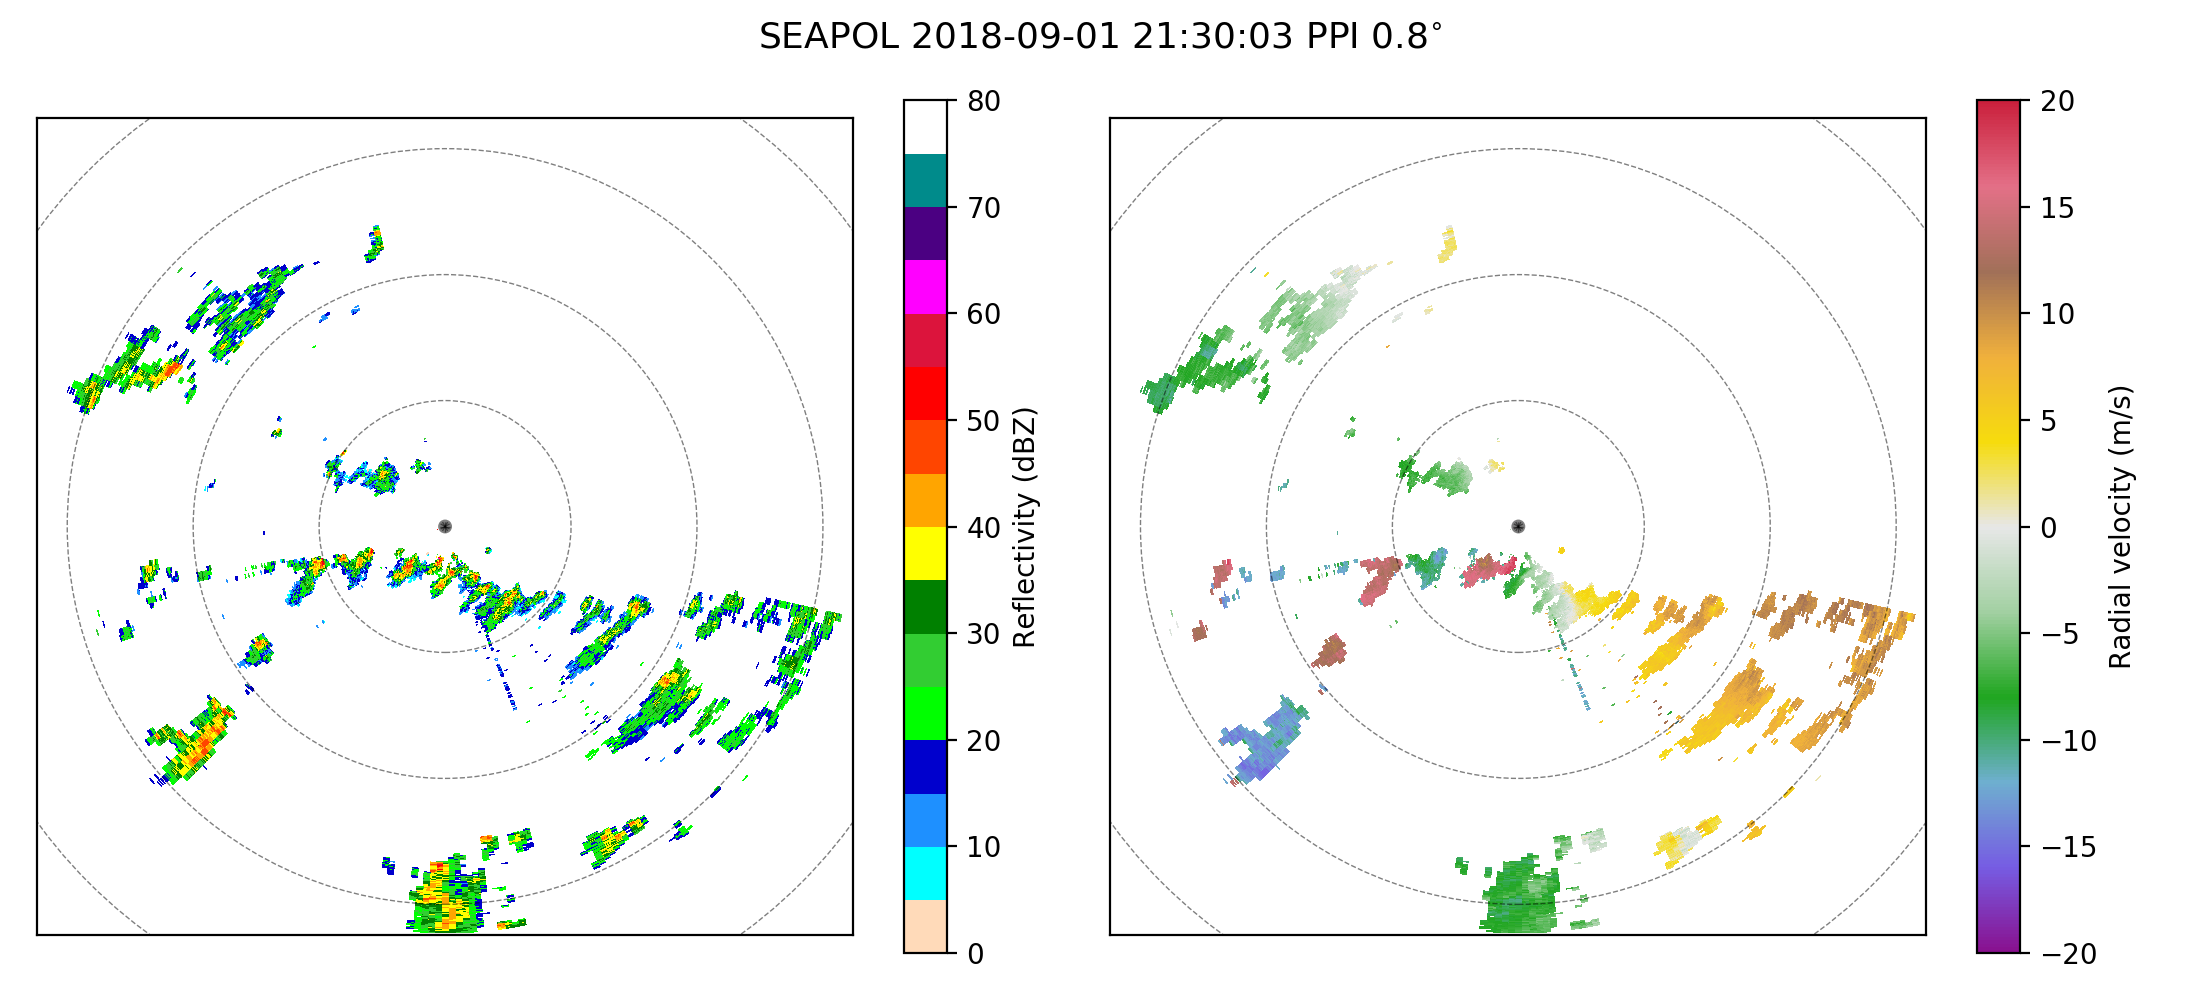
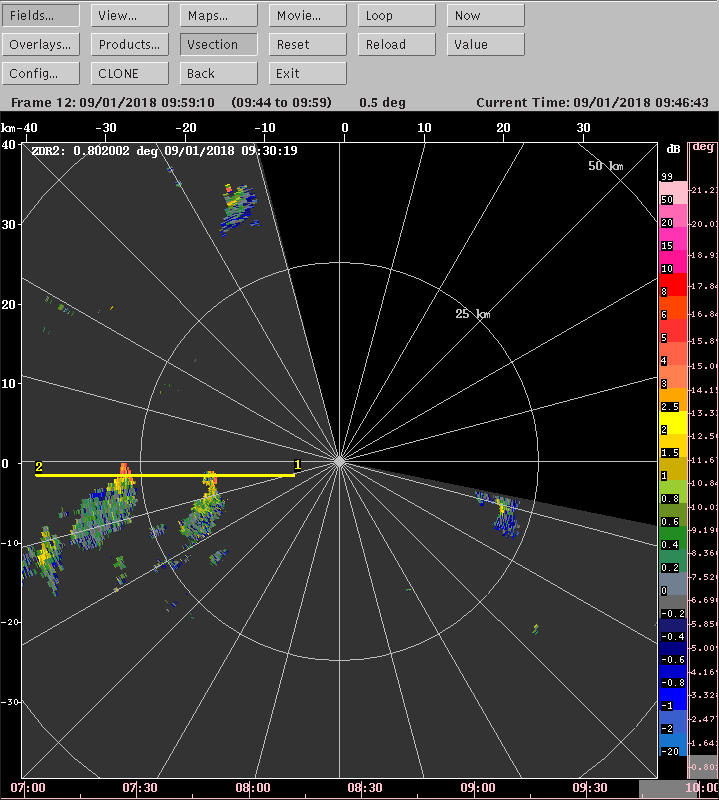
The morning view from SEAPOL was of several convective echo regions with small stratiform areas extending toward their west. Figure 6 shows a 0.8° scan of reflectivity (ignore the velocities, which were incorrectly unfolded, on the right) at 0430 UTC. At the time, three discrete small convective complexes were present. They essentially followed the same track from west to east just south of the ship. Some of the convection occasionally reached 15 km (Figure 7), and the convection exhibited a clear westward tilt with height as seen in the example RHI taken to the east of SEAPOL at 0309 UTC (Figure 8). Convection continued throughout the day in the SEAPOL domain. The southern portion of an MCS skirted the northern part of the domain as seen in Figure 9 at 1315 UTC. Combined with the convection that occurred just south of the radar in the morning, these features contributed to most of the radar-estimated rainfall, which is illustrated in Figure 10. In some locations south of the ship, over 100 mm of rainfall was estimated to have fallen--mostly associated with the morning convection. The 12 UTC sounding (Figure 11) was similar to all the others during the day, and total precipitable water in excess of 57mm was sampled all day. A line of convection approached the ship after 2200 UTC; it is seen in Figure 12 to the south of the ship before arriving. The line was associated with several small convective cells that penetrated no higher than about 5 km. However, a distinct temperature drop and temporary wind shift were associated with the line (Figure 13). By 2240 UTC, two zonally oriented bands of convection had developed along about 11°N and 13.5°N (Figure 14). The southern of the two bands will be discussed in more detail for the 2 September summary.
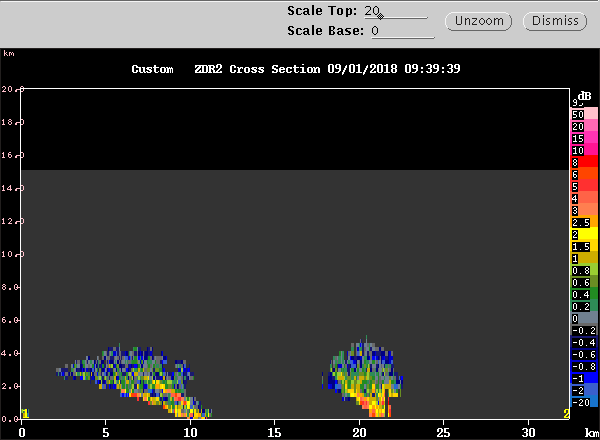
Again, many high ZDR cores were observed in the lower parts of young convective echoes. This is apparently a common occurrence. A particularly good example is displayed in Figure 15. At the time (0939 UTC), much of the southern part of the domain was comprised of isolated convective cells with a reflectivity and ZDR core on their northeastern edges. Figure 15 is a zoomed in example of two such cells. Both cells were quite shallow--only reaching 4 km--and both had small narrow (tilted) columns of high reflectivity and ZDR. Some of the reflectivities and ZDRs, respectively, exceeded 50 dBZ and 3dB.