September 2, 2018
Two Convective Squall Lines Accompanied by Stratiform
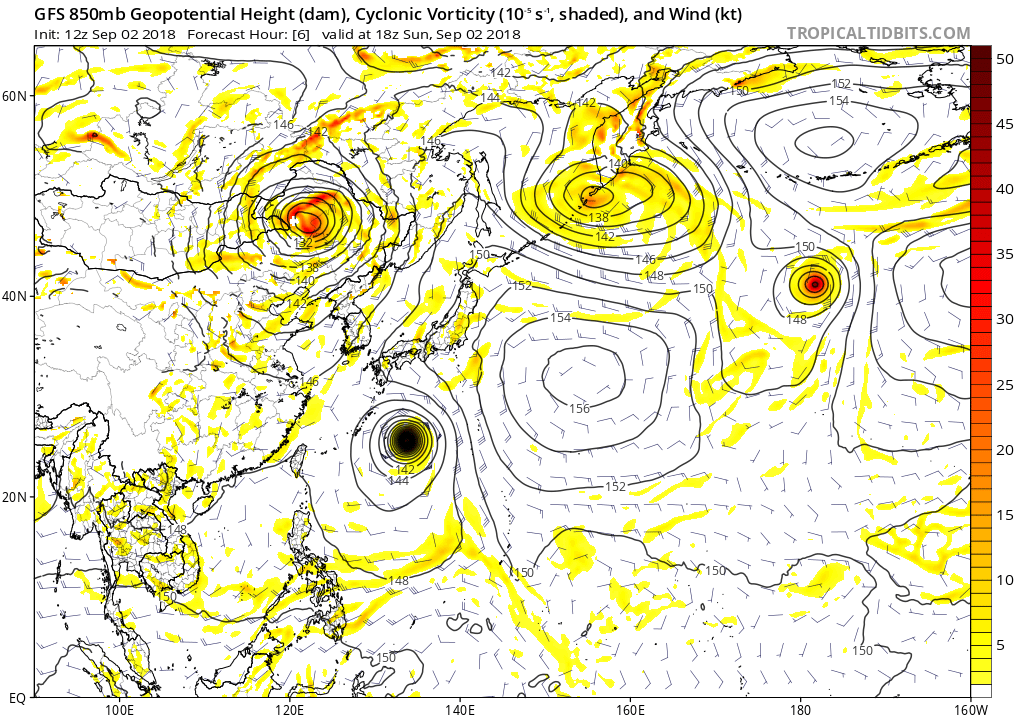
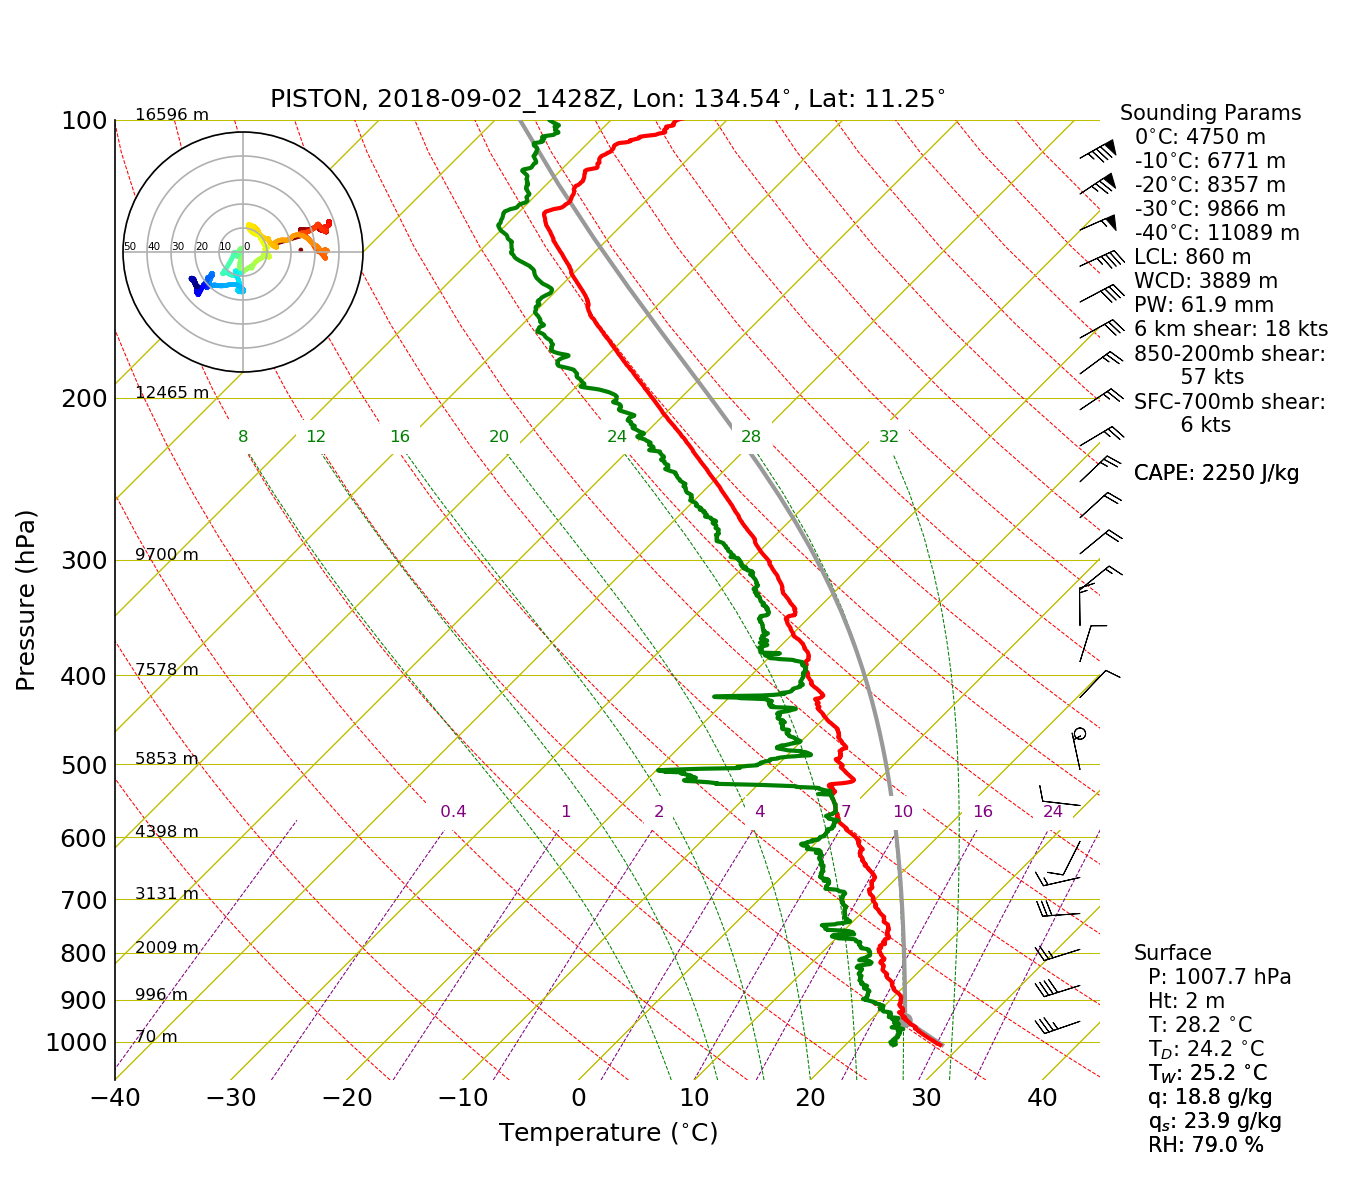
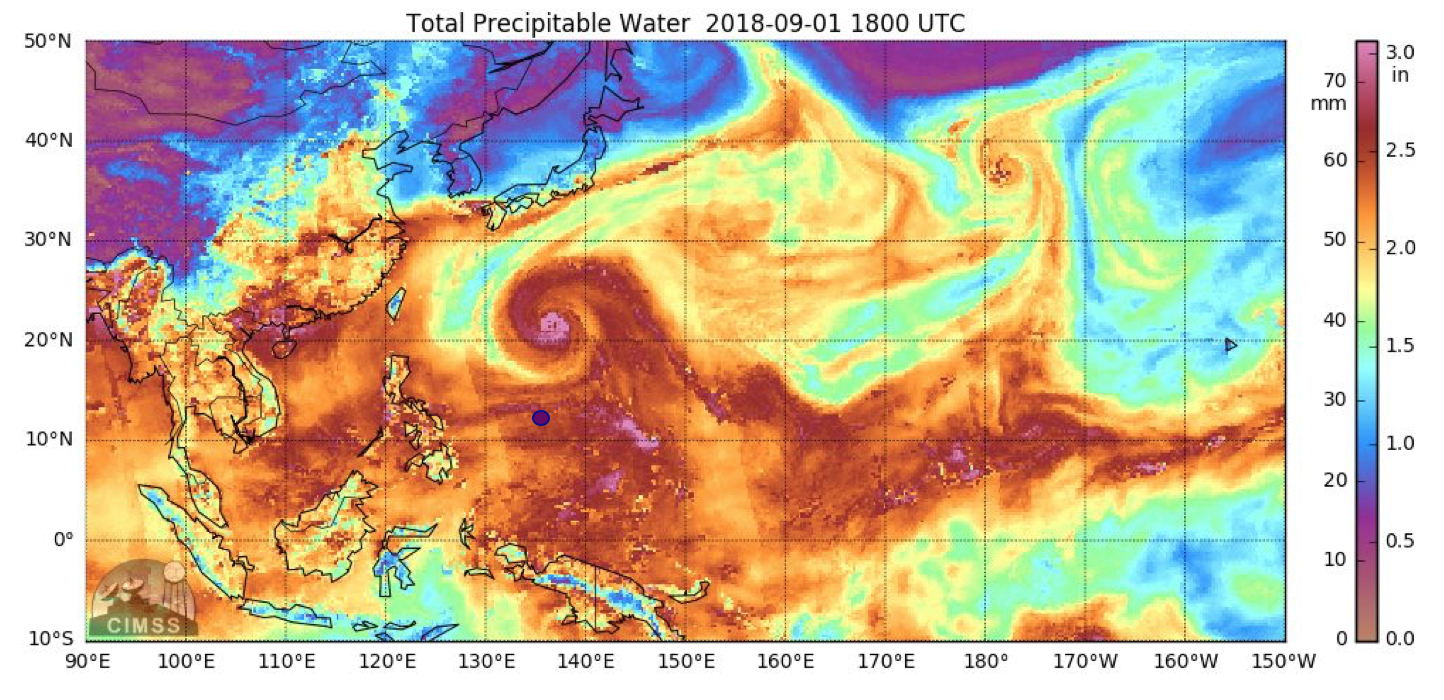
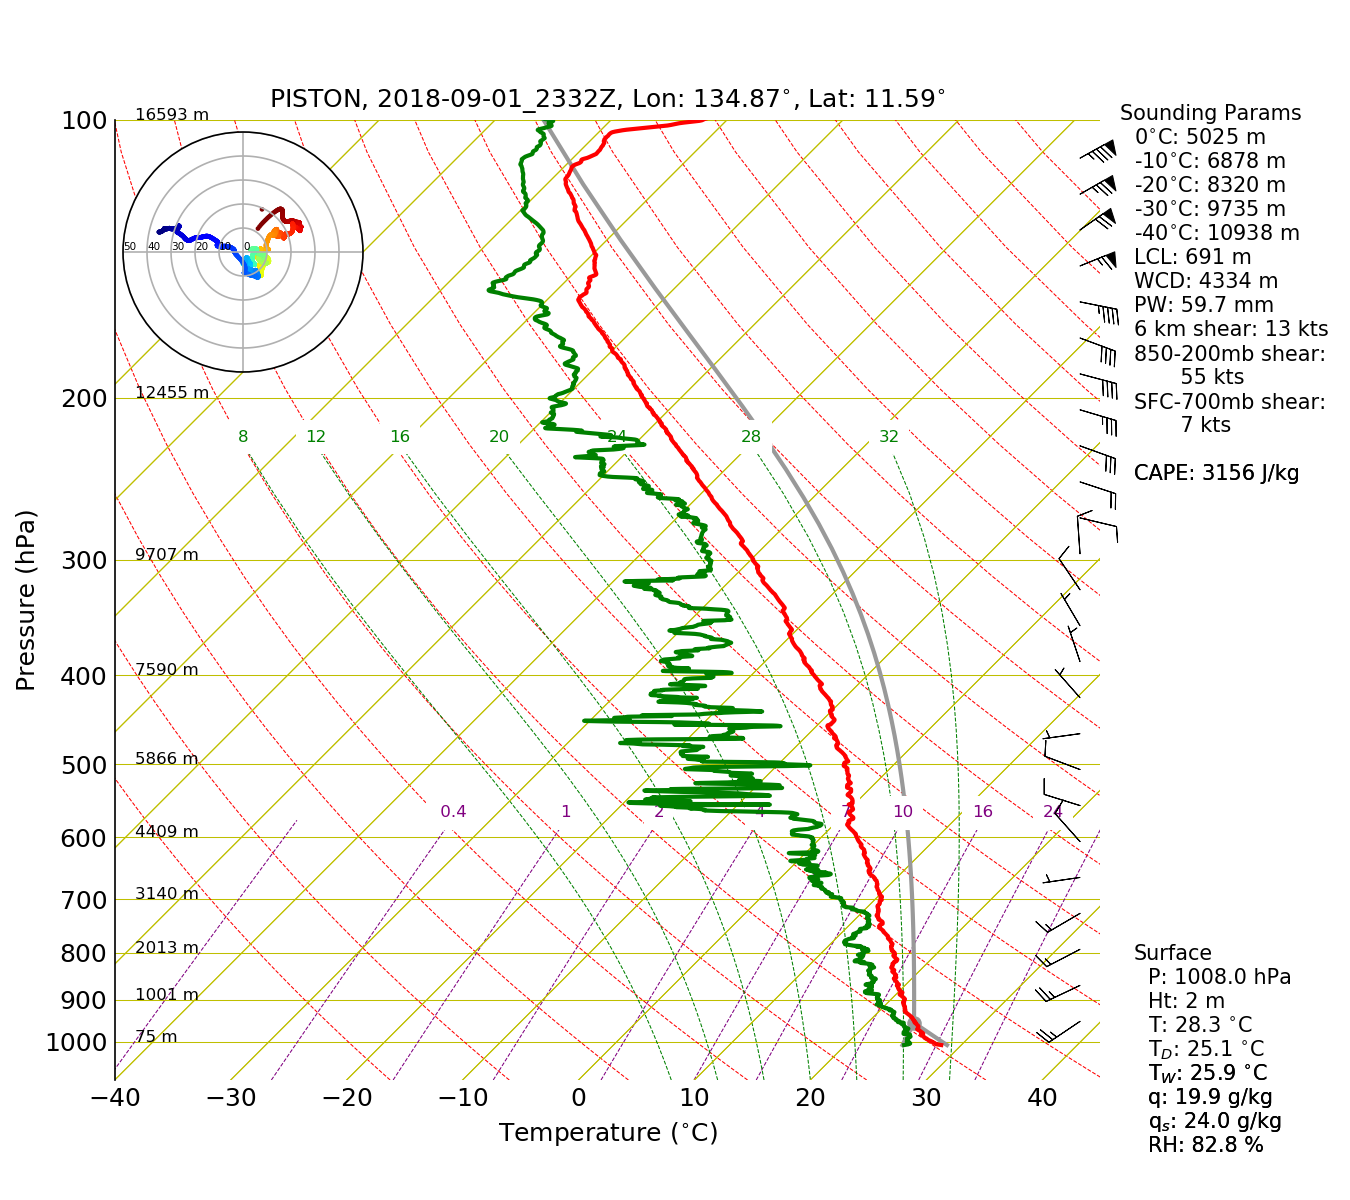
Scott Powell, Timothy Lang, Janet Sprintall, Eric Maloney, Adam SobelStrong low-level westerlies continued at the ship's location on 2 September. The westerly jet was situated between northward moving Typhoon 25W, and an equatorial feature that might have been a westward propagating mixed Rossby gravity wave. Both features are seen in the GFS 6-hour forecast of 850 geopotential heights and winds in Figure 1, which depicts 20-30 kt westerlies near the ship. The 15 UTC rawinsonde (sounding in Figure 2) detected winds of 40 kts at 850 mb. West-southwest winds turning more westerly through the day were 30-35 kts at 950 mb for most of the day. Surface winds exceeded 20 kts at the ship for essentially the entire day. The low-level westerlies extended from well west of the Philippines and advected moist air with TPW well in excess of 55 mm into the area (Figure 3). The westerlies extended to about 140°E, where they met with weak flow around a cyclonic circulation centered near 155°E. The result was an axis of convergence along about 140°E. The location of convergence can be approximated by the eastern edge of cold cloud tops in the IR image from 2110 UTC. The deep convection was associated with the same area of storms that was located farther east on 1 September. The deepest convection on the 2nd was located between 8°N–15°N and 133°E–138°E.
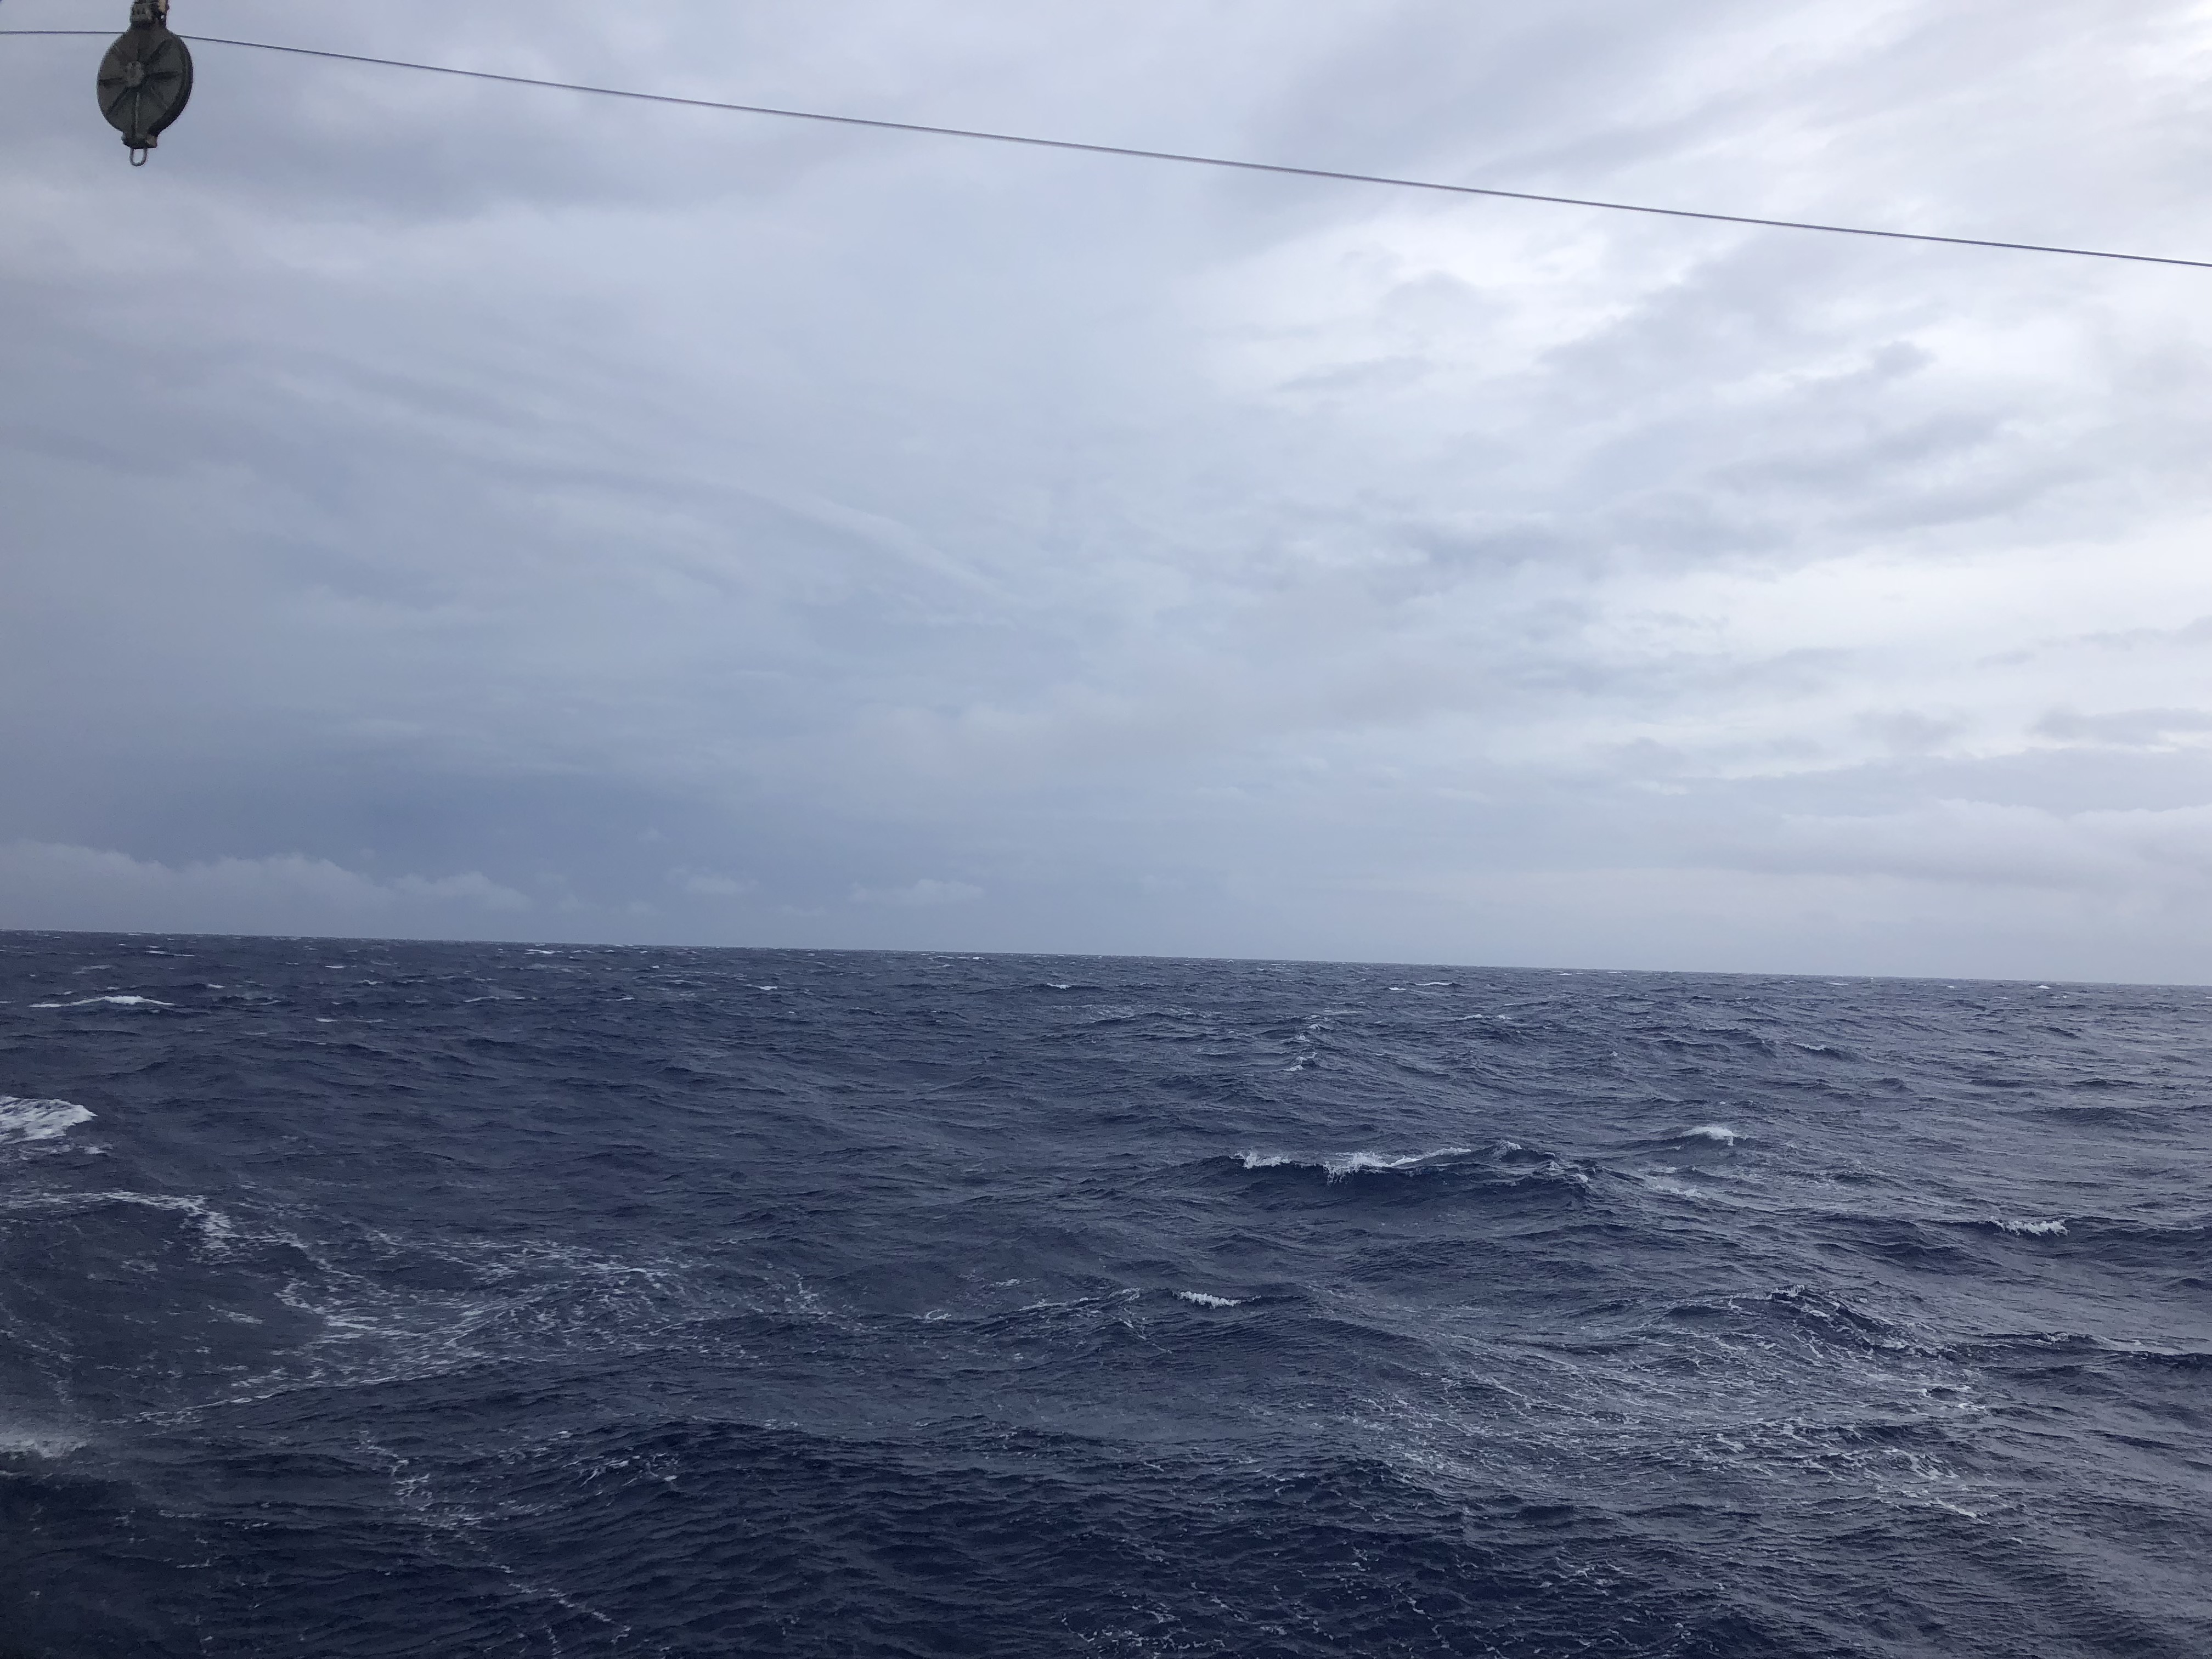
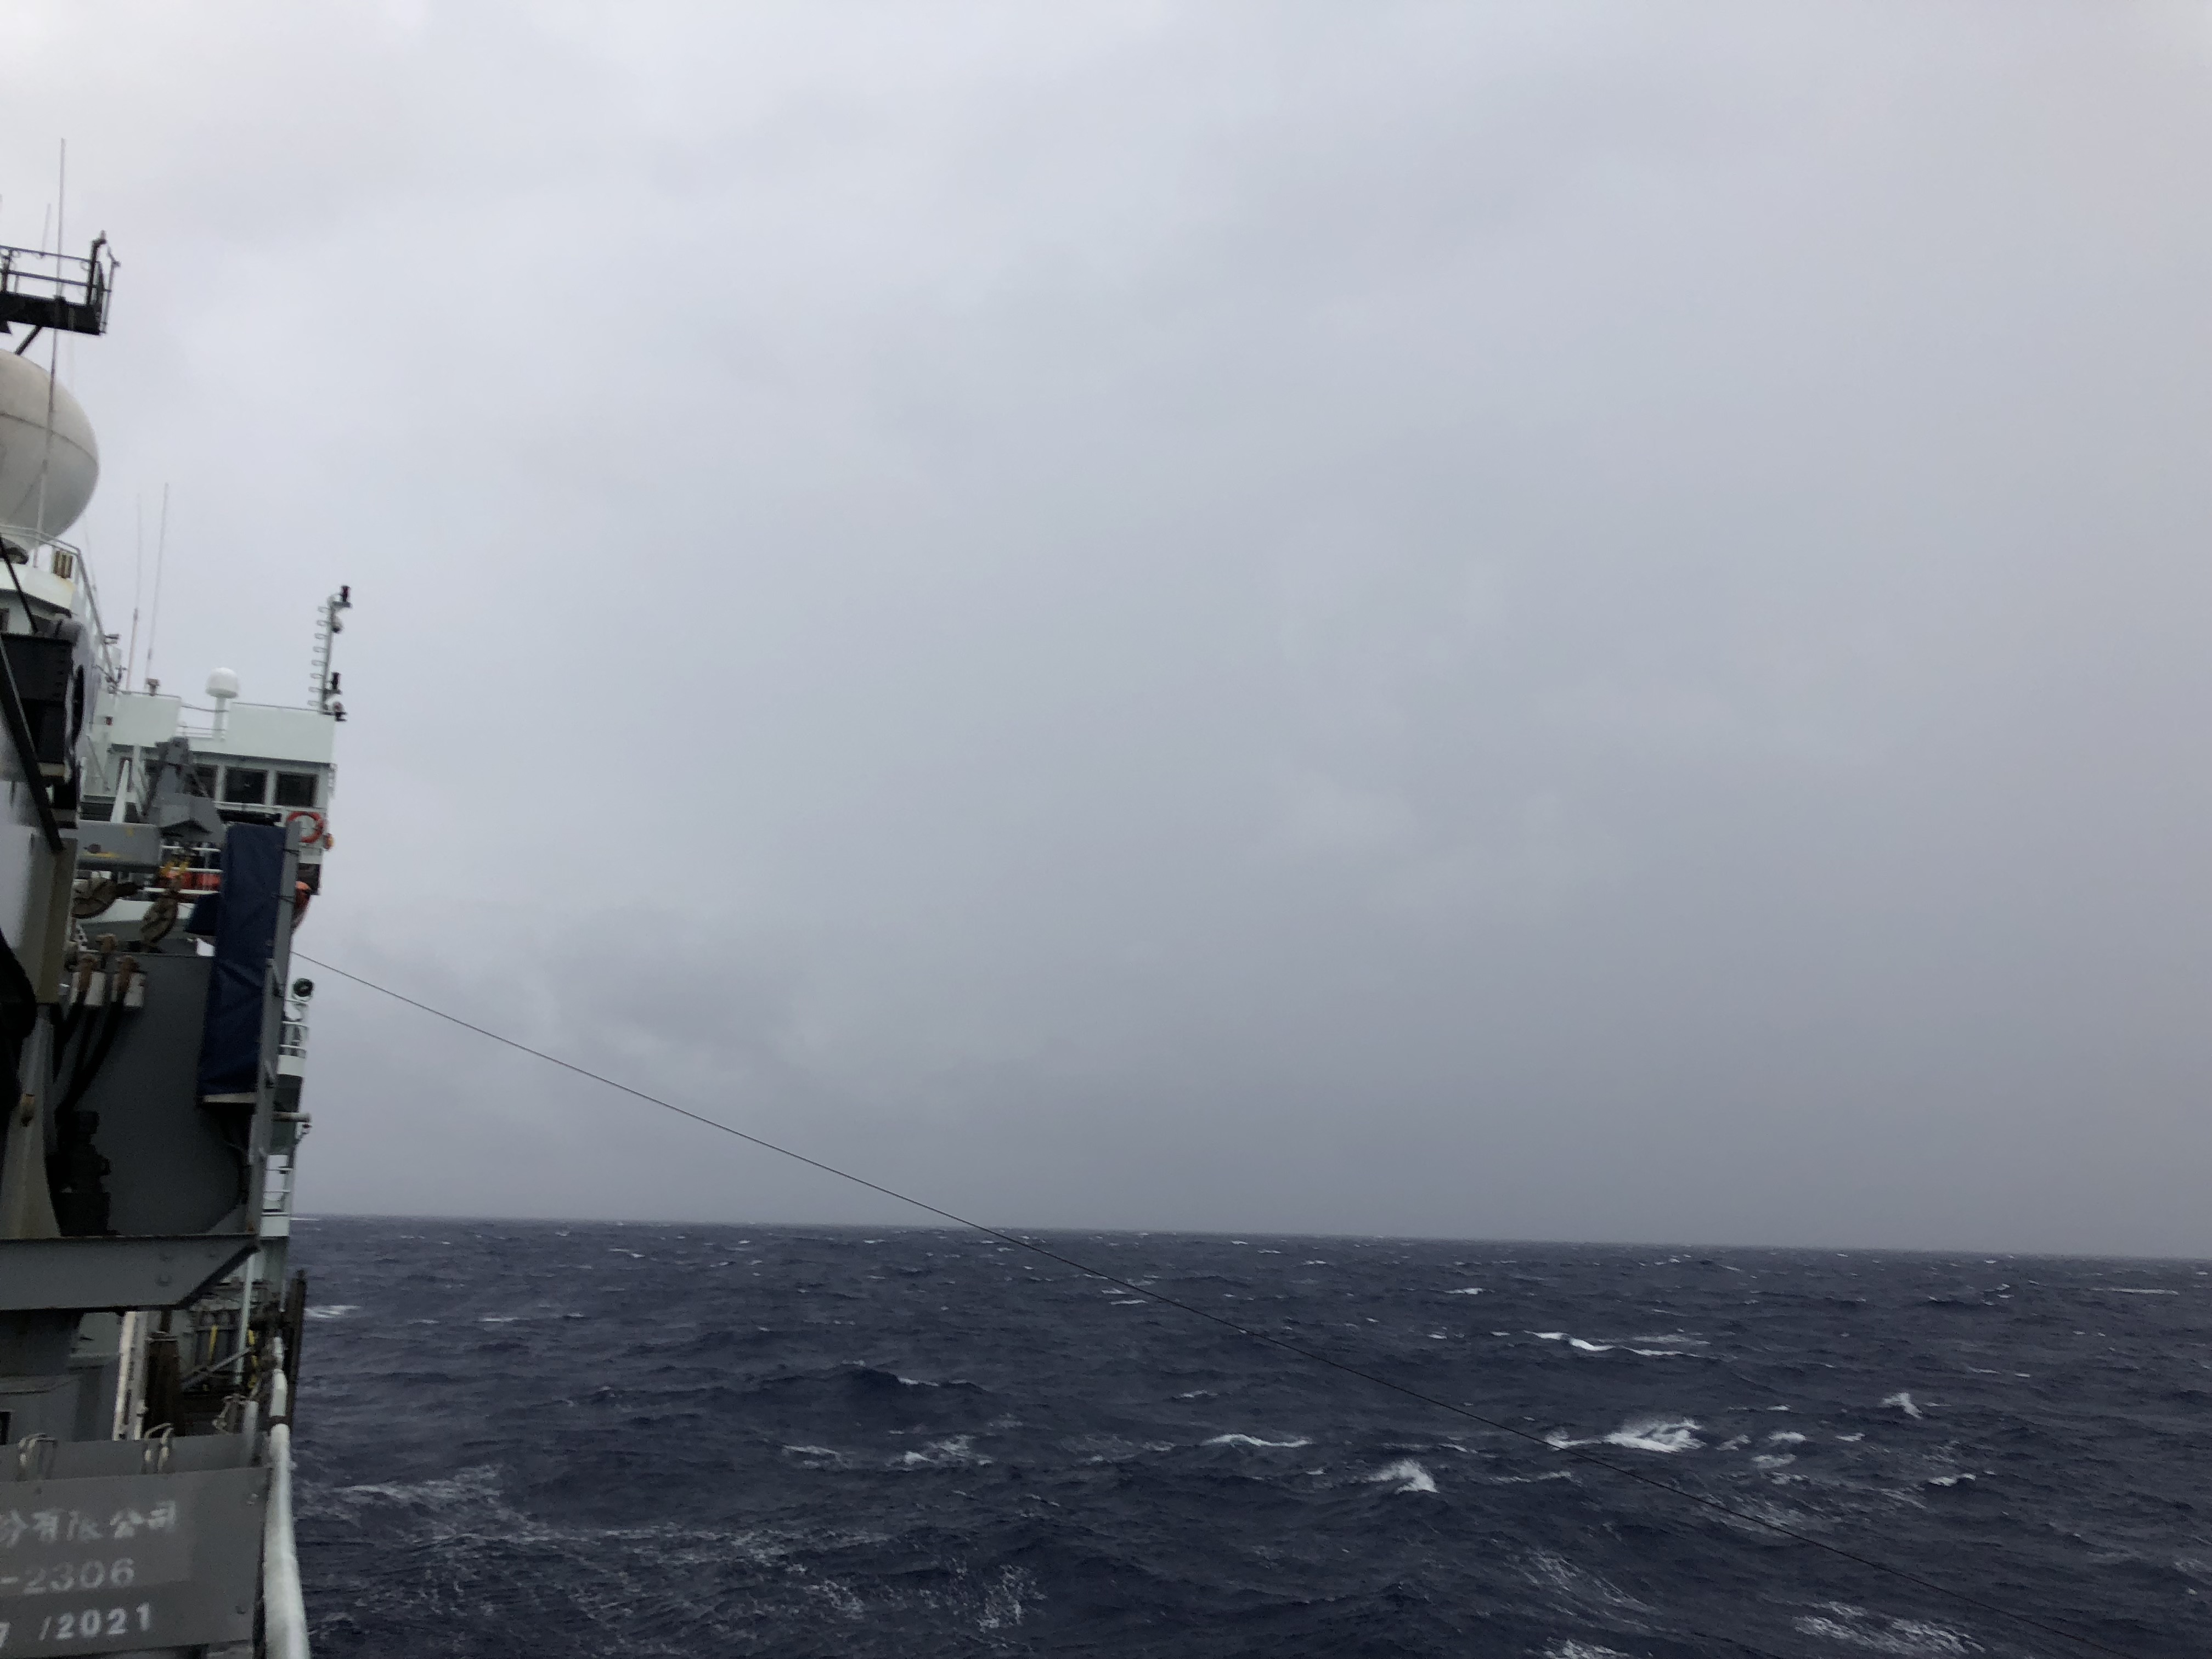
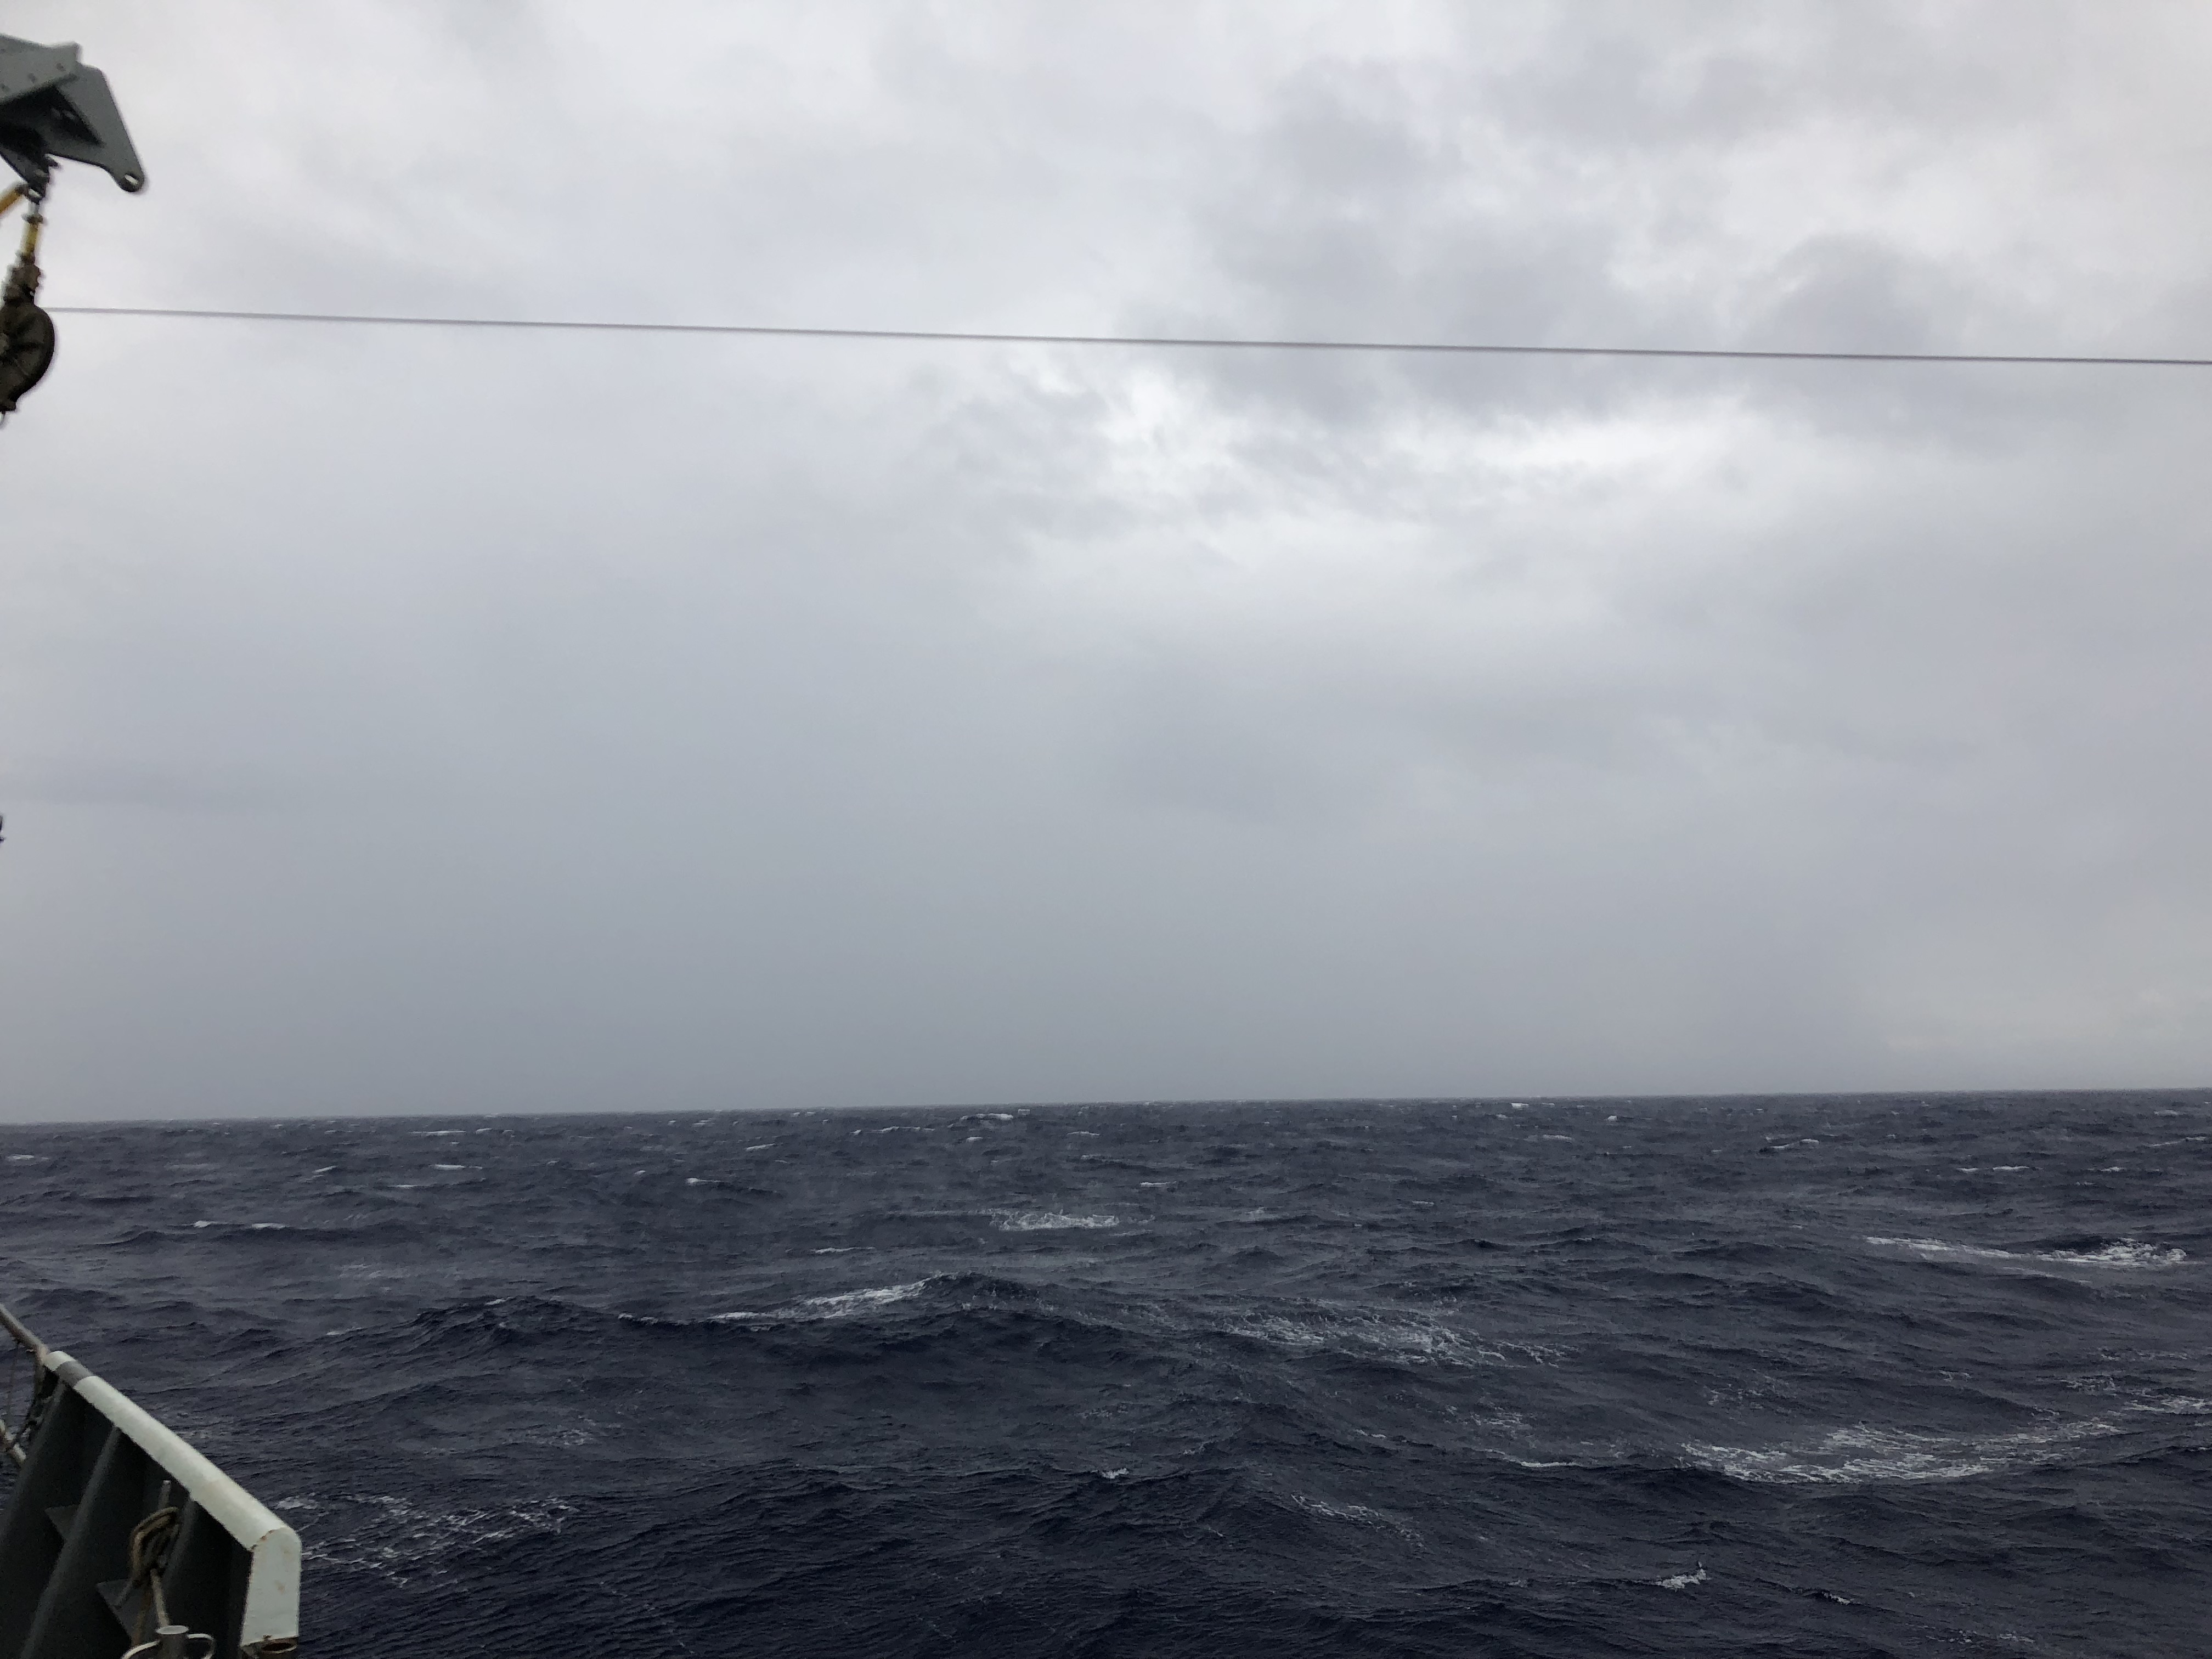
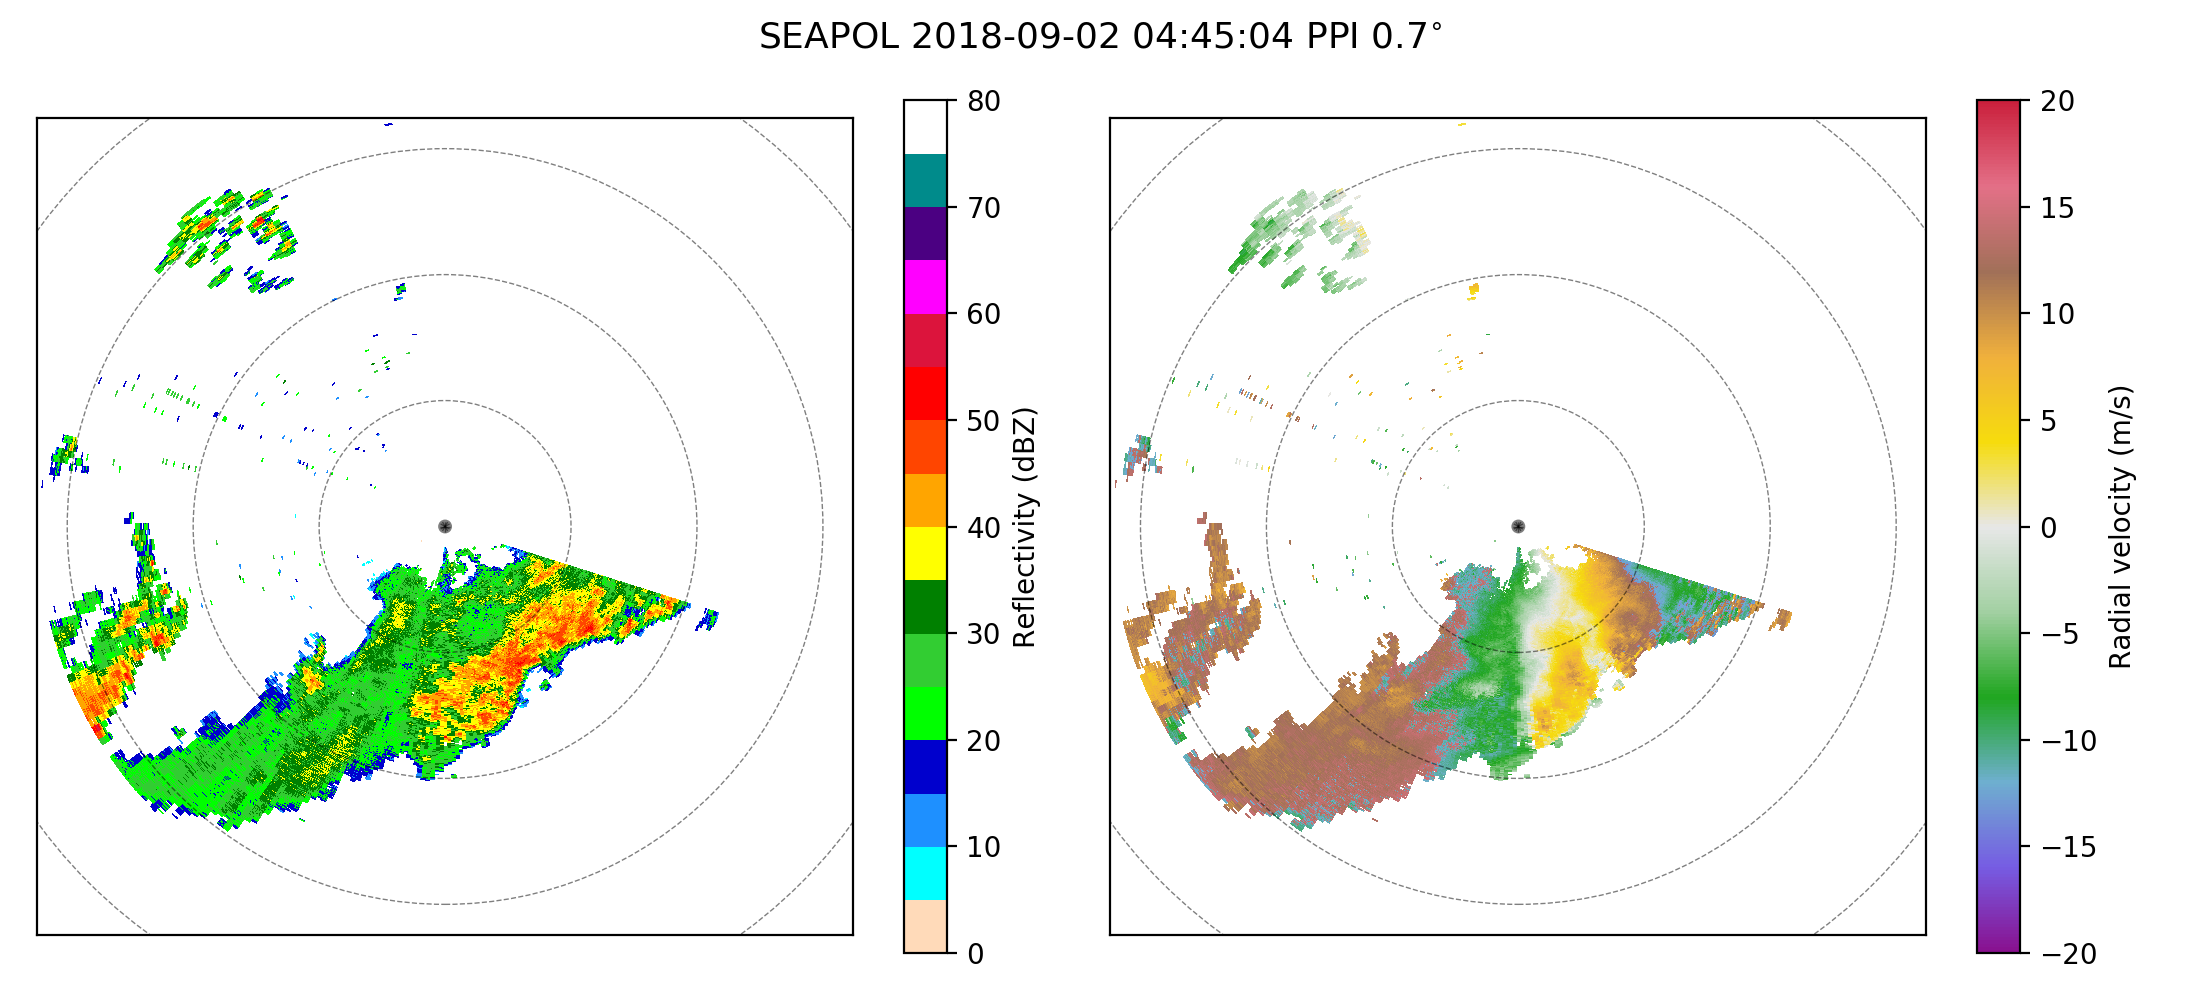
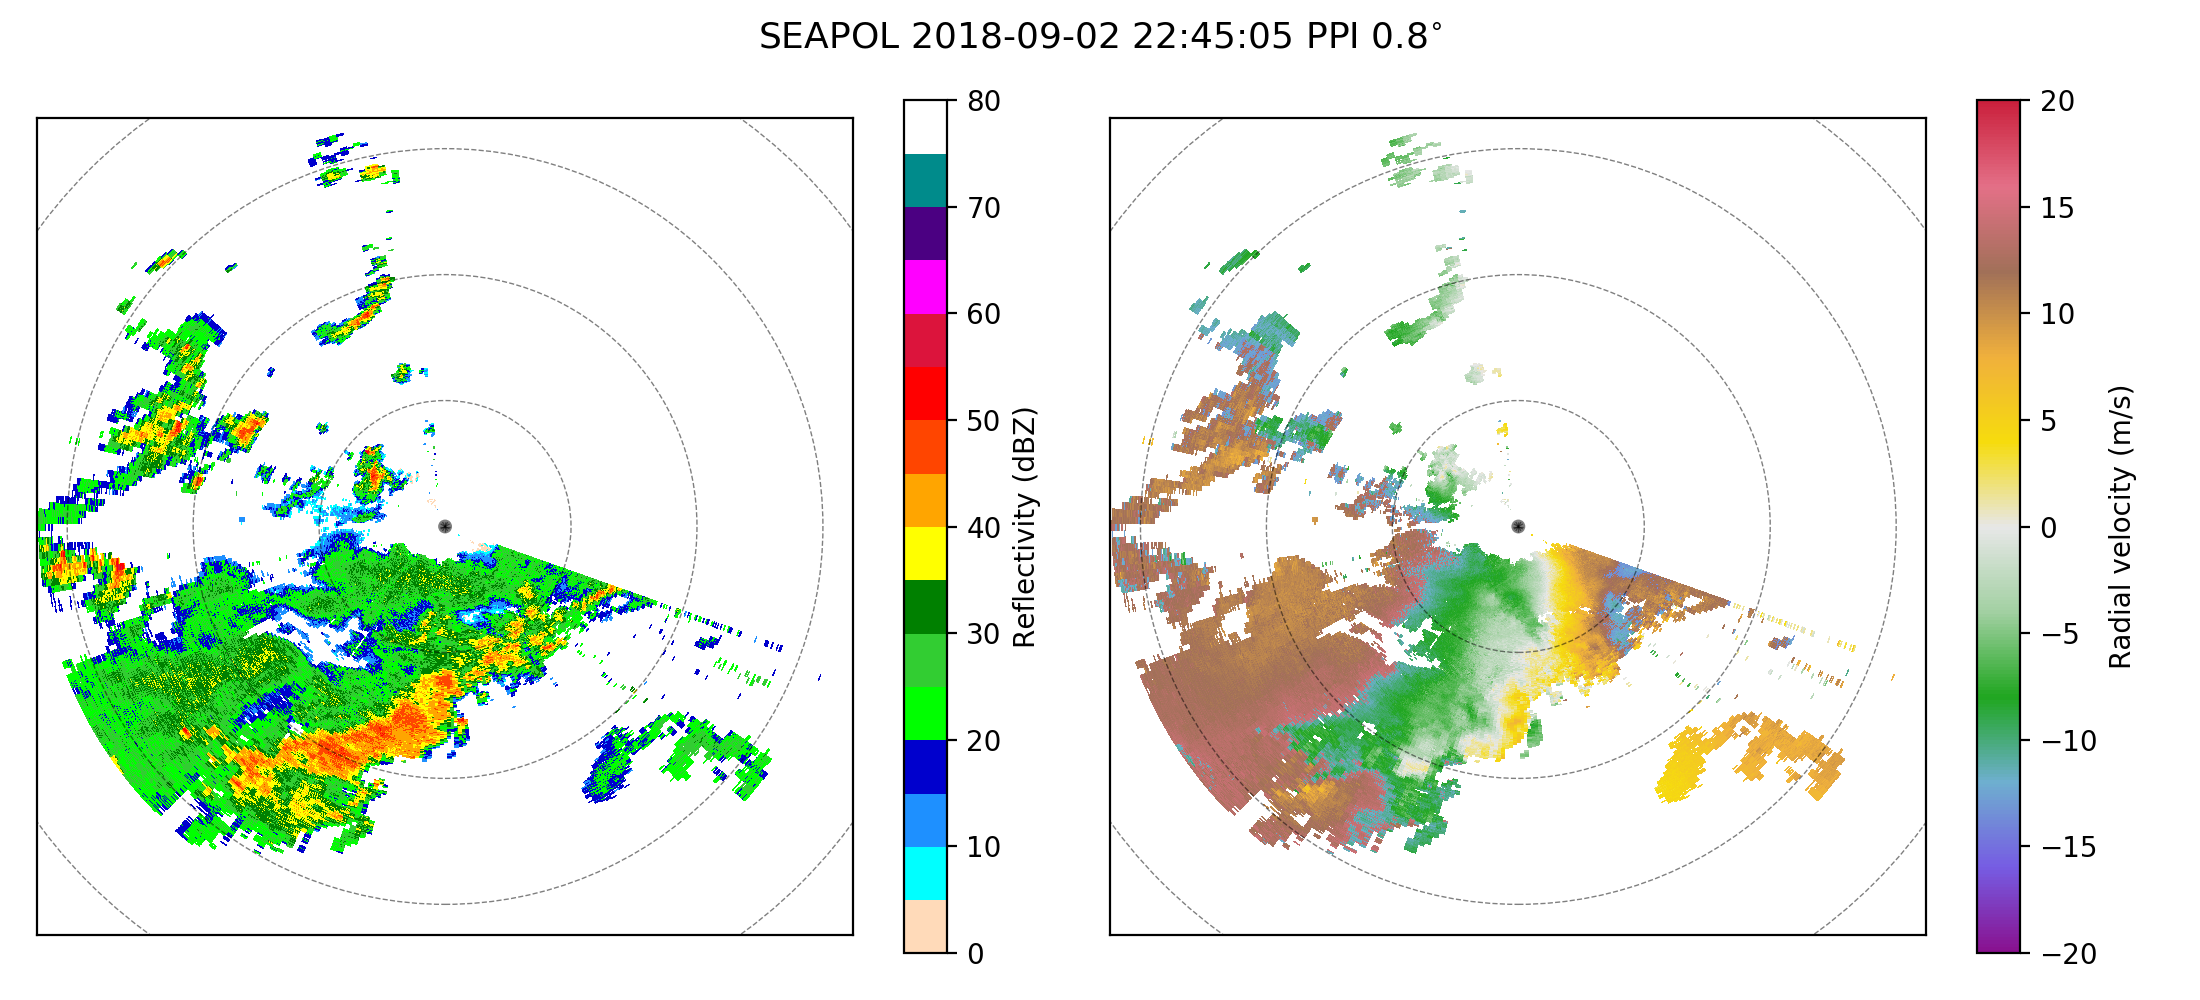
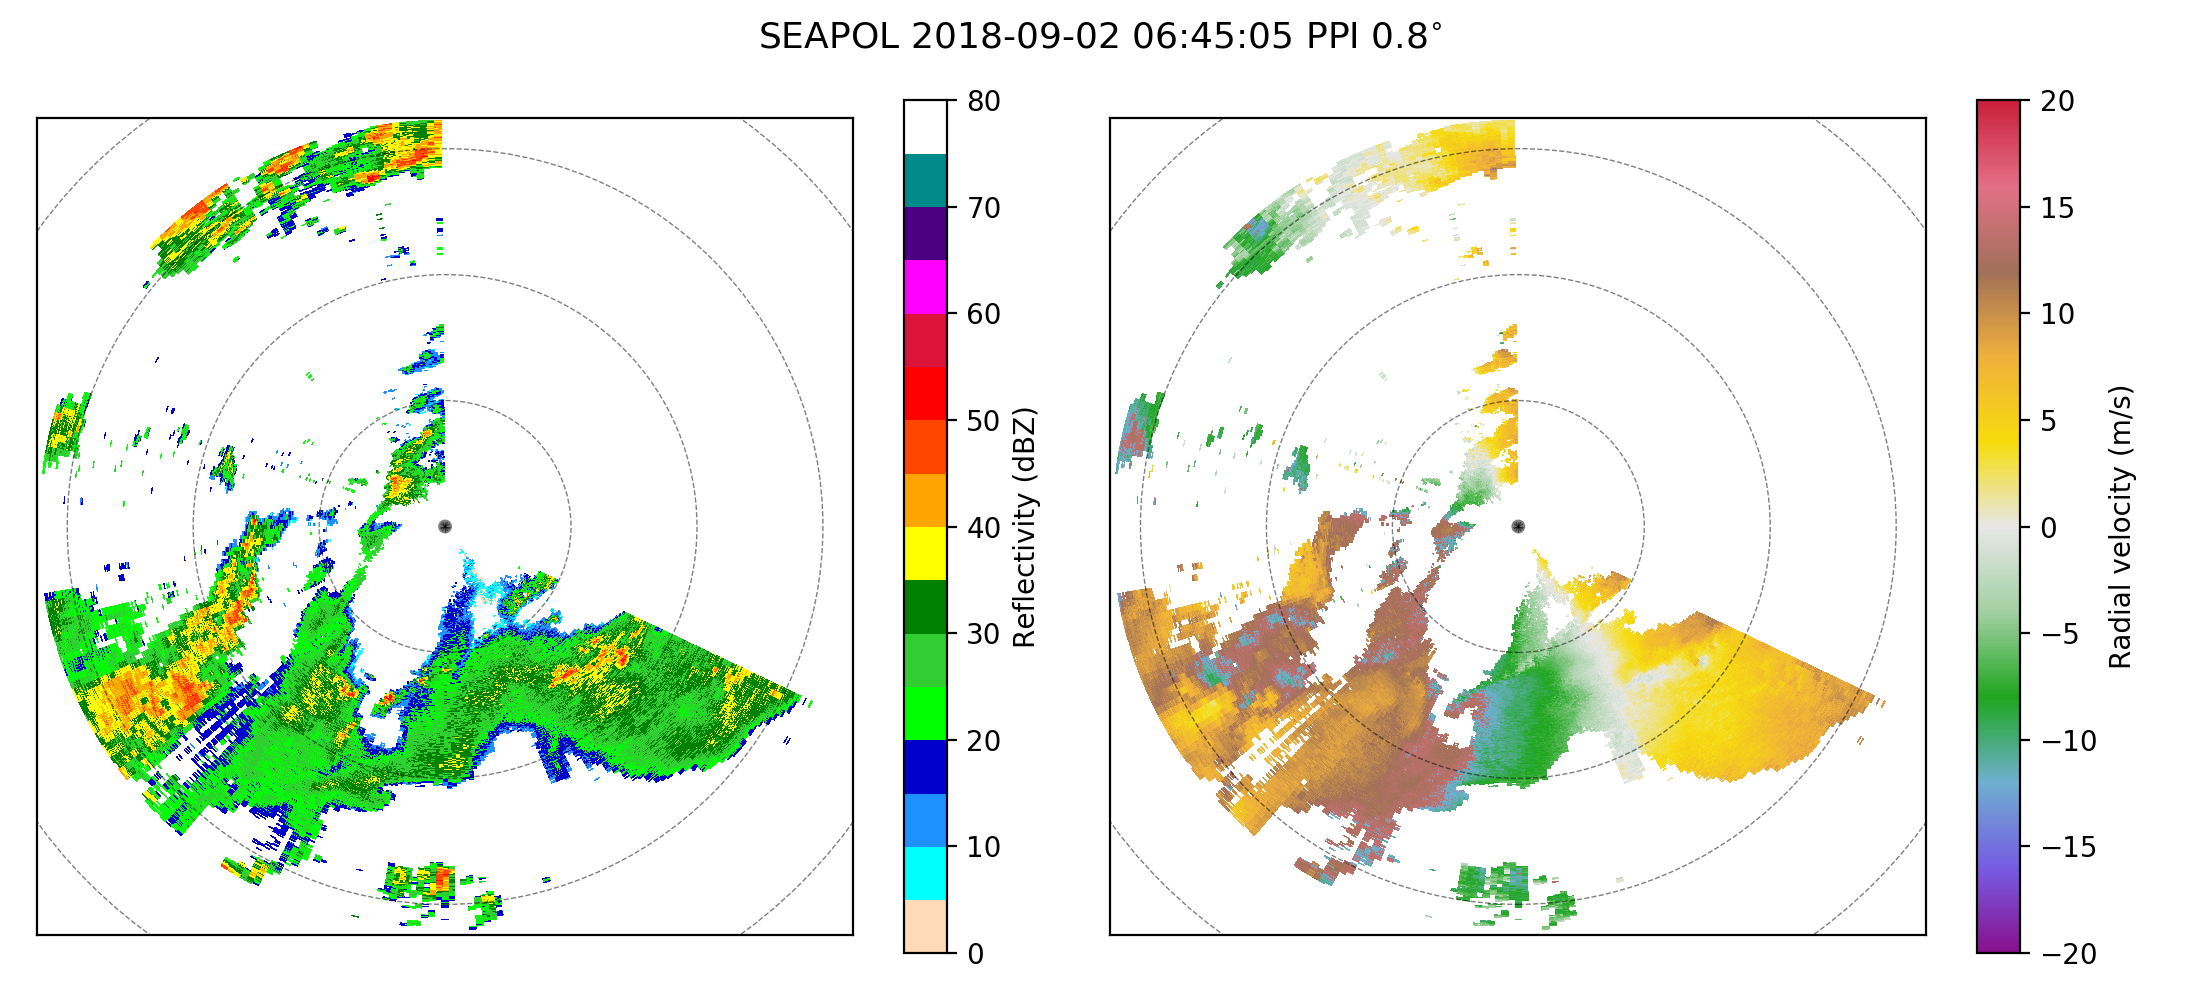
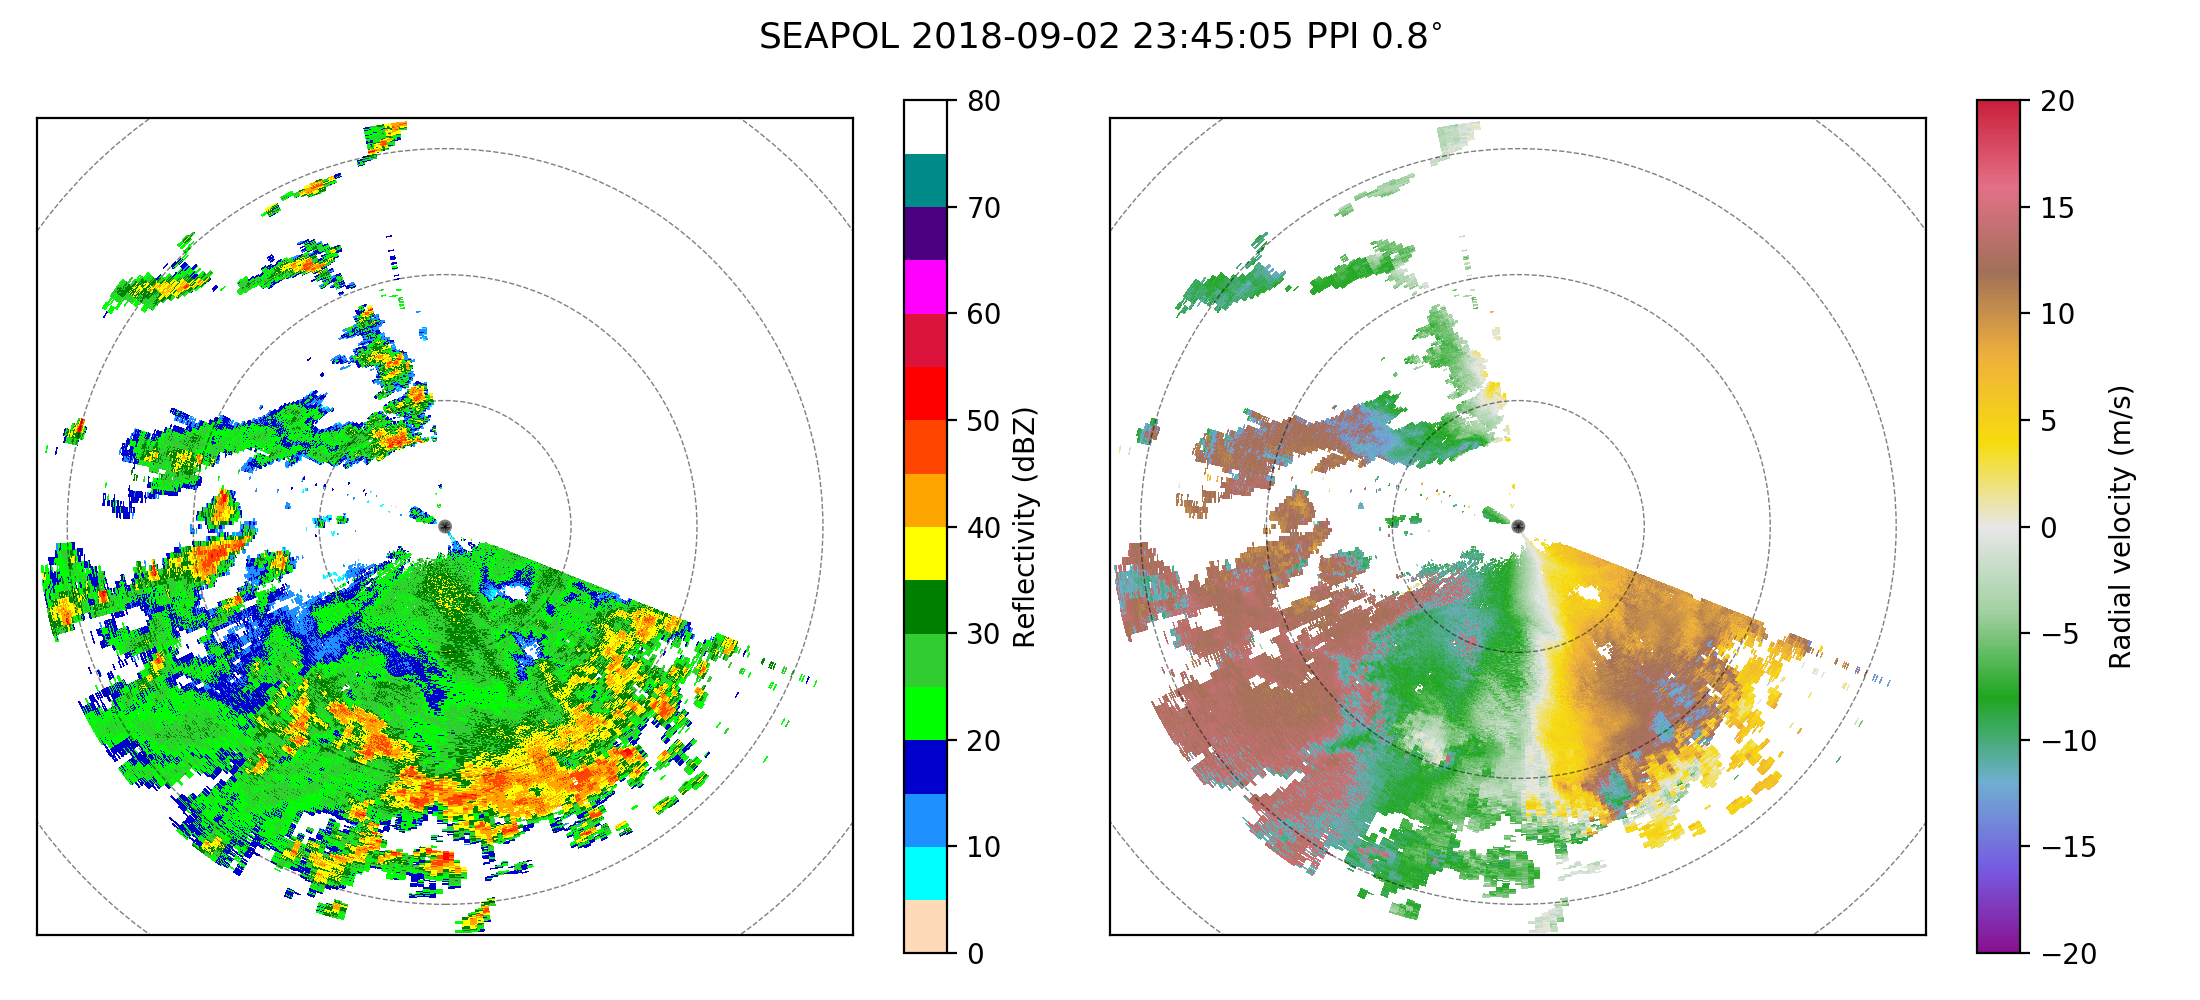
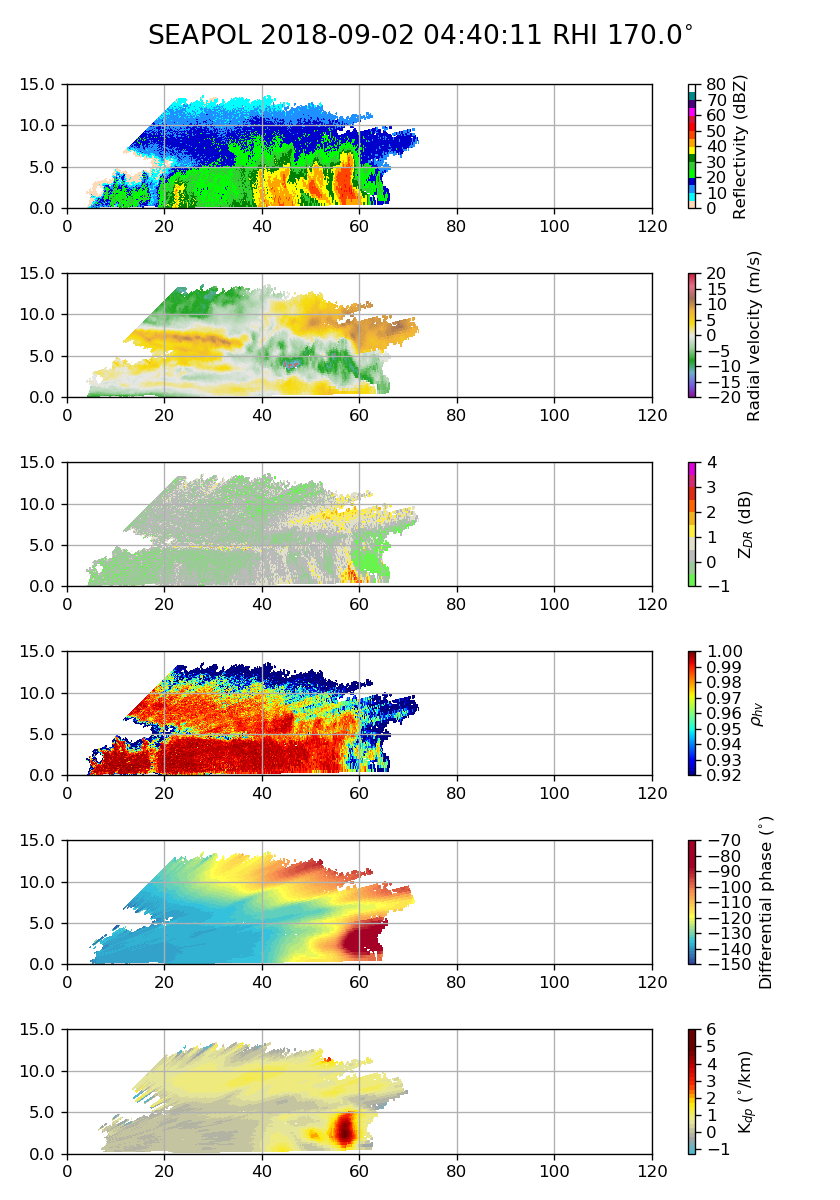
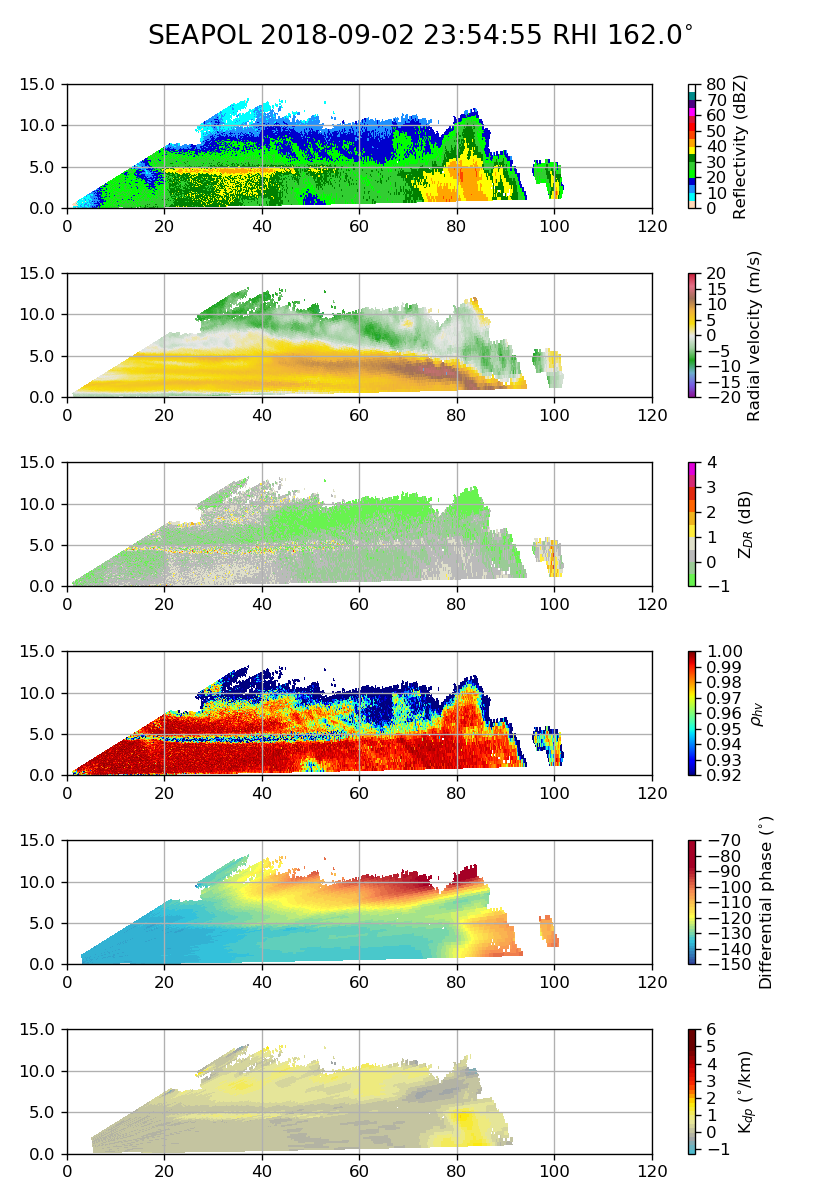
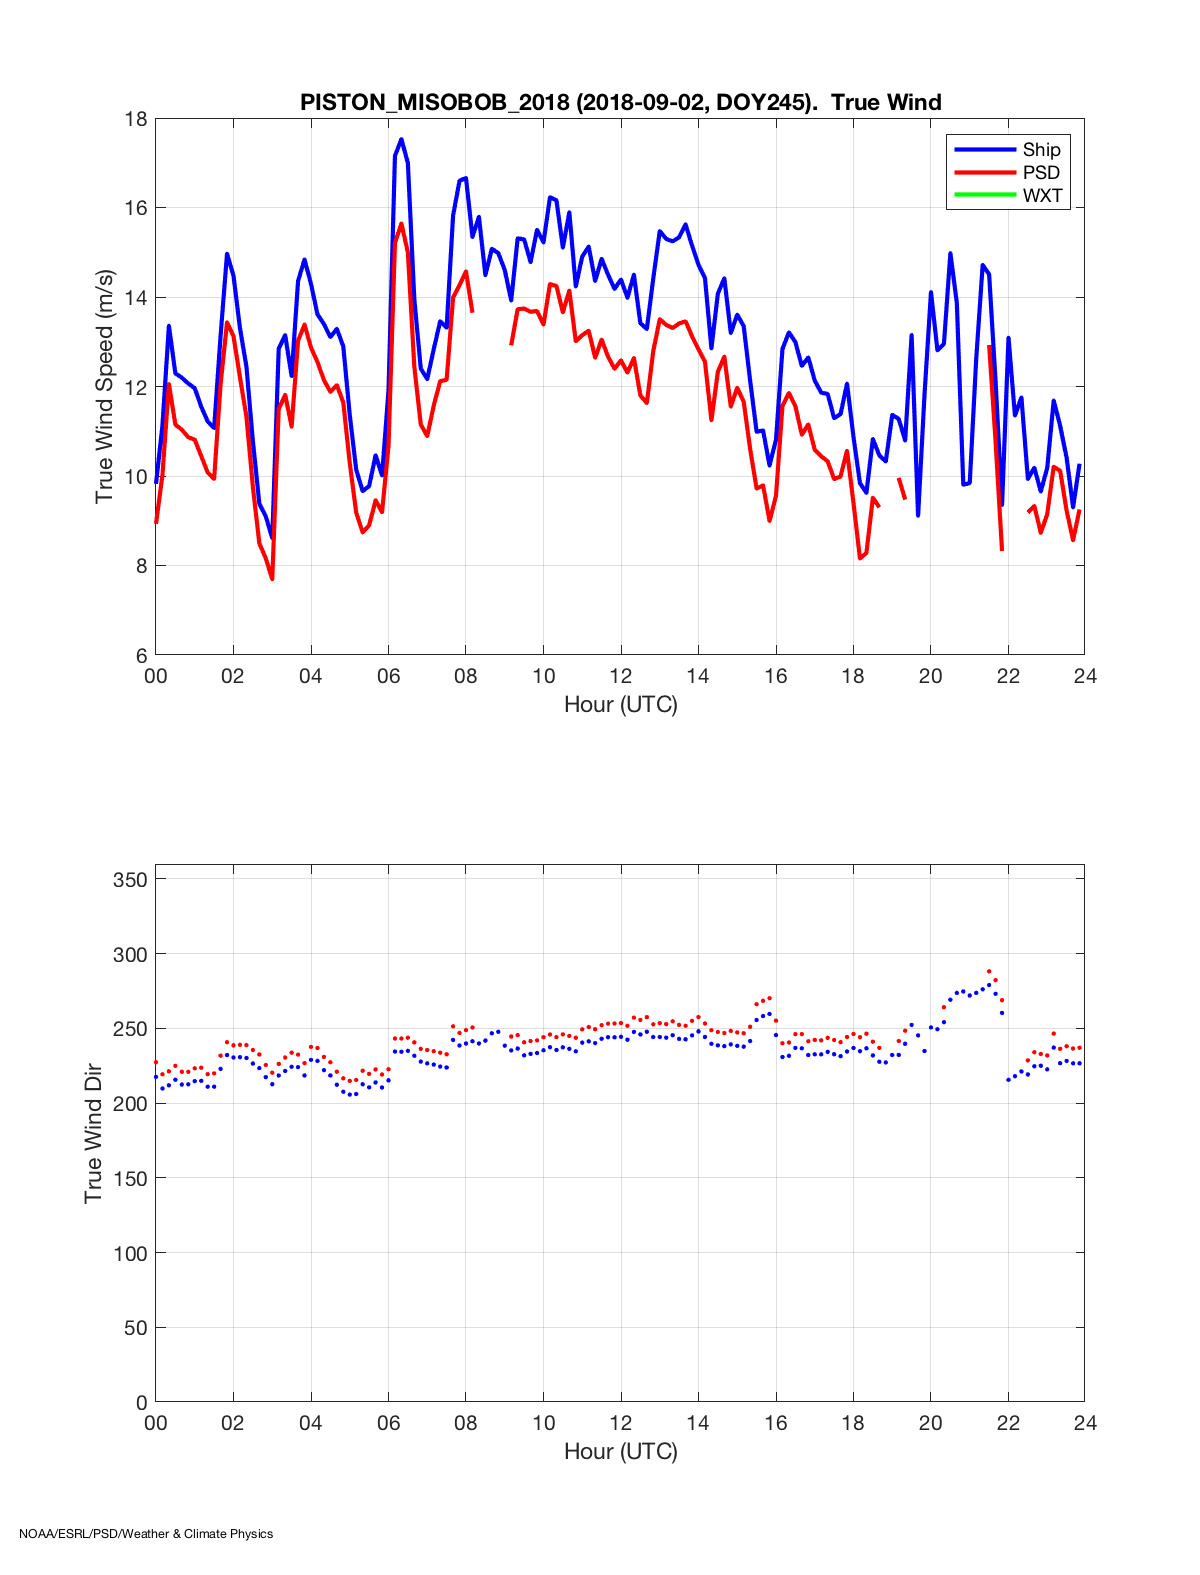
At 00 UTC, a developing squall line was located south of the Thompson, and part of it is seen in the first panel of Figure 4. The remainder of the day was overcast and rainy, and the soundings show various saturated or near-saturated layers as the sondes passed through clouds and/or rain. Two particularly impressive squall lines were observed today. Both lines were oriented from southwest to northeast. Figure 5 contains still images of the squall line at 0445 and 2245 UTC as they passed near SEAPOL. The convective lines were remarkably similar in structure, but the stratiform area in the early convection was positioned mostly to the southwest of the squall line, and the evening stratiform was located to the northwest of the convection in a more classic leading line/trailing stratiform setup. The reason for the different orientation is not entirely clear. Shear in the 00 UTC soundings on 2 and 3 September (Figure 6) differed little. The light winds between 500 and 300 mb were a bit more southerly at 00 UTC on 3 September. By just before 00 UTC on the 3rd, the convective line in the later MCS appeared to be accelerating southeastward away from the trailing stratiform, leaving behind an extensive area of precipitation (Figure 7, top). In contrast, the squall line in the morning MCS moved eastward and left behind a smaller area of stratiform rainfall that extended westward along the direction from which the convection came (Figure 7, bottom). Ascending front-to-rear flow through the convective regions was seen in radial velocities for both MCSs in RHIs that were approximately normal to the orientation of the squall lines. An RHI from 0440 UTC (Figure 8) shows a 5–10 m/s velocity that appears to rise to about 5-6 km altitude at 25 km behind the leading edge of the convective complex. ZDR was highest in the most intense convective cell at the front of the squall line in this cross-section. A much deeper ascending front-to-rear flow was present during the later MCS. An RHI at 2240 UTC detected a rising branch to over 10 km (Figure 9). Not surprisingly, right at the edge of the convection (about 80 km from the radar), the brightband (as seen here by the decreased correlation coefficient around 5 km) is at a slightly higher altitude, and this feature corresponds with the ascending flow to the statiform precipitation. Accompanying rear-to-front descending inflow was also observed in the later MCS (Figure 10). This later MCS was associated with a temporary wind shift to westerly at the ship before the winds shifted back to southwesterly after its passage (Figure 11).
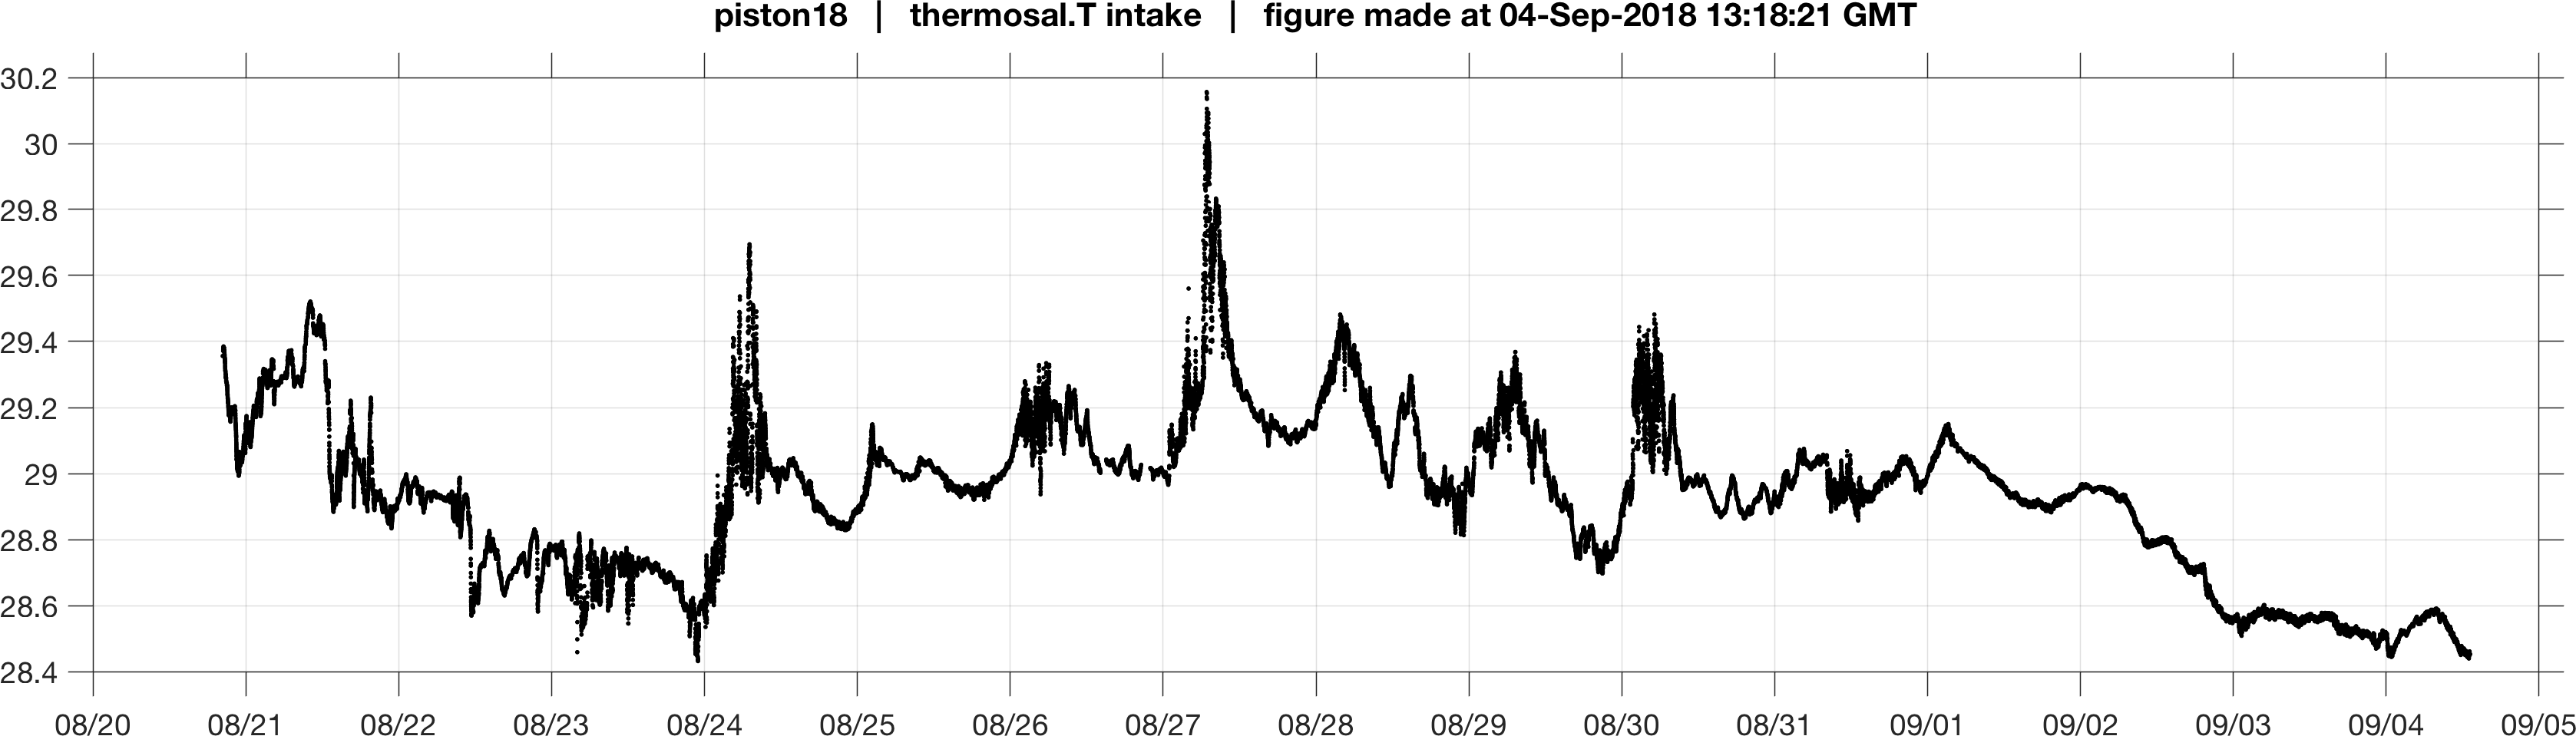
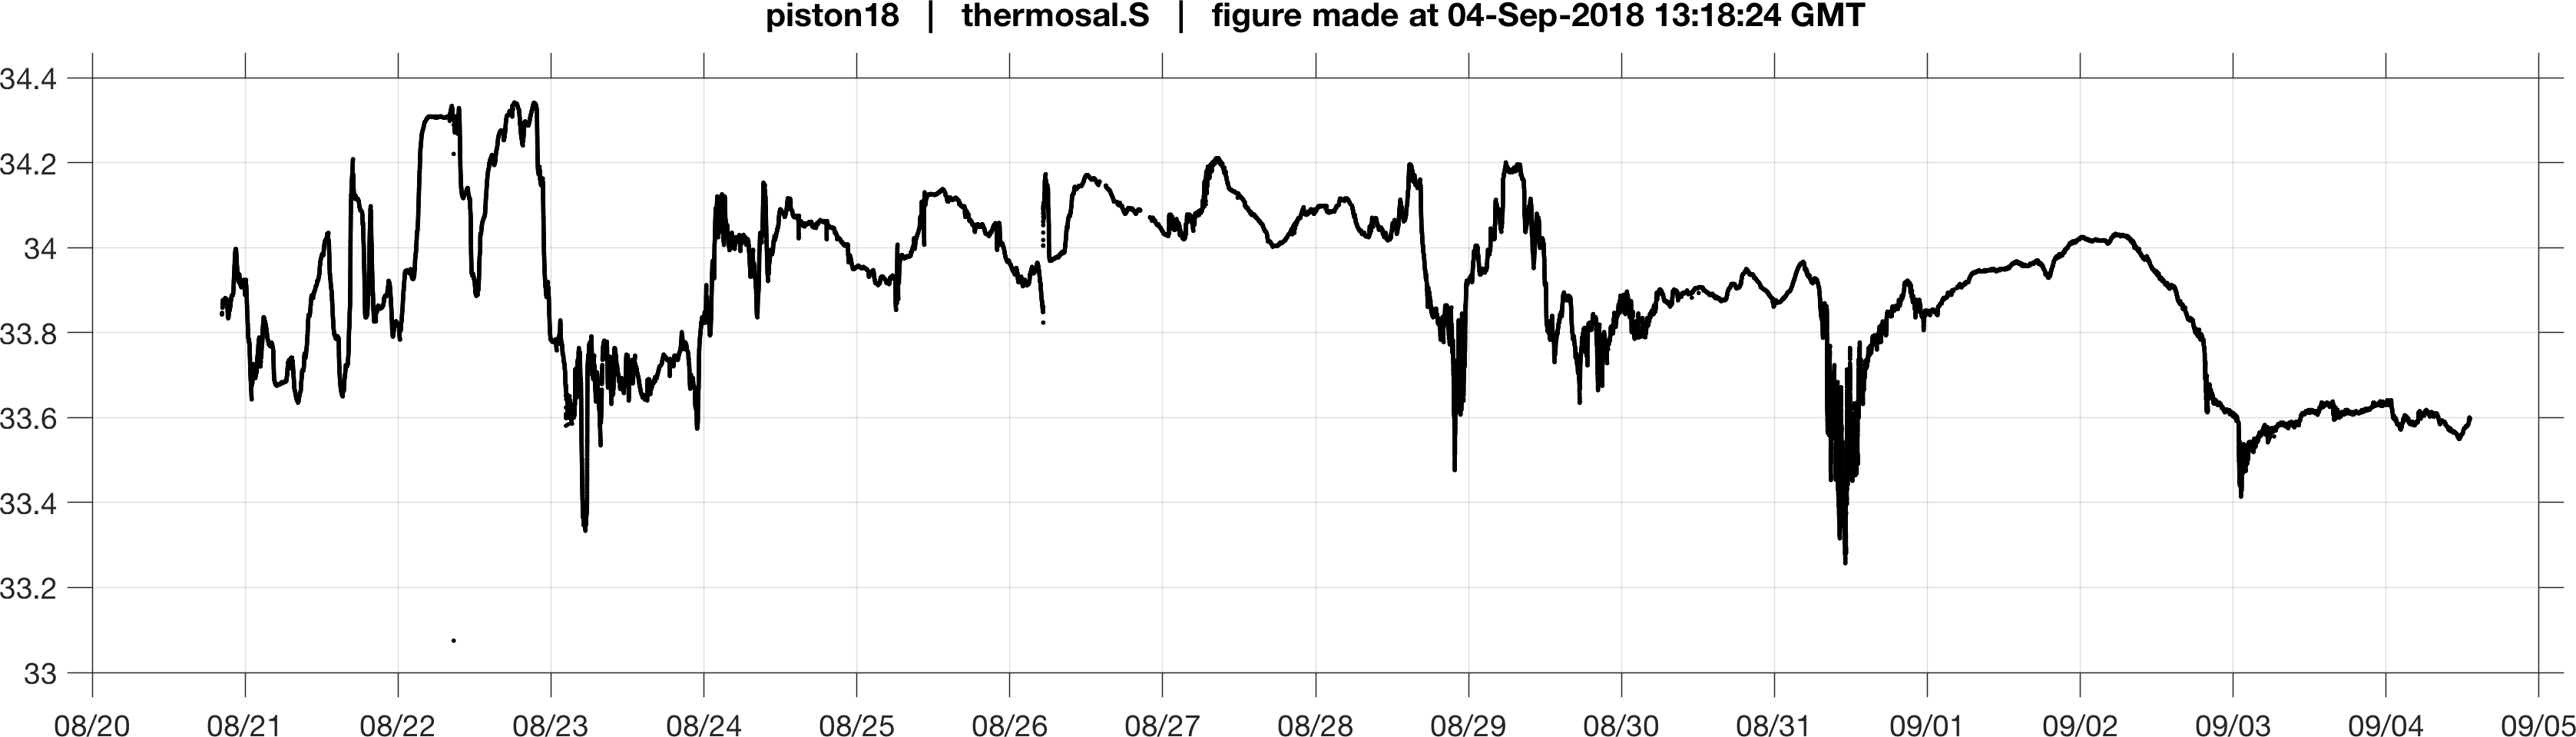
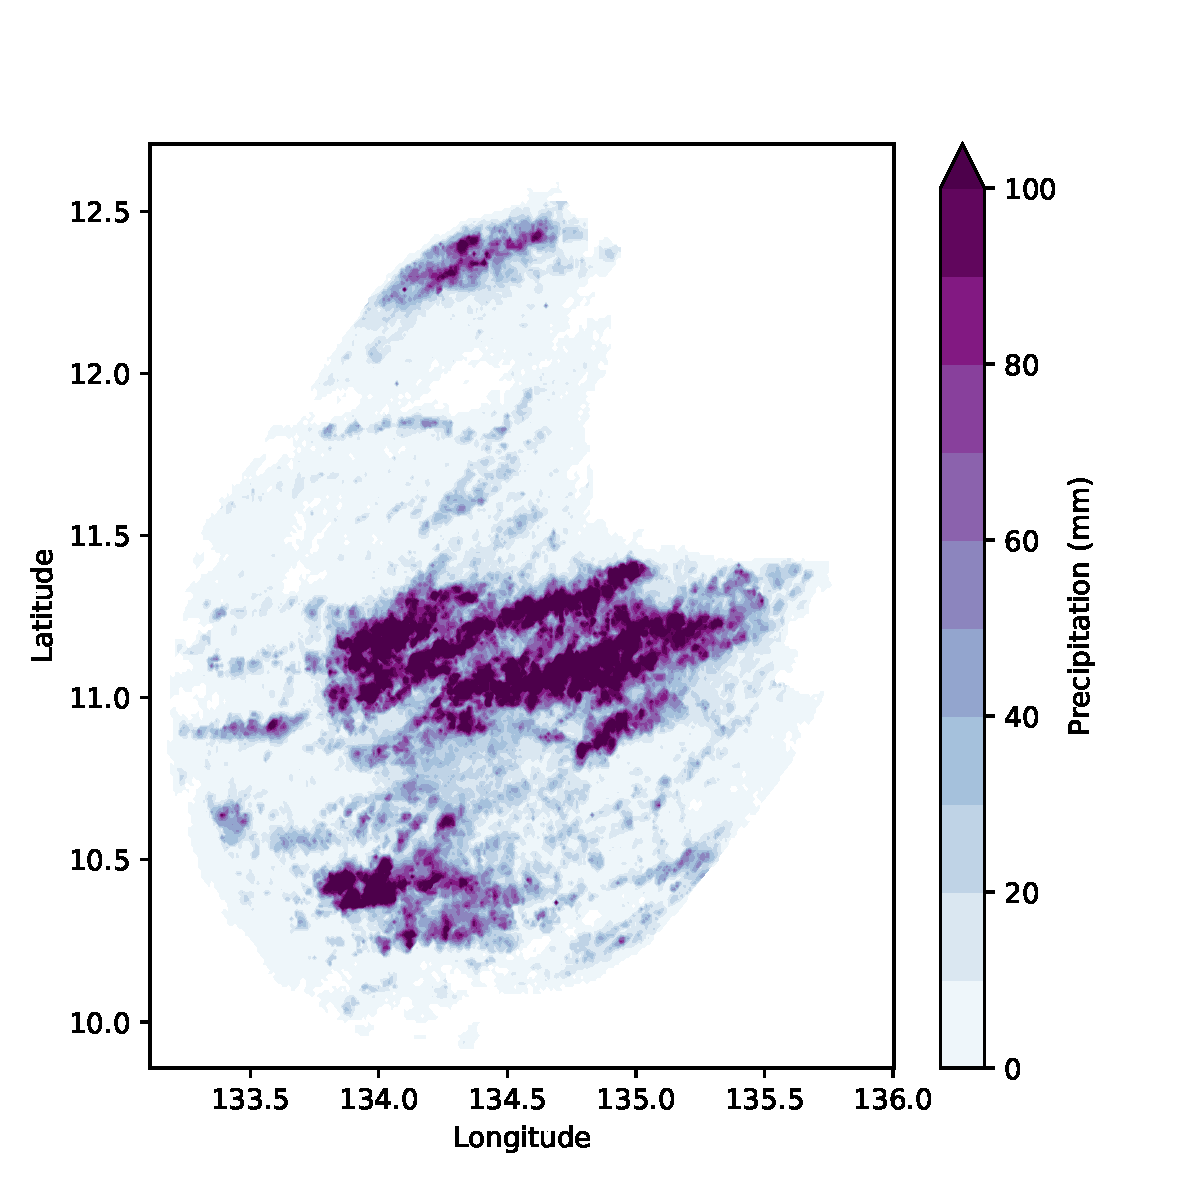
Sea (near) surface temperatures dropped markedly on 2 September. Figure 12 is a plot of temperature and salinity near 4 m depth at the ship throughout PISTON so far. Water temperature and salinity drop, respectively, 0.4 K and 0.4 g/kg from the 2nd to the 3rd. The rainfall in the vicinity of the ship (SEAPOL-derived estimates in Figure 13) likely contributed to these drops, but other factors, such as the ship moving to other areas and mixing by the strong winds experienced today probably contributed as well.