September 3, 2018
Another Rainy Day, Highest Wind Gust of the Cruise, and the Third and Fourth MCSs in Two Days Arrive
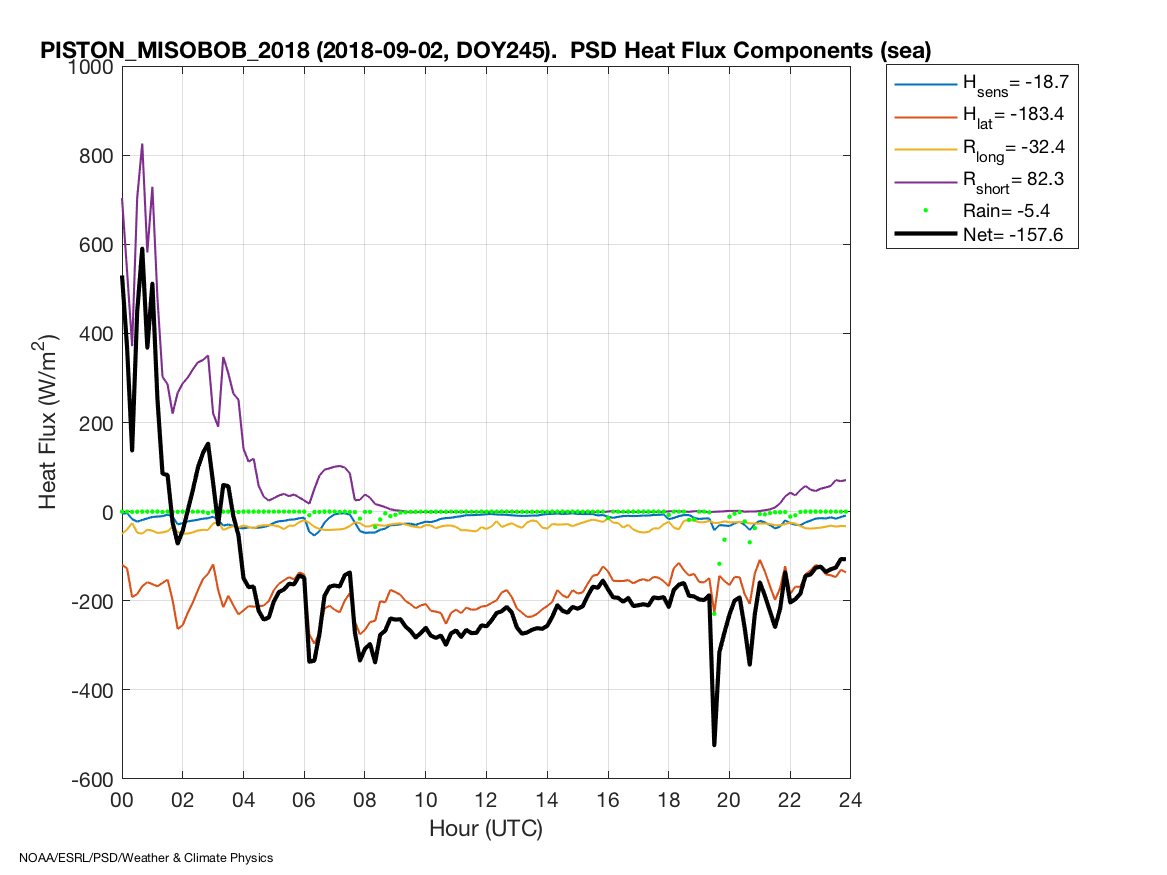
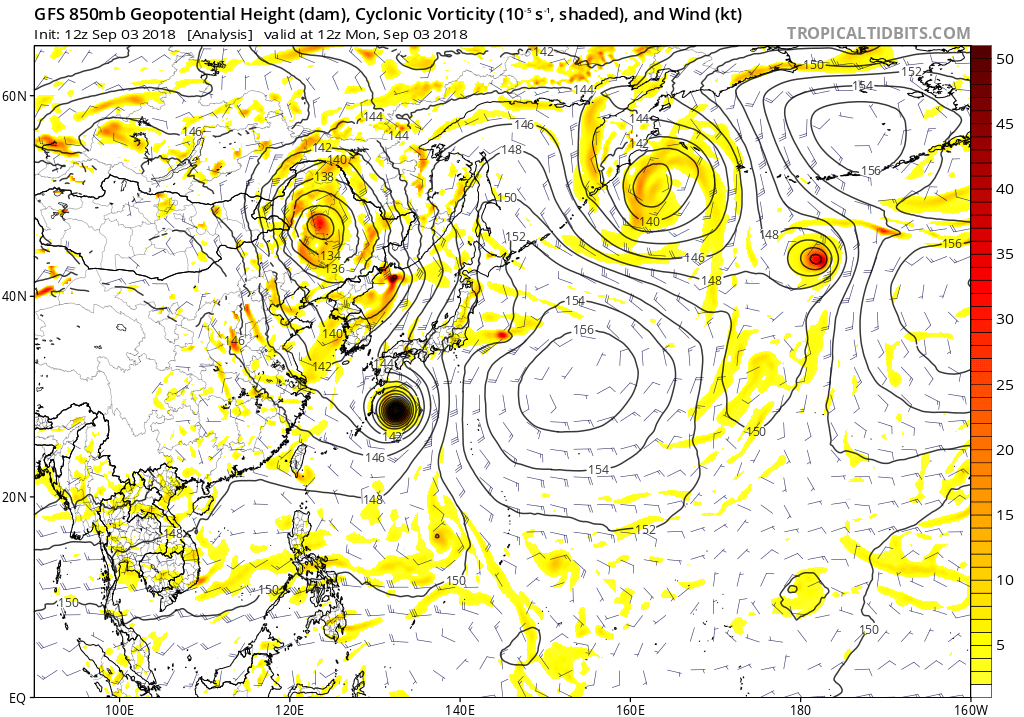
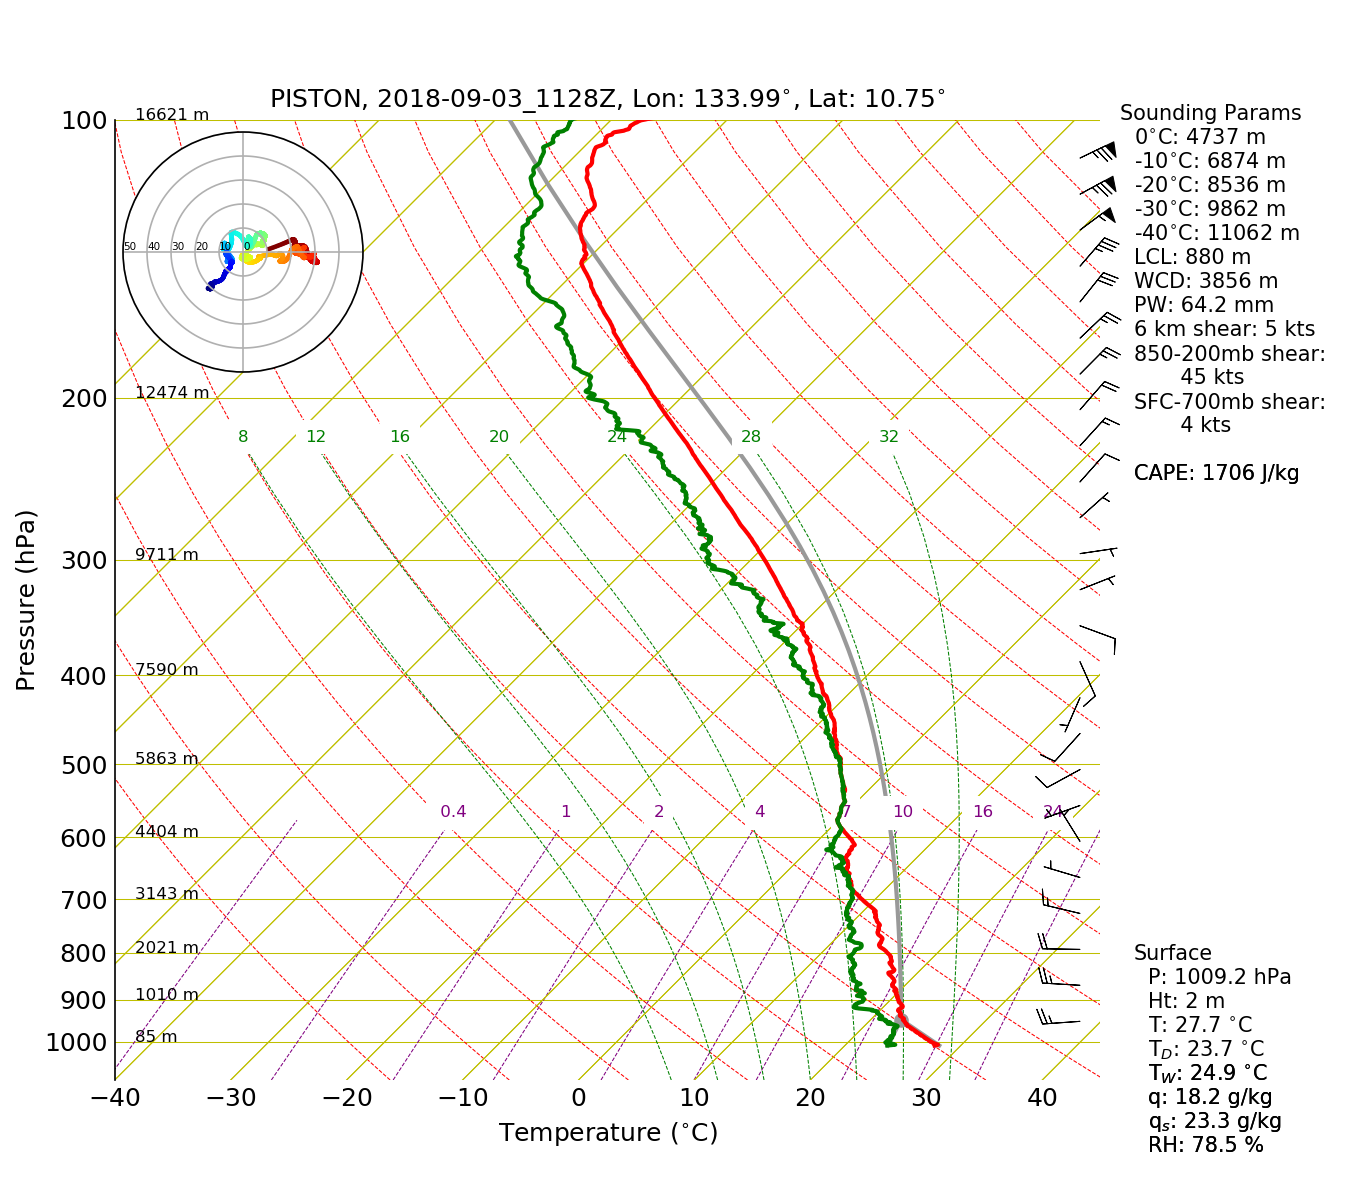
Scott Powell, Timothy Lang, Eric Maloney, Adam SobelThe local weather pattern today was essentially a continuation of the previous two days. Strong low-level westerlies extending from the South China Sea and beyond to the Indian Ocean basin continued to decelerate over the West Pacific, causing convergence and continuing to support the slow moving area of convection that resulted in rain over the ship for a third straight day. A small negative SST anomaly had developed between the Phillippines and Palau (Figure 1, top), consistent with the disturbed conditions, and strongly negative (158 W/m^2) out of the ocean) net heat flux, as shown in Figure 1 (top). The 18 UTC GFS initiatialization captured the 850 mb flow on 3 September (Figure 2, top). The overall story was much the same as the previous day, except that global models developed a small cyclonic circulation on the northern end of the area of convection. Any low-level circulation, however, was difficult to find in late-day visible imagery, such as in Figure 3, at 2210 UTC. Most of the convection was oriented in northwest to southeast lines east of roughly 136°E. To the west of that axis of convection, several southwest to northeast oriented bands of convection fed into the more meridionally oriented convective lines. The Thompson was located in the more zonally oriented convection, roughly near 11°N 134°E. The sounding profiles from today were all quite moist, and the 12 UTC sounding is shown as an example (Figure 4). Westerlies at 950 mb had decreased to 25 kts and turned to weak easterlies between 500 and 300 mb, although weak westerlies occasionally extended up to 300 mb, and at 06 UTC (not shown), weak easterlies extended down to 400 mb. The 18 UTC GFS analysis indicated 10 kt northeasterlies at 200 mb in the vicinity of the ship (Figure 2, bottom).
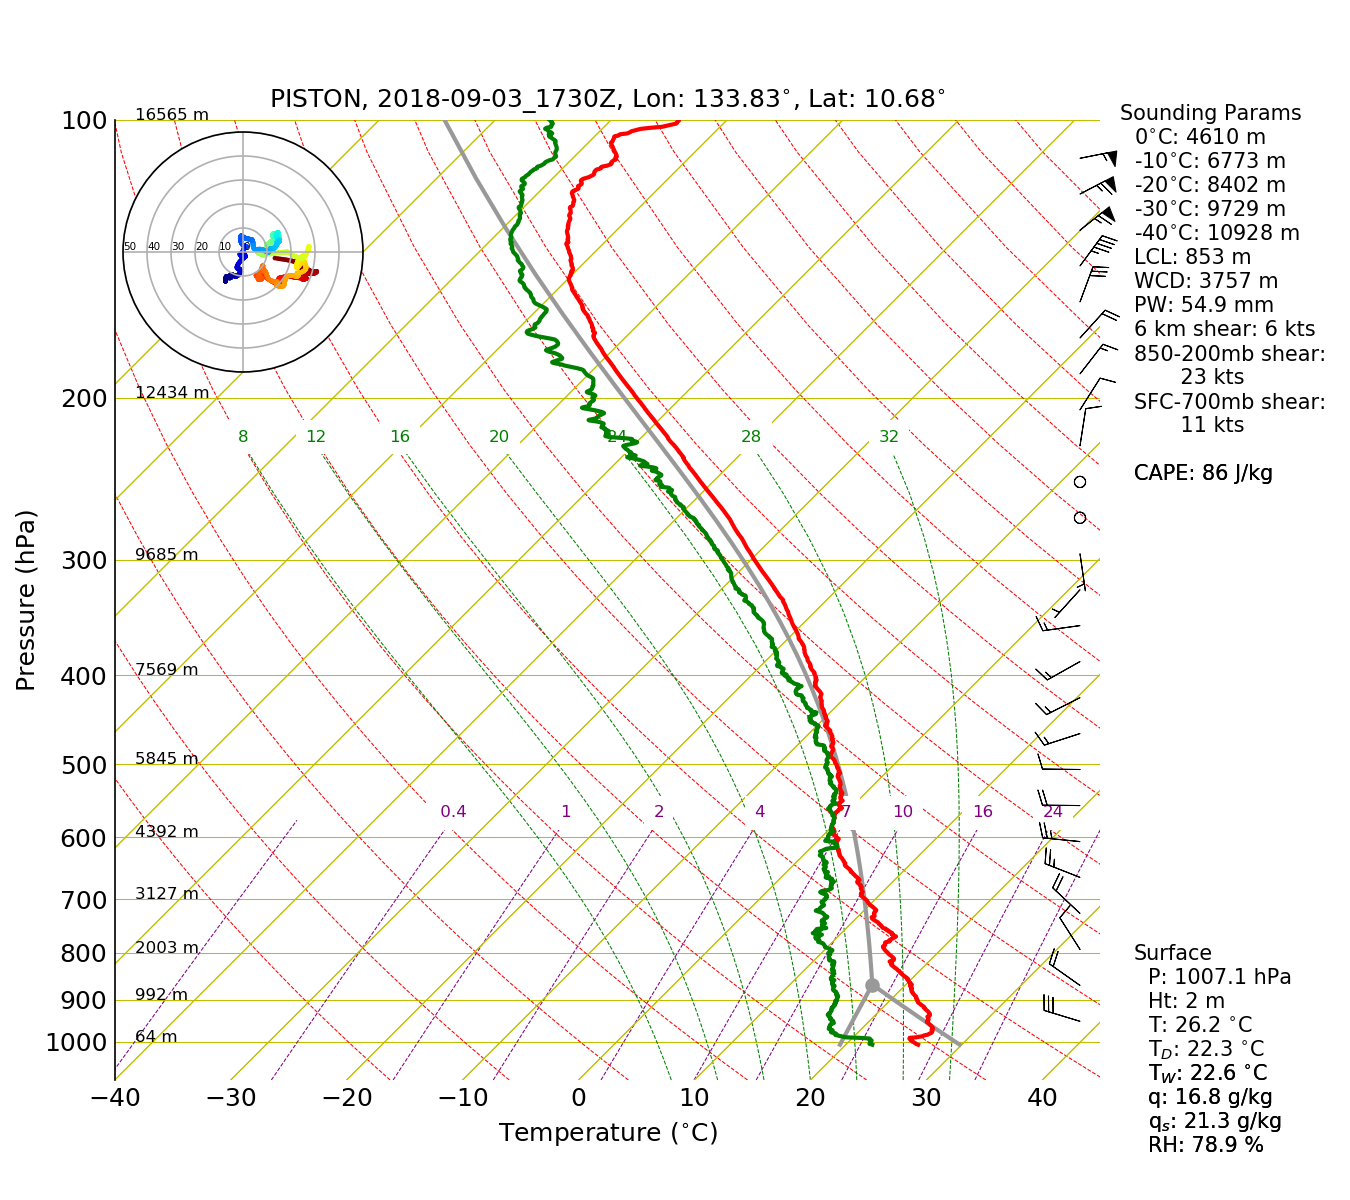
Figure 5 animates low-level scans every 30 minutes from SEAPOL. The squall line and trailing stratiform from 2 September continued to move southeastward, and stratiform precipitation persisted within 120 km to the south of the ship until 11 UTC, and soon thereafter, precipitation was detected to the north of the ship. Convective cells at the leading edge of another southwestward moving MCS entered the 120 km domain just before 14 UTC and moved quickly toward the ship. Radial velocities in the echo as it approached the radar indicated winds of 35–40 kts inside the rain, and indeed these winds were sustained for several minutes as the convective cells pass through. The highest gust of PISTON observed so far, 50–55 kts depending on whether the port or starboard anemometer is considered, occurred during the leading gust front just ahead of the intense convection. Unfortunately, the disdrometer onboard was not functional; however, very large raindrops were observed from the bridge as the convective cells passed. Trailing stratiform moved through for a couple more hours but decayed by 18 UTC. The 18 UTC sounding (Figure 6) was particularly interestingly as captured a period of mesoscale subsidence occurring about one hour after passage of the nighttime convective squall line. Distinct drying occurred beneath 600 mb, and just above the ocean, an inversion was present with a dry layer. TPW briefly dropped down to about 55 mm--still moist but dry compared to other times during the cruise. By 21 UTC, the low-level dry air has mostly disappeared.
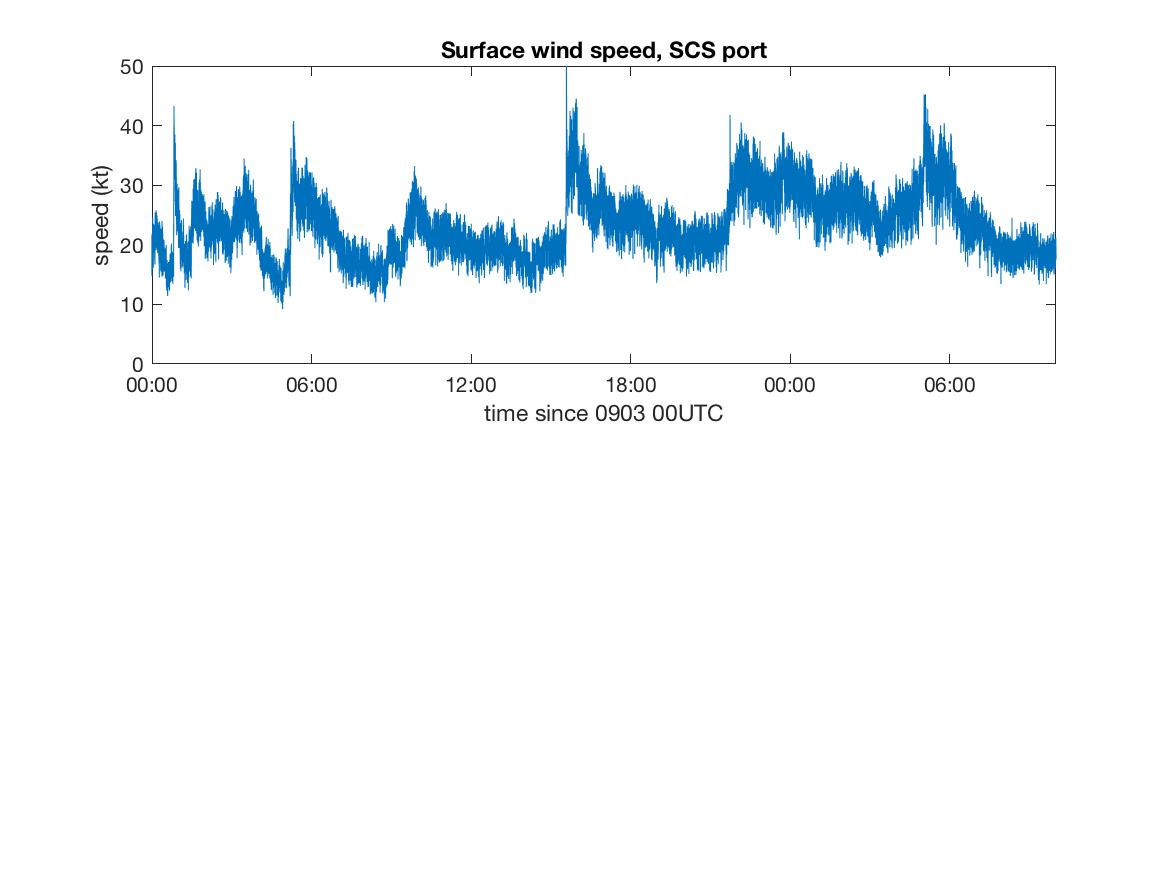
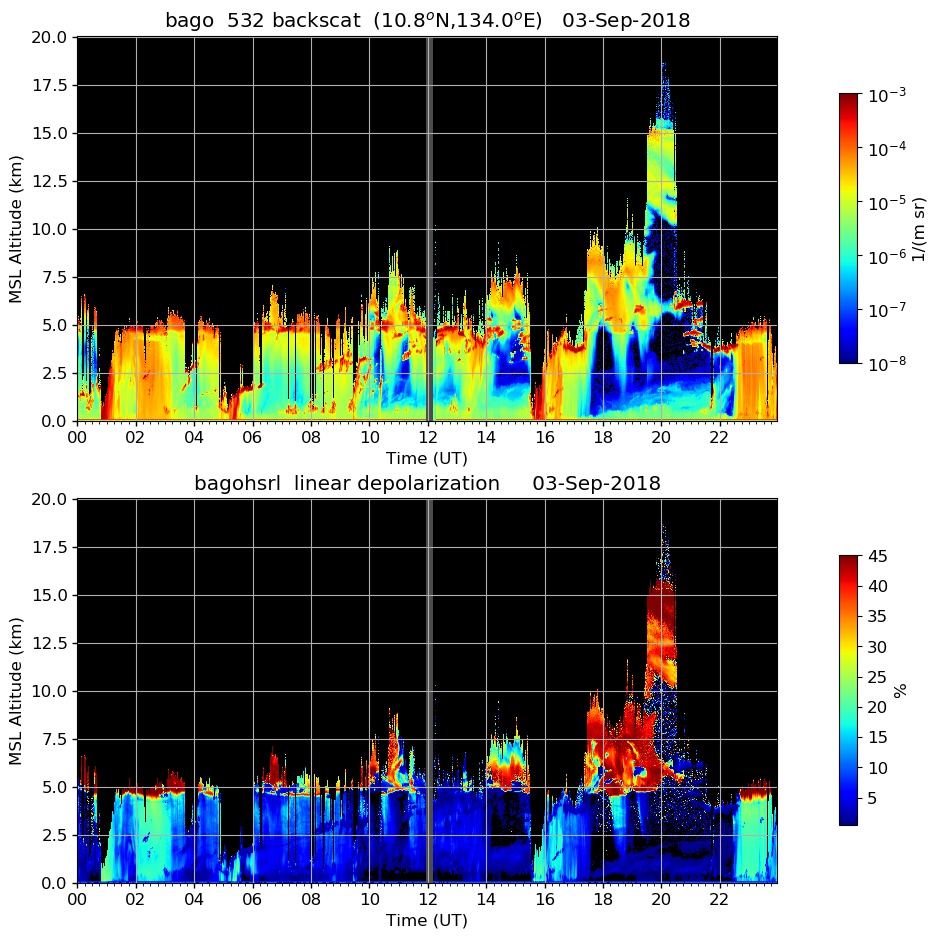
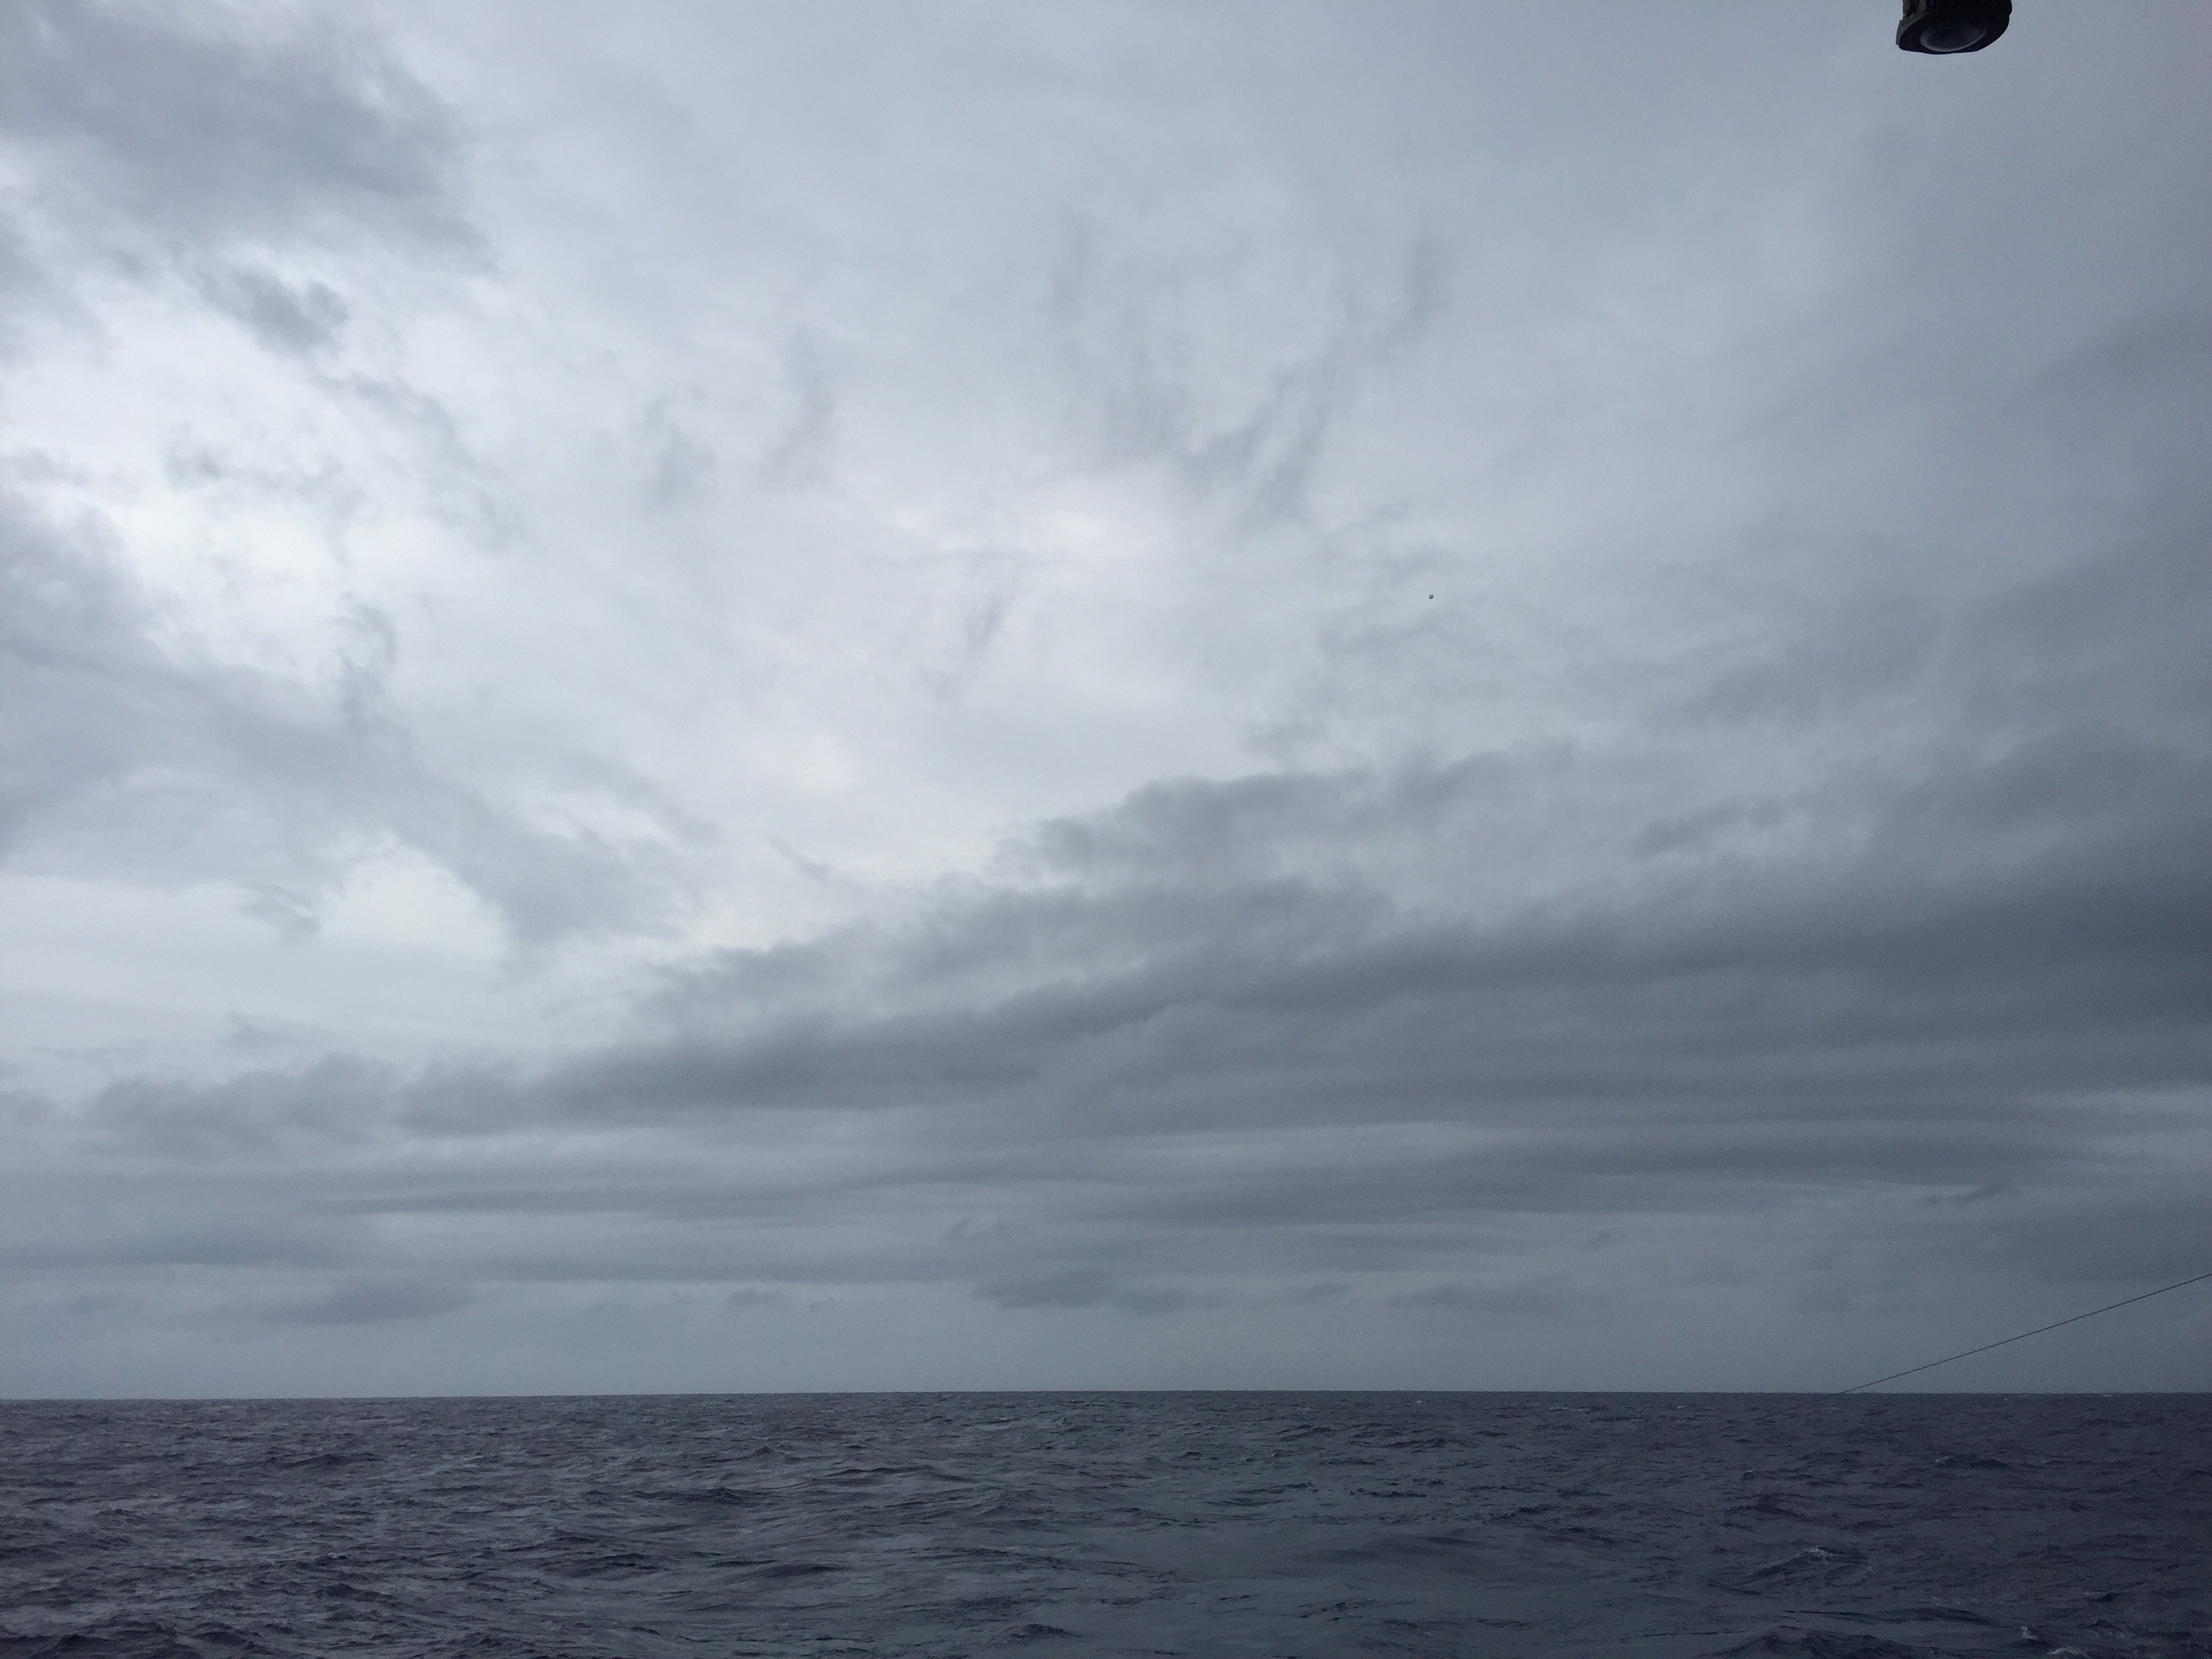
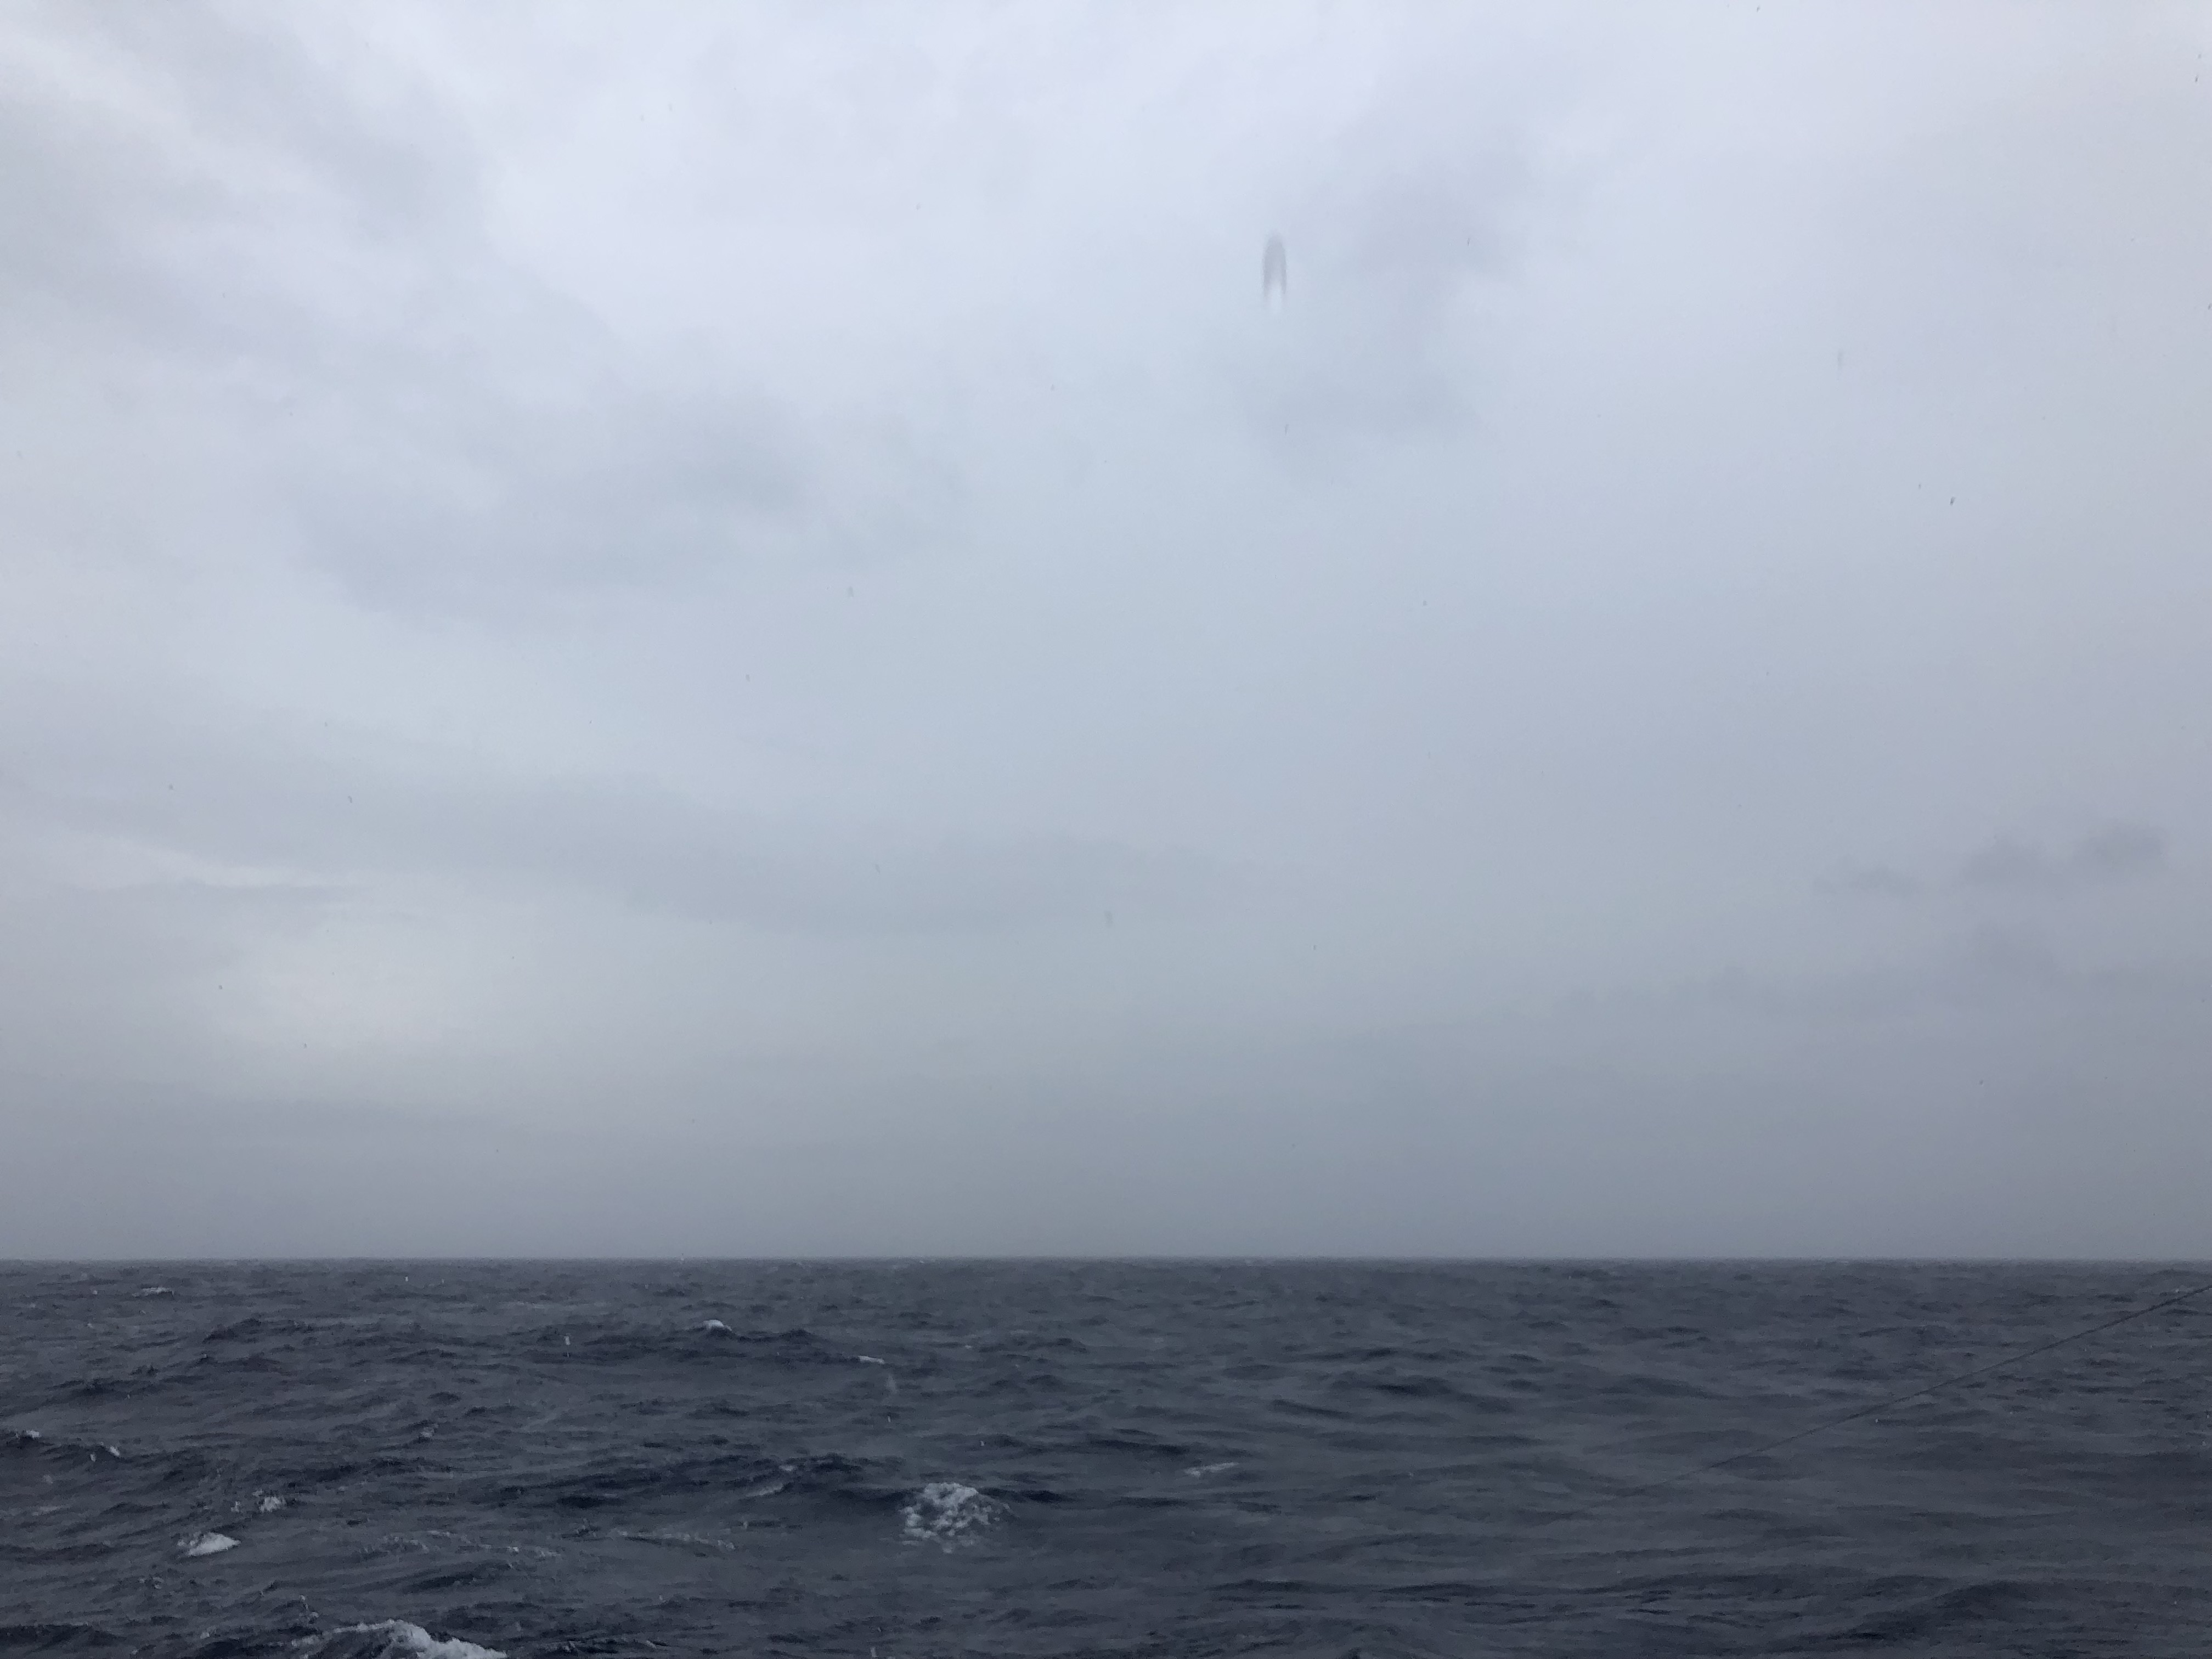
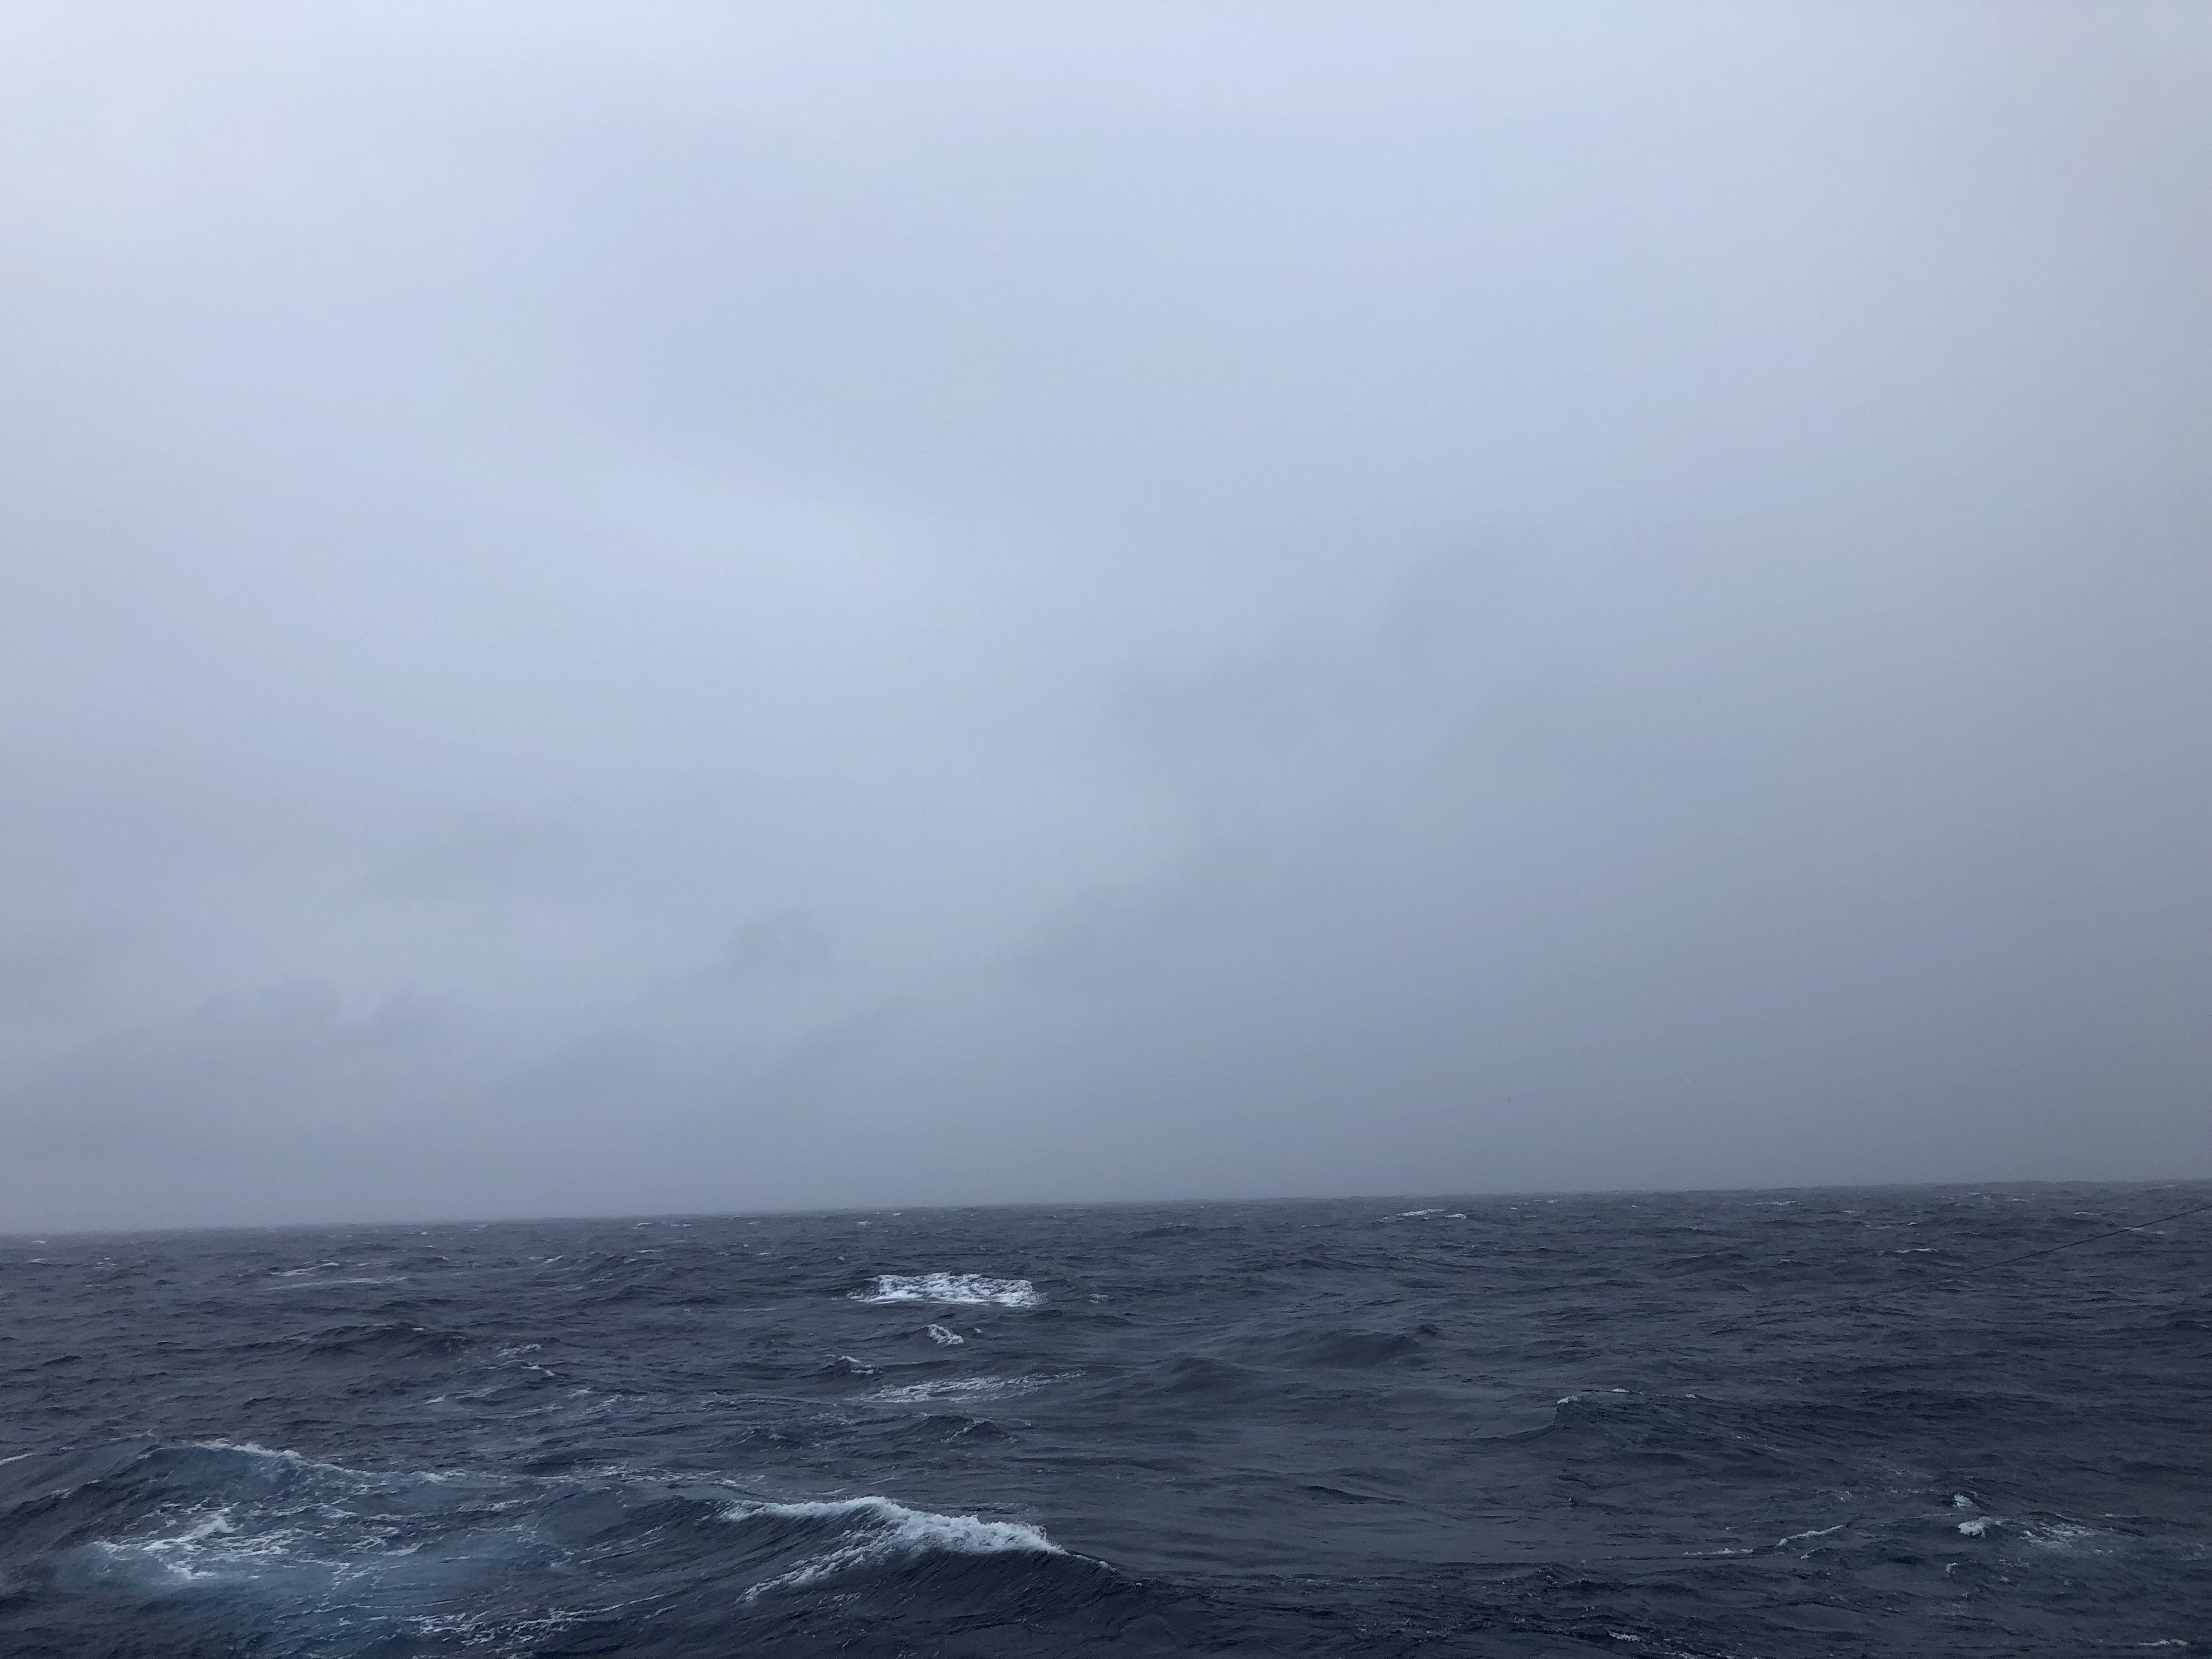
By 2230, more stratiform precipitation arrived at the ship but not in a configuration with a leading convective line. Instead, the convection was embedded within the broad stratiform region. Figure 7 plots the port side ship-based wind speed, which probably reflects the multiple rain events observed. The 50+ kt gust is visible near 16 UTC, but several other gusts occurred as well. After each wind spike, the wind expotentially decaysed to about 20 kts before rising again--perhaps at the gust front leading the repeated MCSs. Interestingly though, the 05 UTC wind spike did not occur during the arrival of any convective line. The ship was admist stratiform rainfall, although a few embedded small convective cells did pass around that time. Over the entire day, SEAPOL-derived rain estimates exceeded 100 mm in much of the domain as the ship sailed slowly southwestward. HSRL was attenuated by ice at 5 km for most of the day; however, it did provide a brief glimpse of high cloud between 10 and 15 km (Figure 8) around 20 UTC, which were situated above the mid level altocumuli seen in the cloud photos displayed in Figure 9, especially visible at 21 UTC.