September 4, 2018
More Rain and Weakening Westerlies
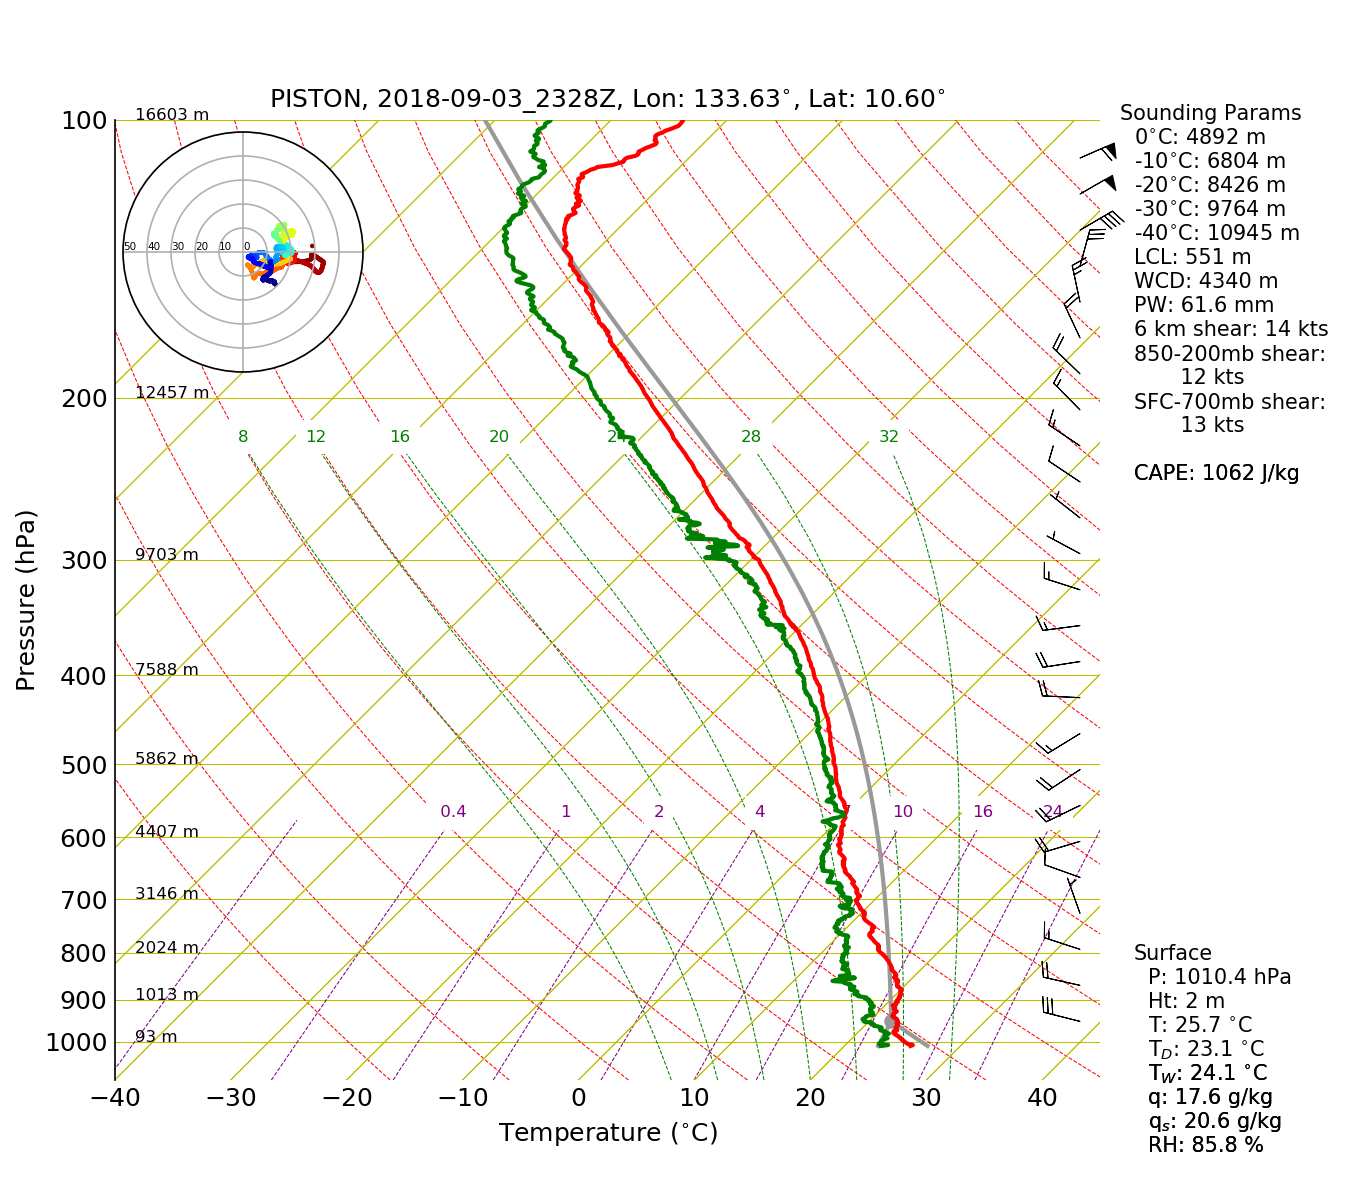
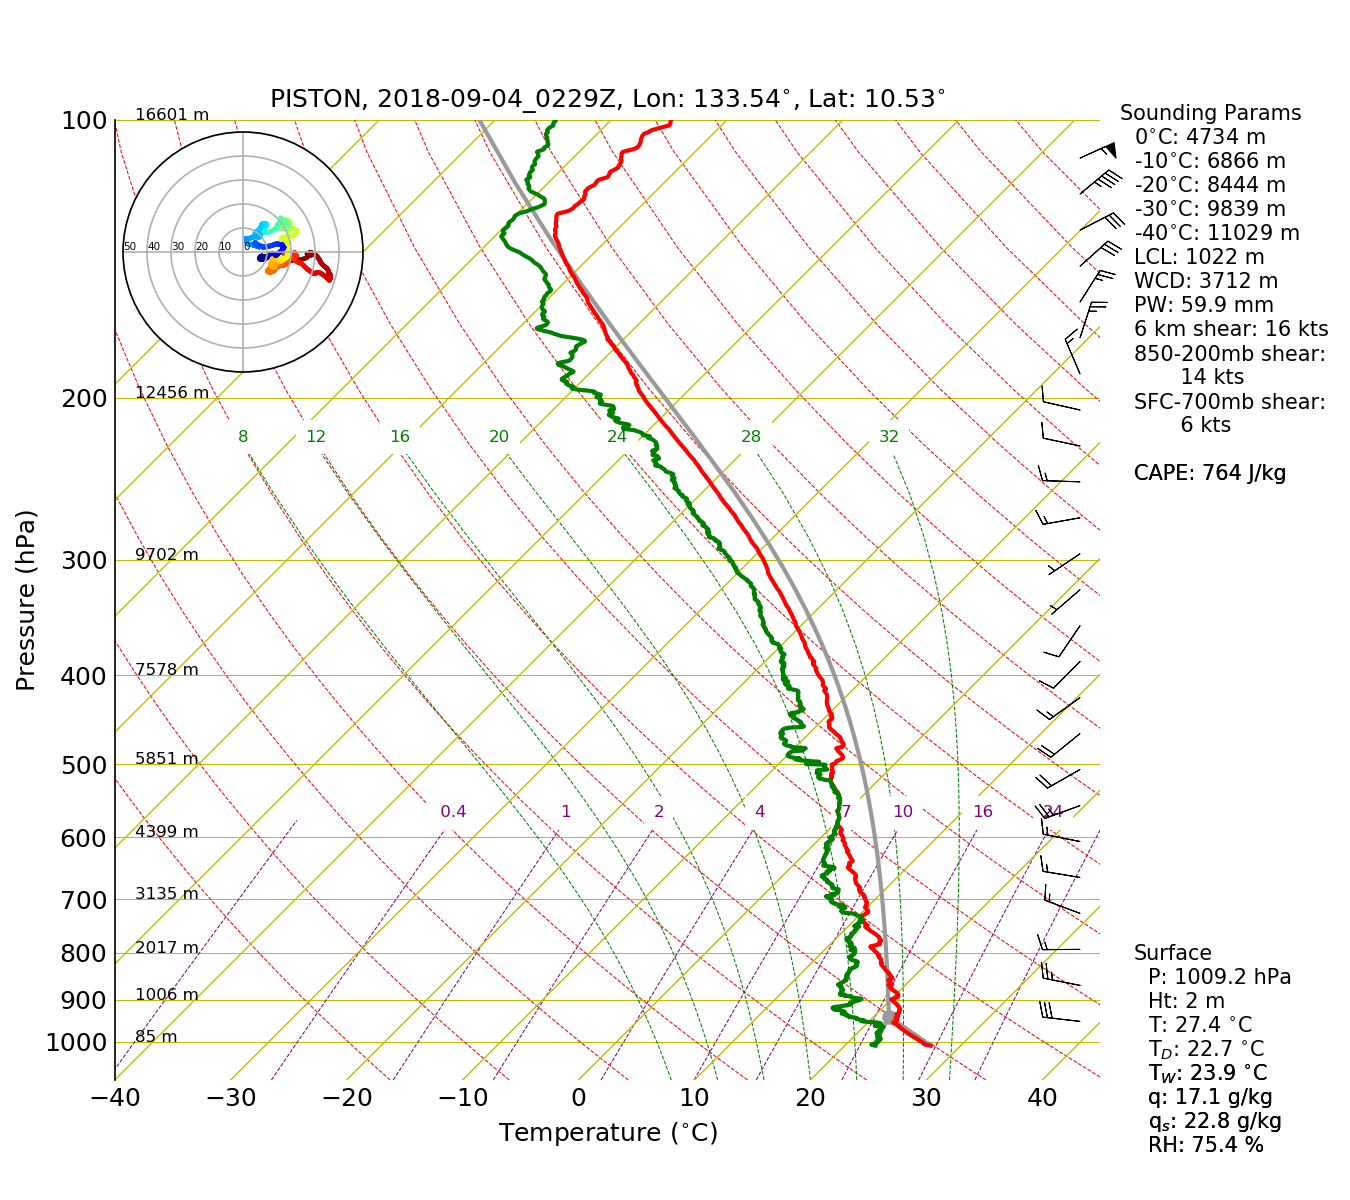
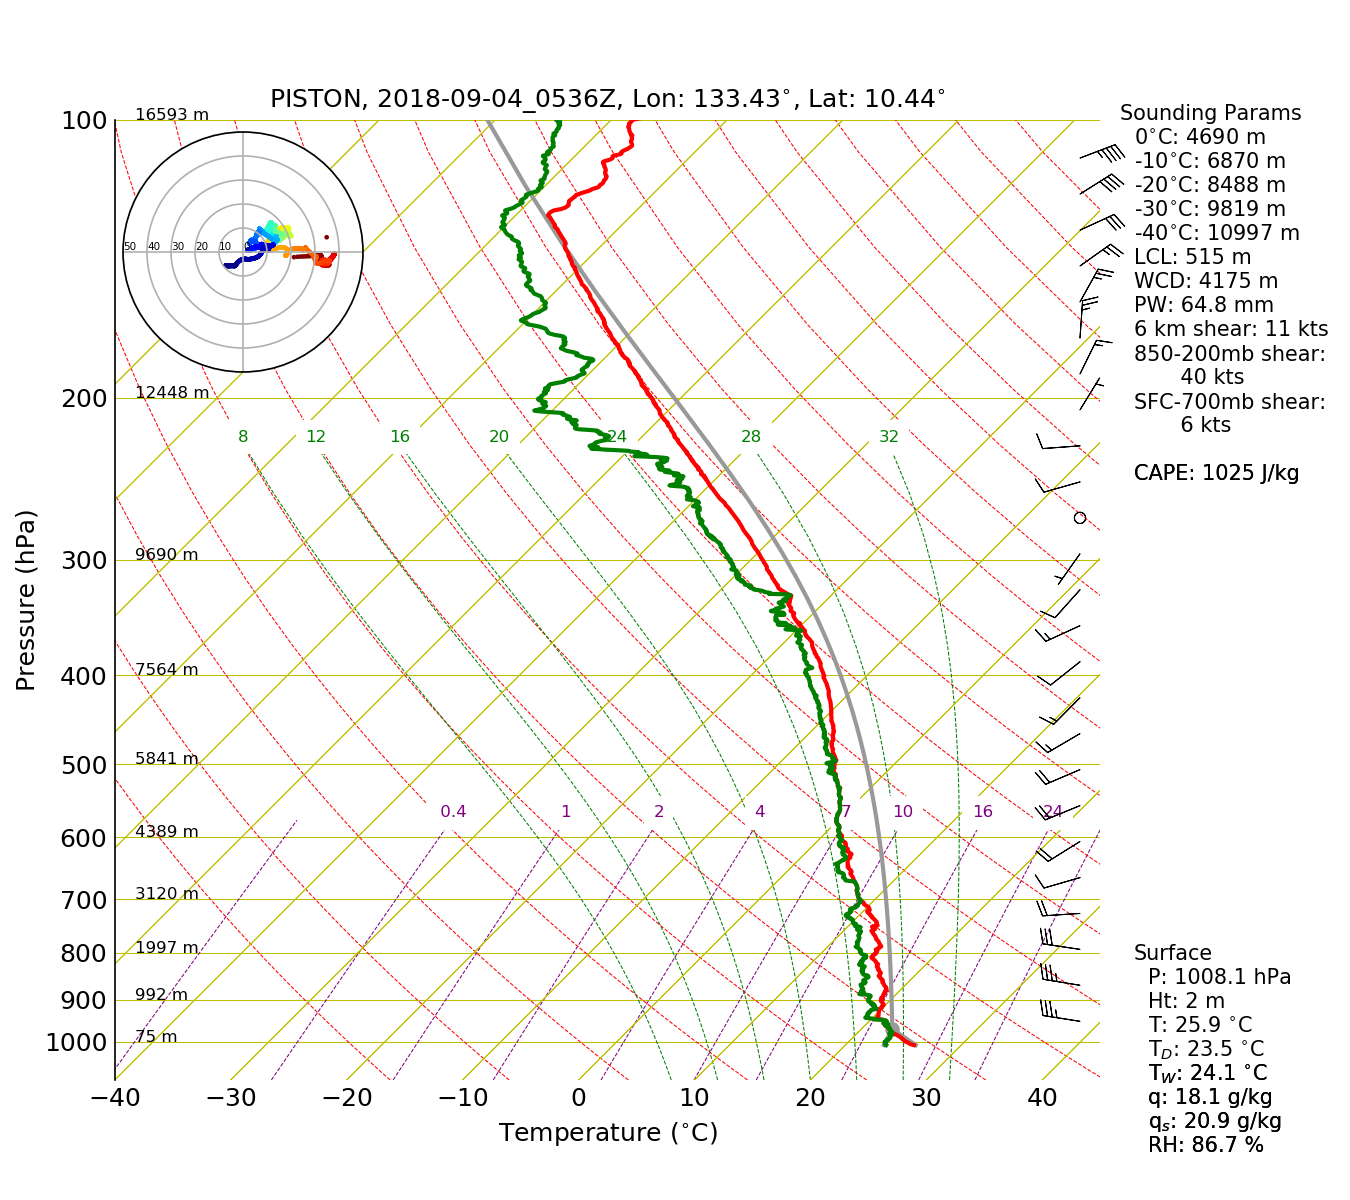
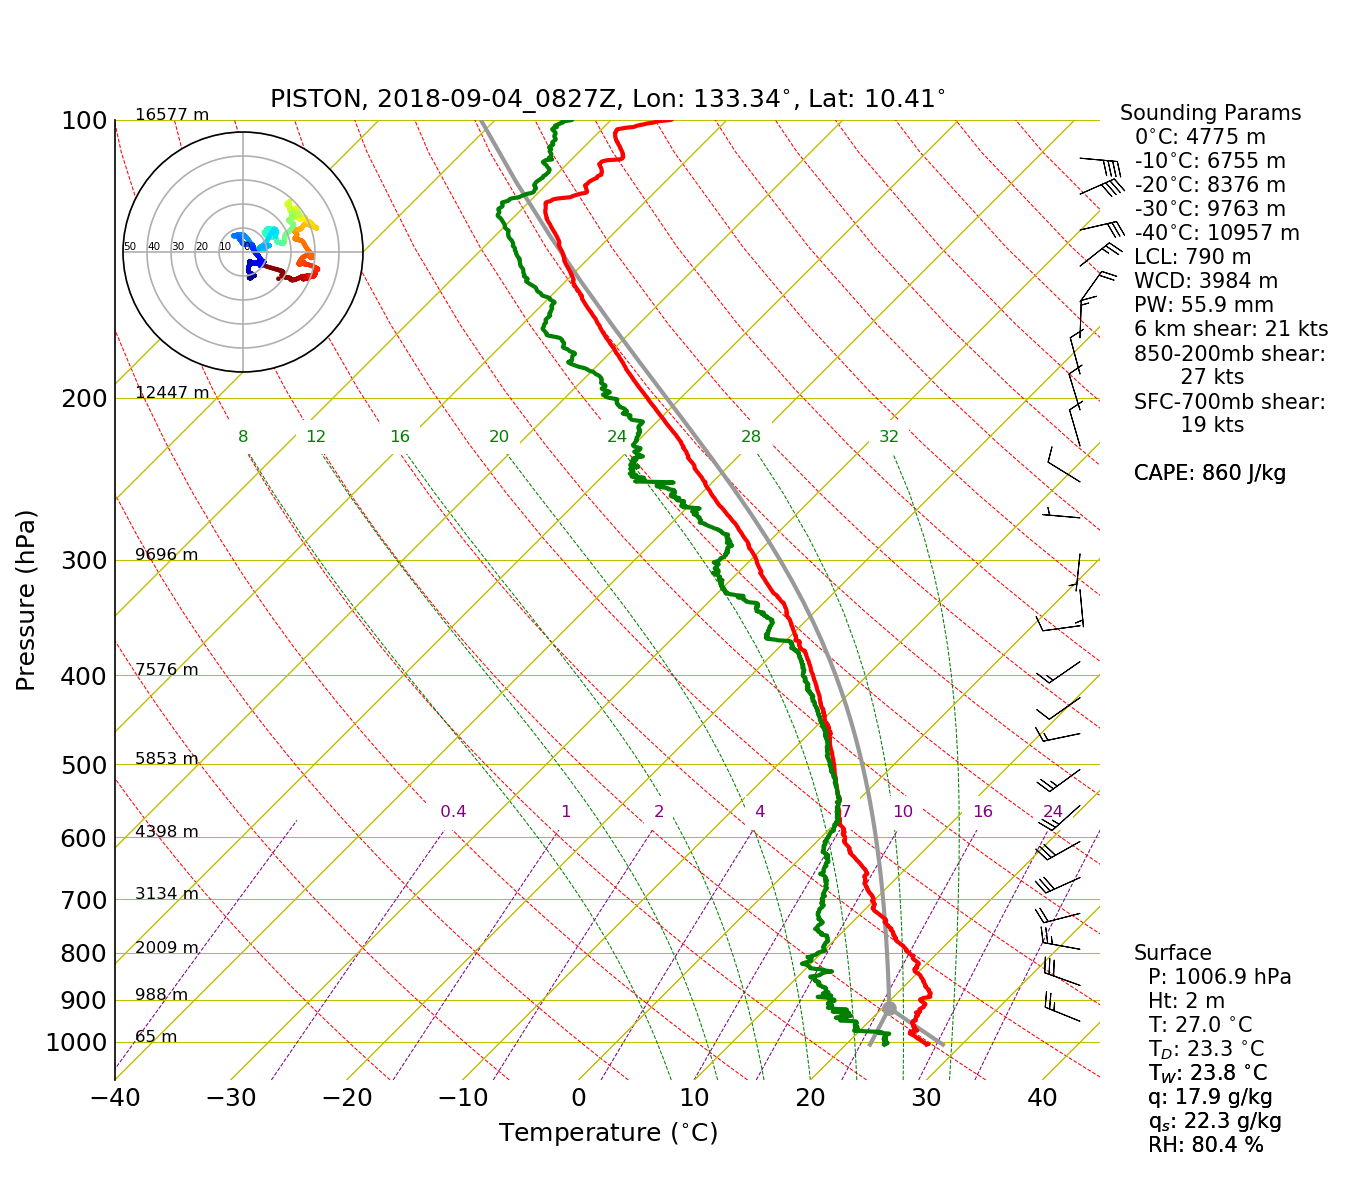
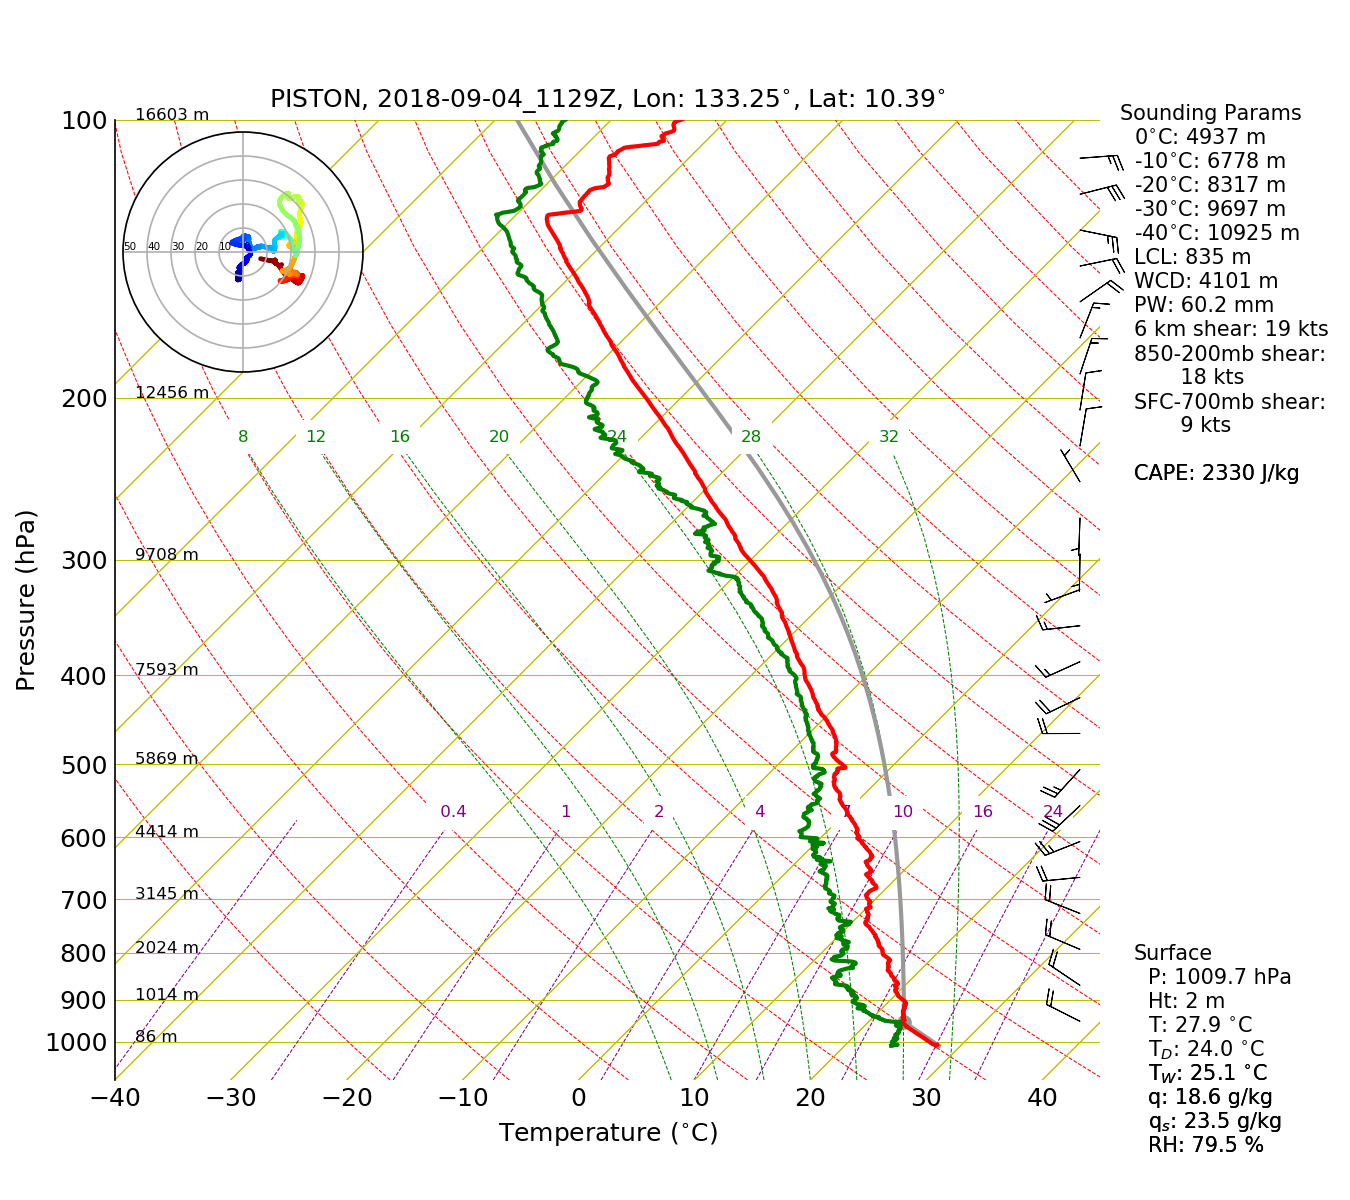
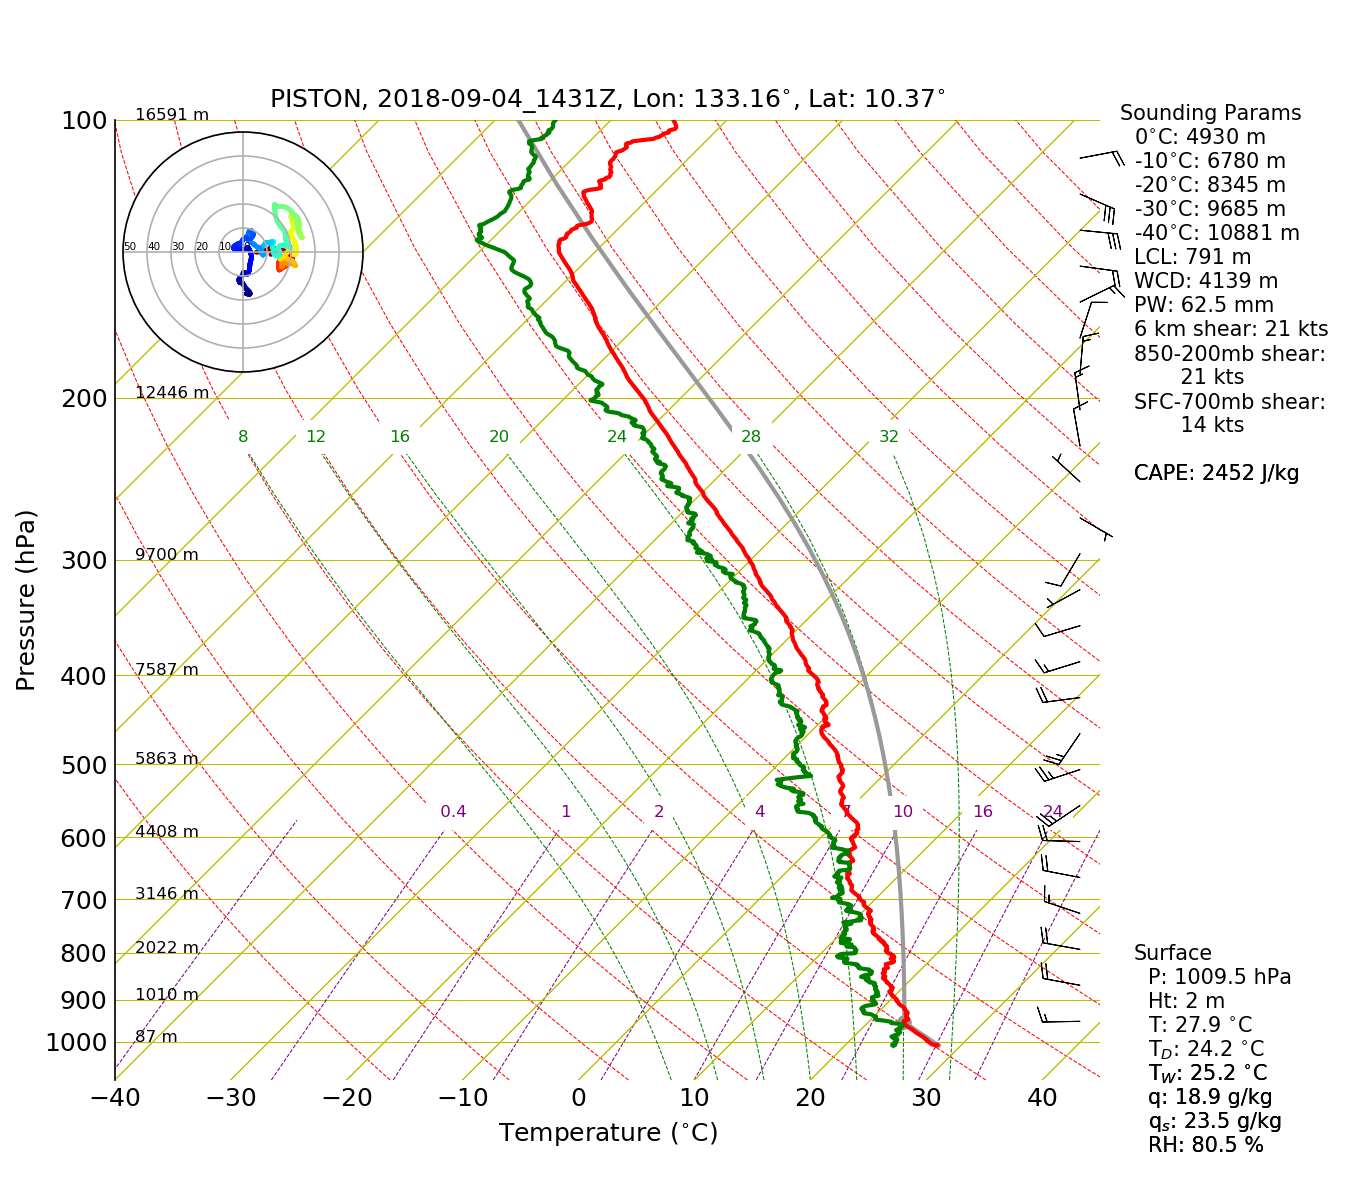
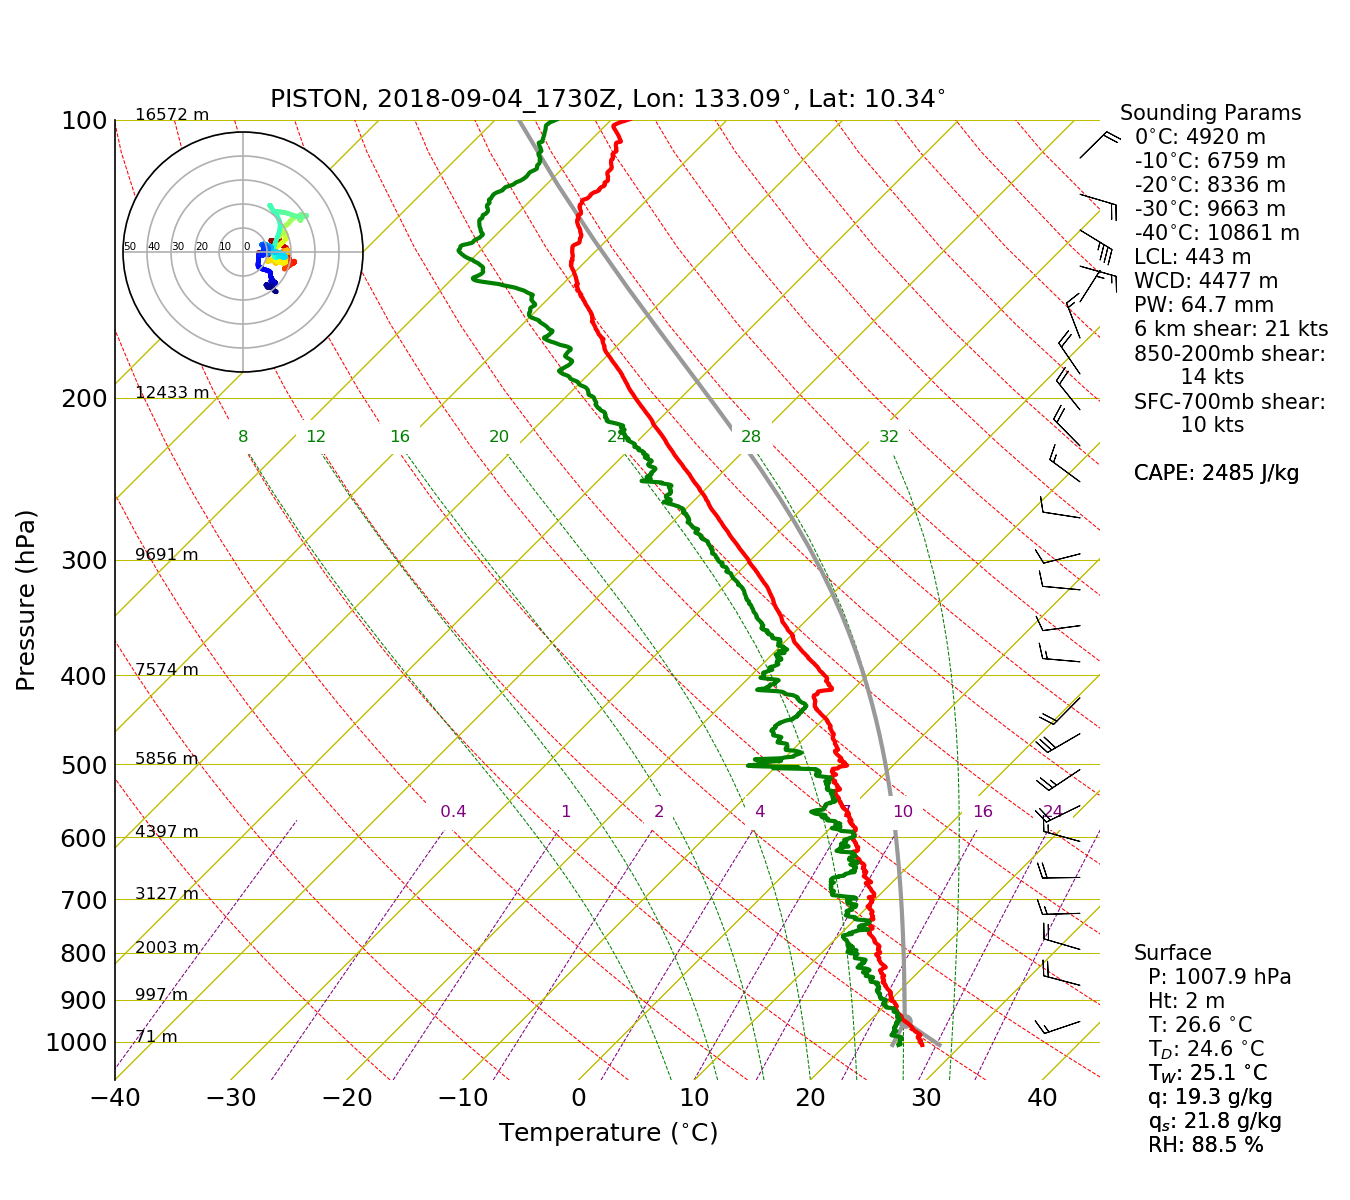
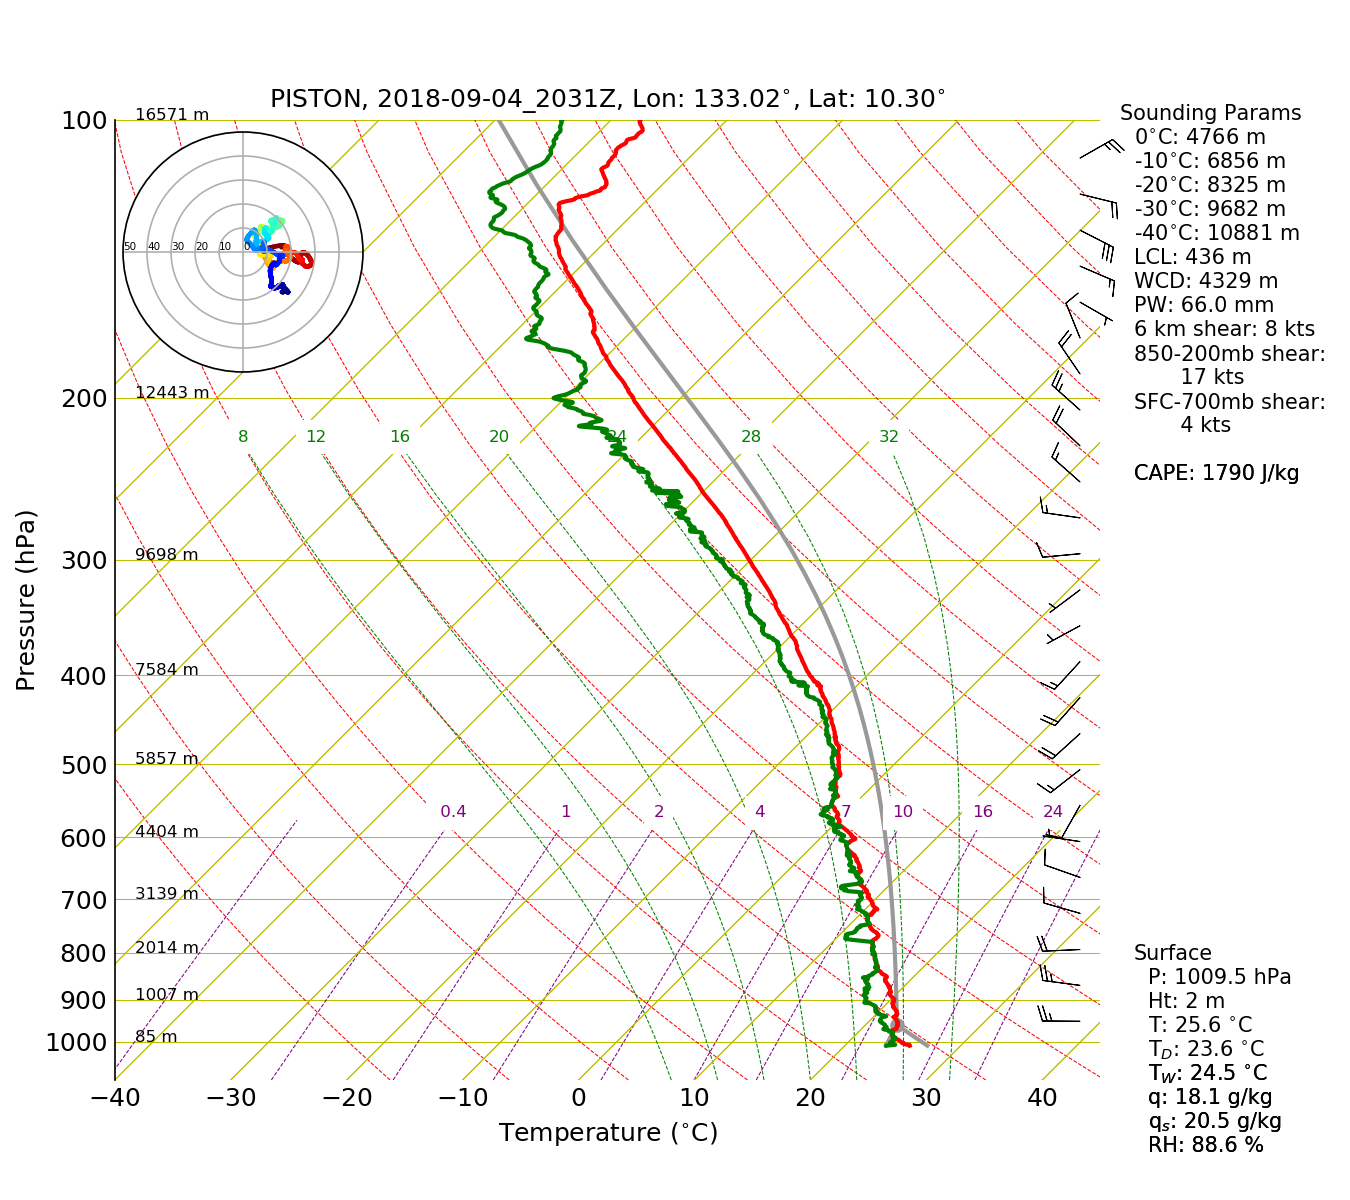
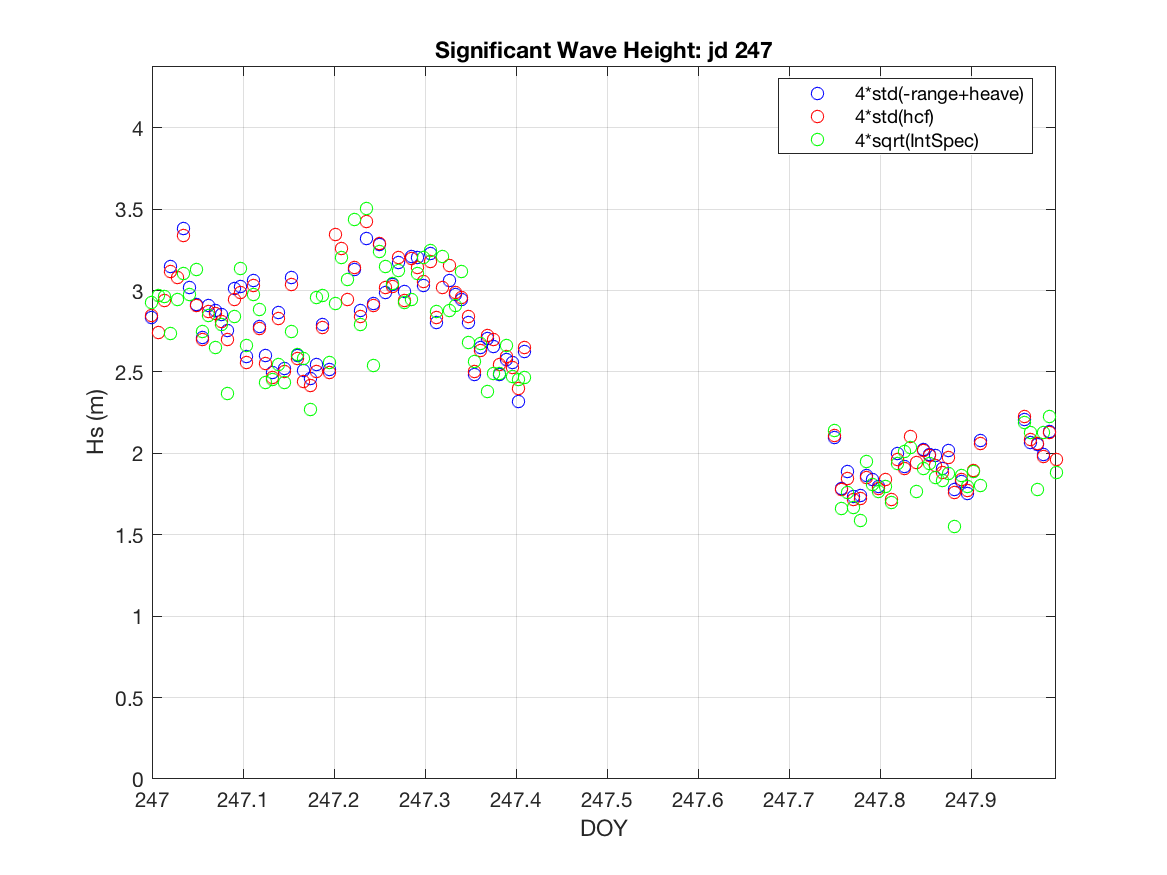
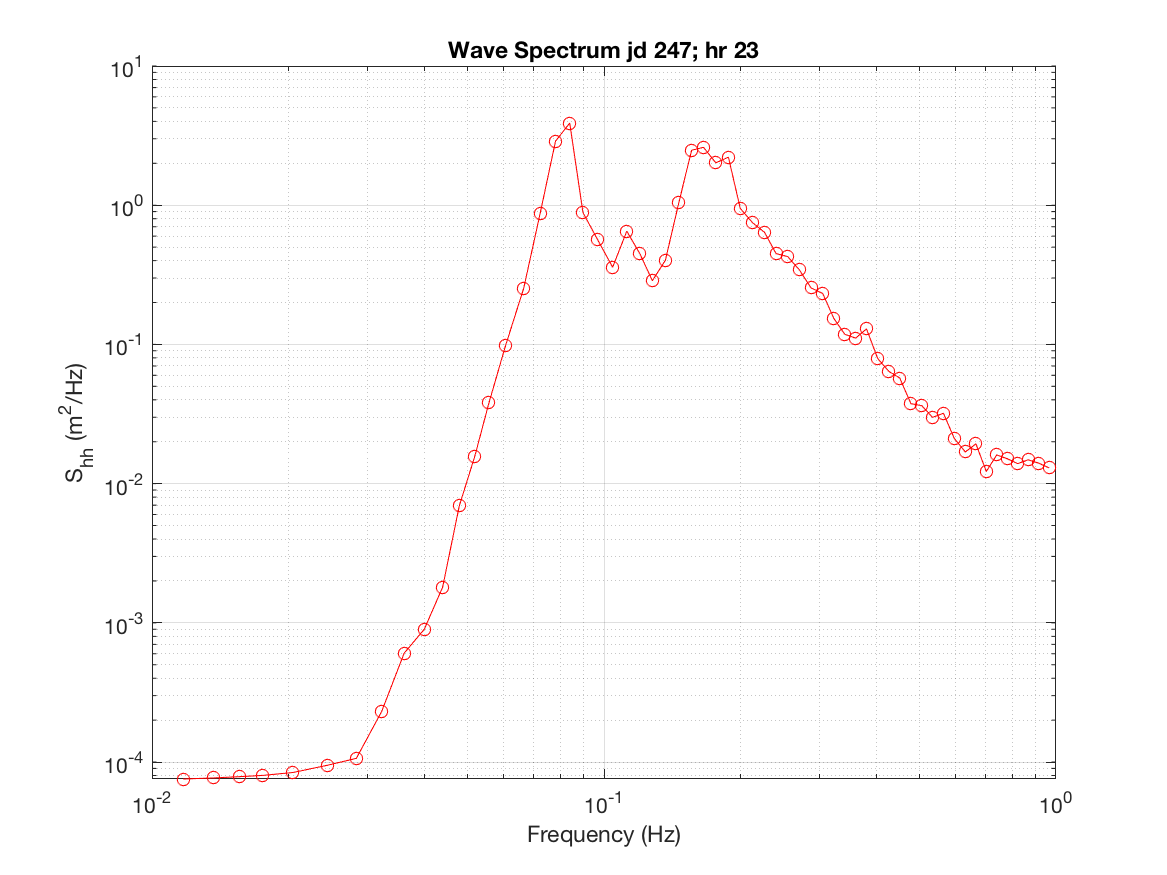
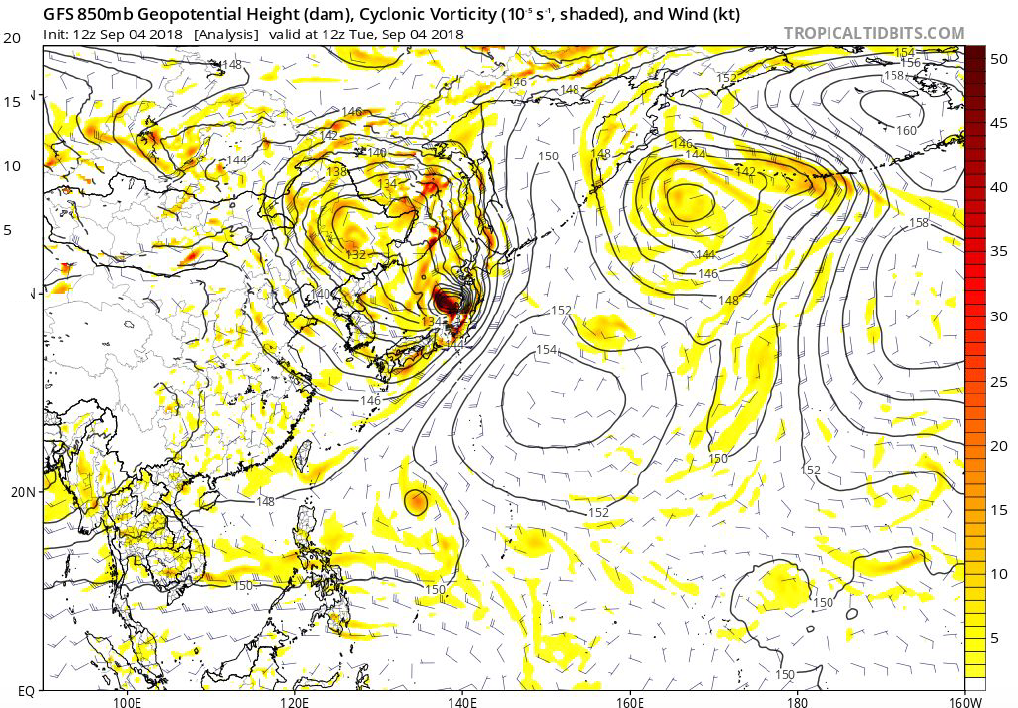
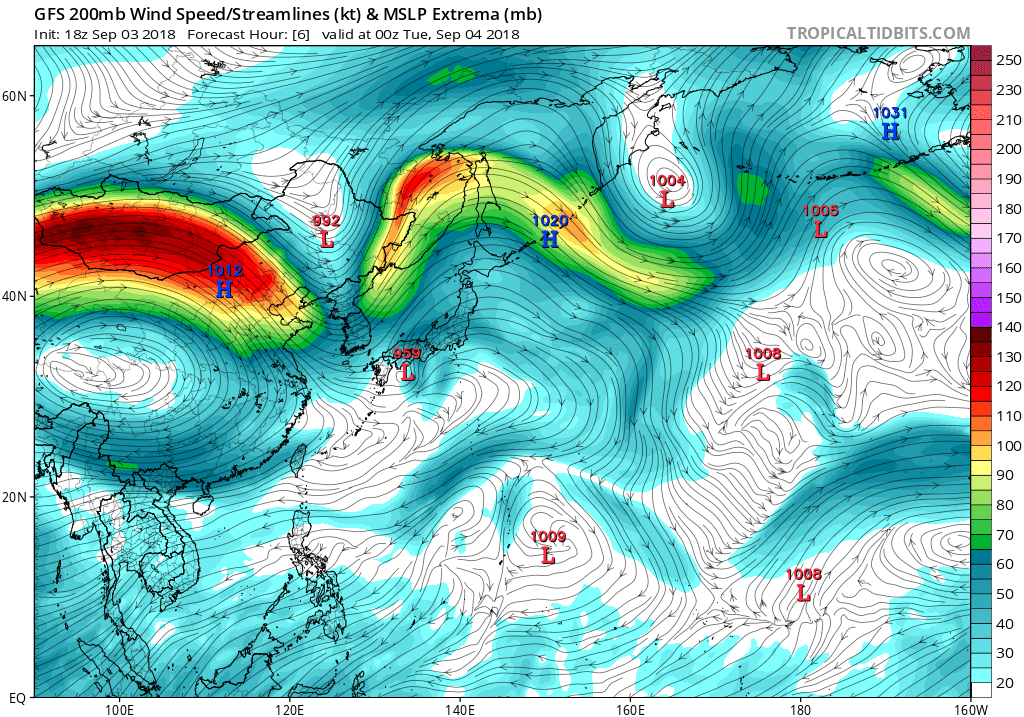
Scott Powell, Timothy Lang, Eric Maloney, Adam SobelRain continued to start the day as stratiform rainfall from the MCS passing through the previous day continued. The 00 UTC sounding (Figure 1) still showed 30 kt wind at 950 mb, and 35 kts was observed at 06 UTC, but by 21 UTC, winds had decreased to 20–25 kts. Another 40+ kt gust was observed near the ship around the time of the 06 UTC sonde launch, but no such wind was observed afterward. The waves at the ship decreased in amplitude, with significant wave heights dropping from three to two meters (Fig. 2, top). This was due in part because we are a few days removed from the passage of 25W (Jebi), reducing the swell, so that the wave energy spectrum now shows the peak associated with higher-frequency local wind-driven waves to be comparable to that associated with the swell (Fig. 2, bottom) although with the westerlies graduatlly weakening, that higher-frequency peak was also gradually decreasing in amplitude. GFS still correctly initialized ~25 kt westerlies at 850 mb over the Philippine Sea, and the westerlies extend eastward to about 140°E, where they turned into cross-equatorial flow and weakened east of 140°E (Figure 3, top). One unusual feature in today's soundings was the presence of westerlies through most of the troposphere. Winds were westerly or close to it all the way up to above 200 mb at 00 UTC. Winds were northerly at 200 mb between 09 and 15 UTC but reverted to northwesterly by the end of 4 September. Interestingly, GFS did not properly initialize westerlies at 200 mb at 00 UTC (Figure 3, bottom); perhaps the feature existed only on the mesoscale.
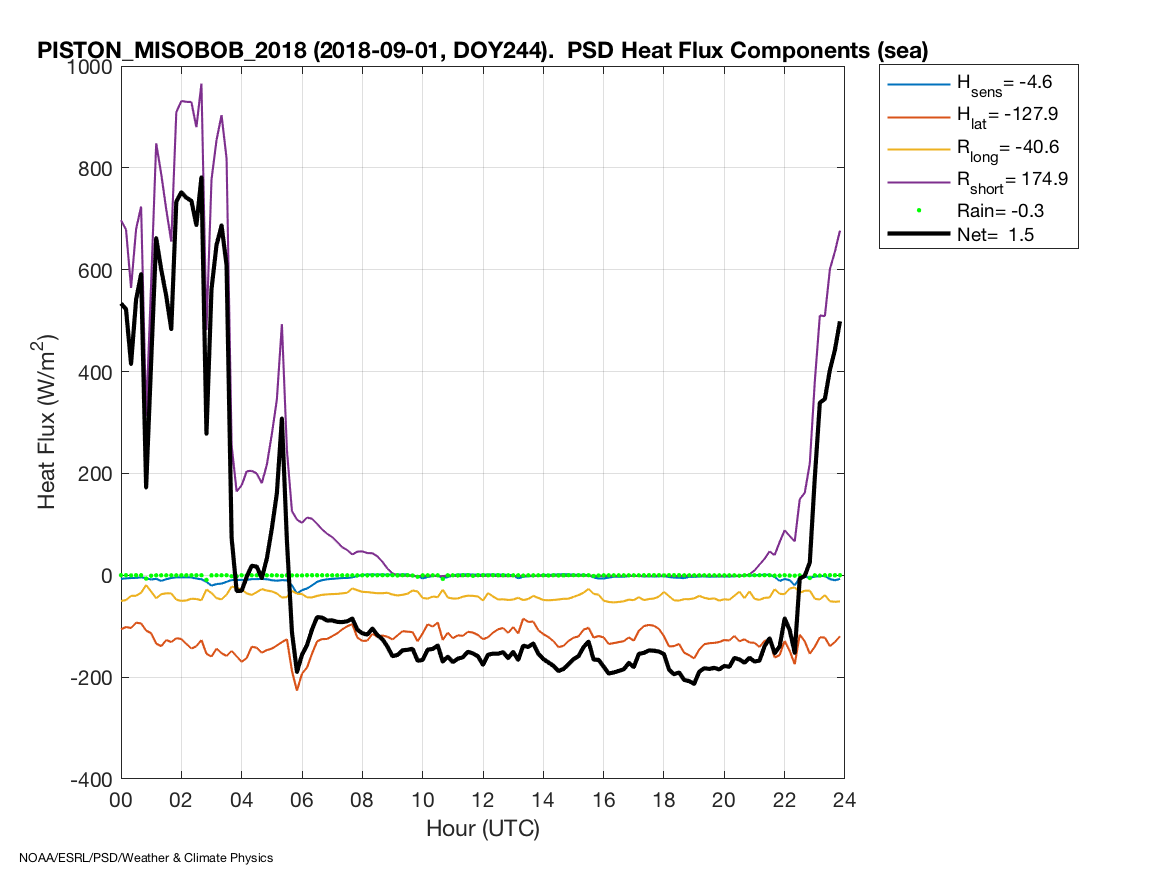
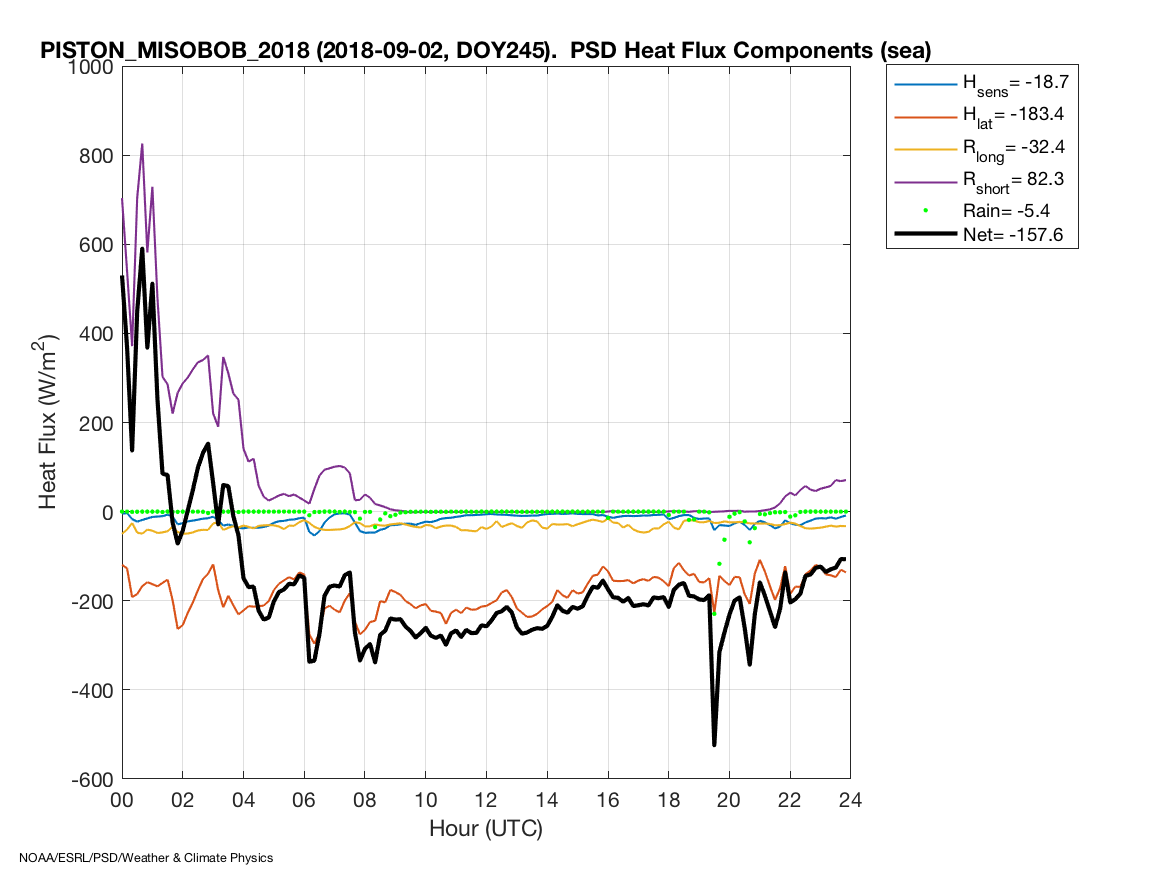
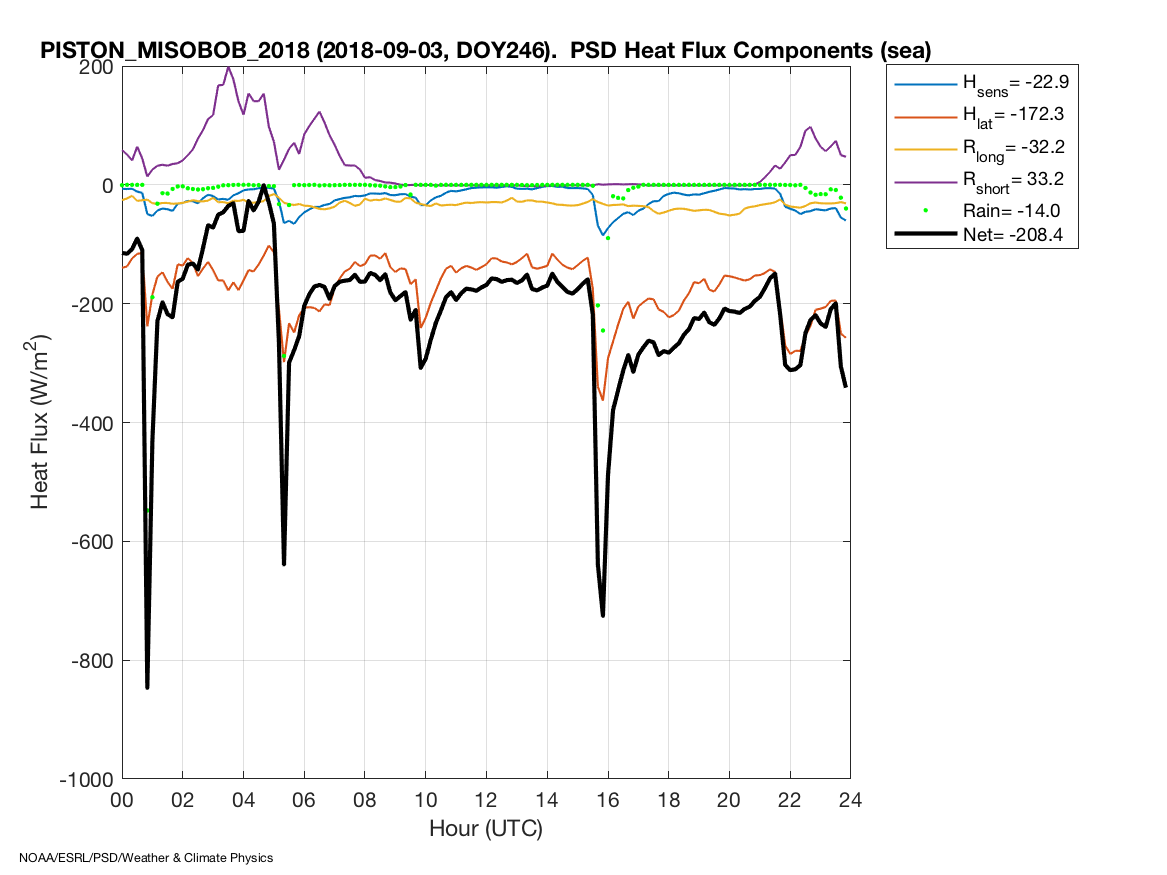
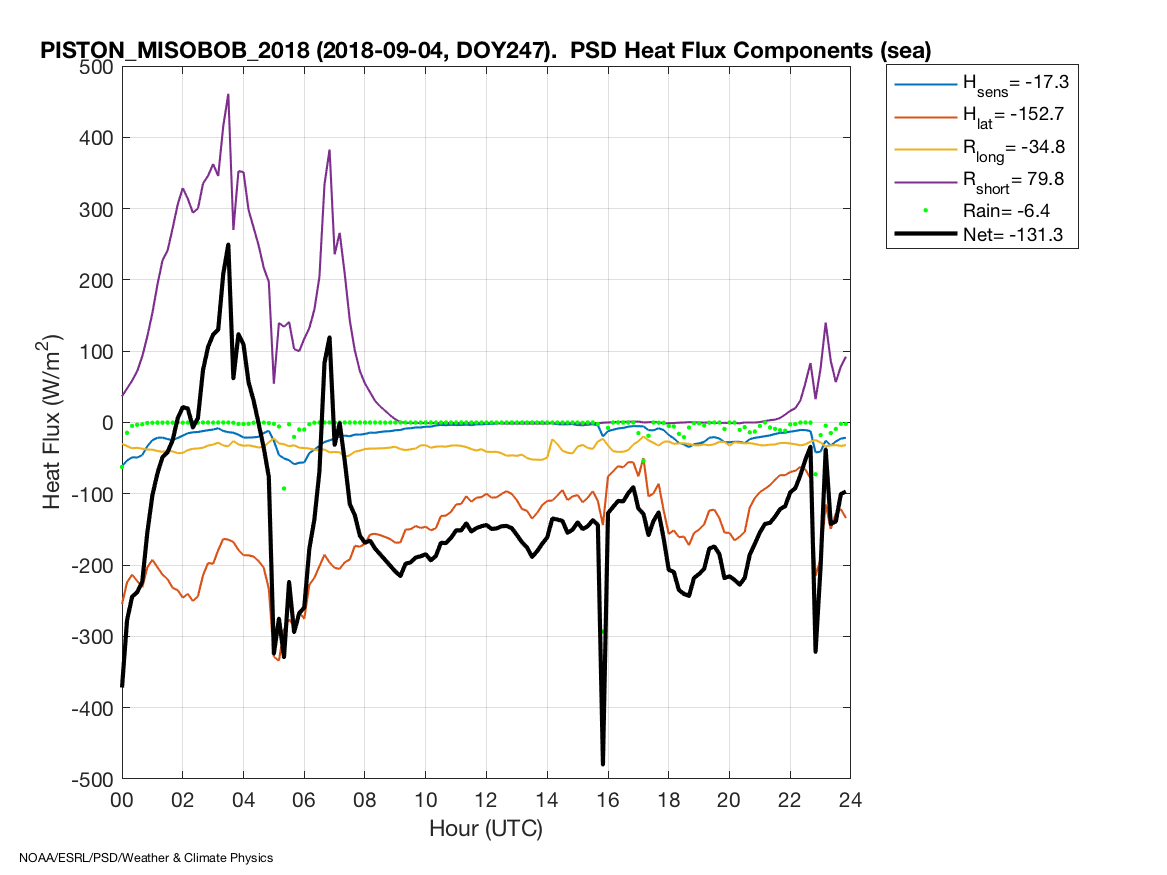
The strong winds over the past several days have resulted in substantial latent heat fluxes from the ocean to the atmosphere as displayed in Figure 4. On 2, 3, and 4 September, respectively, the latent heat flux (red line) was, on average, estimated at 183, 172, and 153 W/m^2 from the ocean. (Note the spikes observed on 3 September, which correspond to the spikes in winds noted in that report). Because of the persistent cloud cover, insolation has been reduced, and combined with the high winds have led to a net flux of energy (black line) out of the ocean.
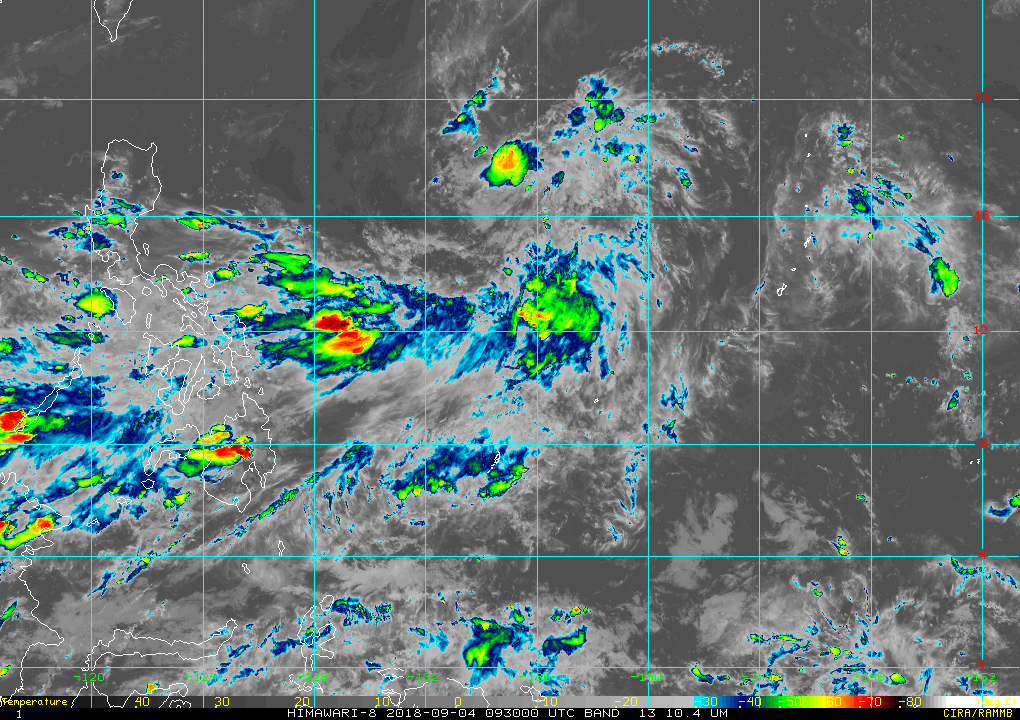
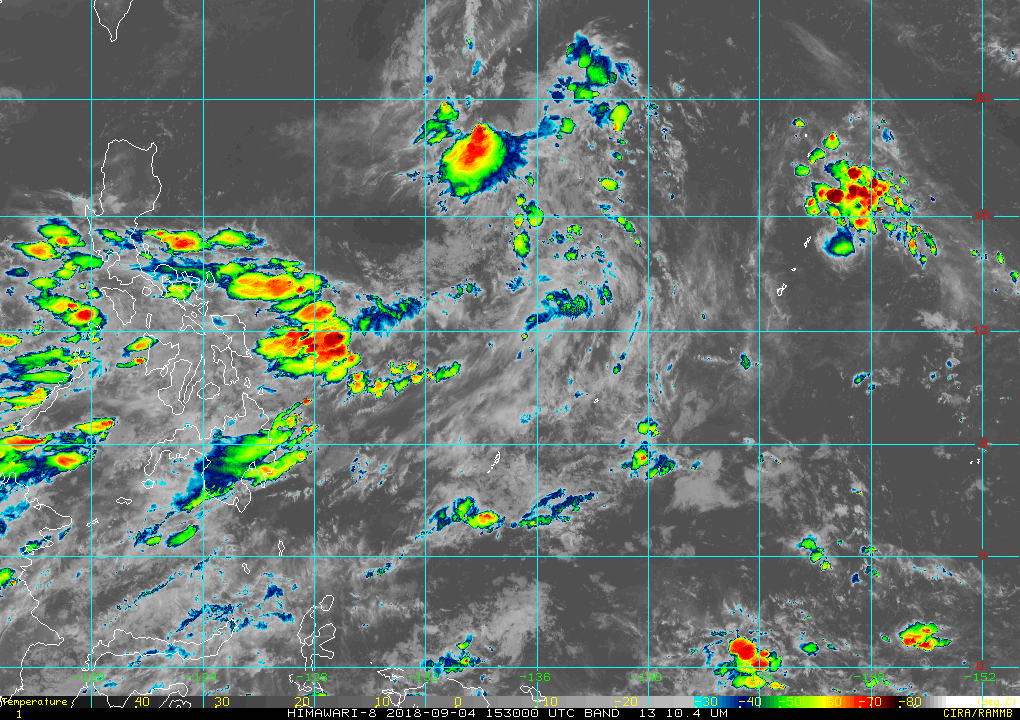
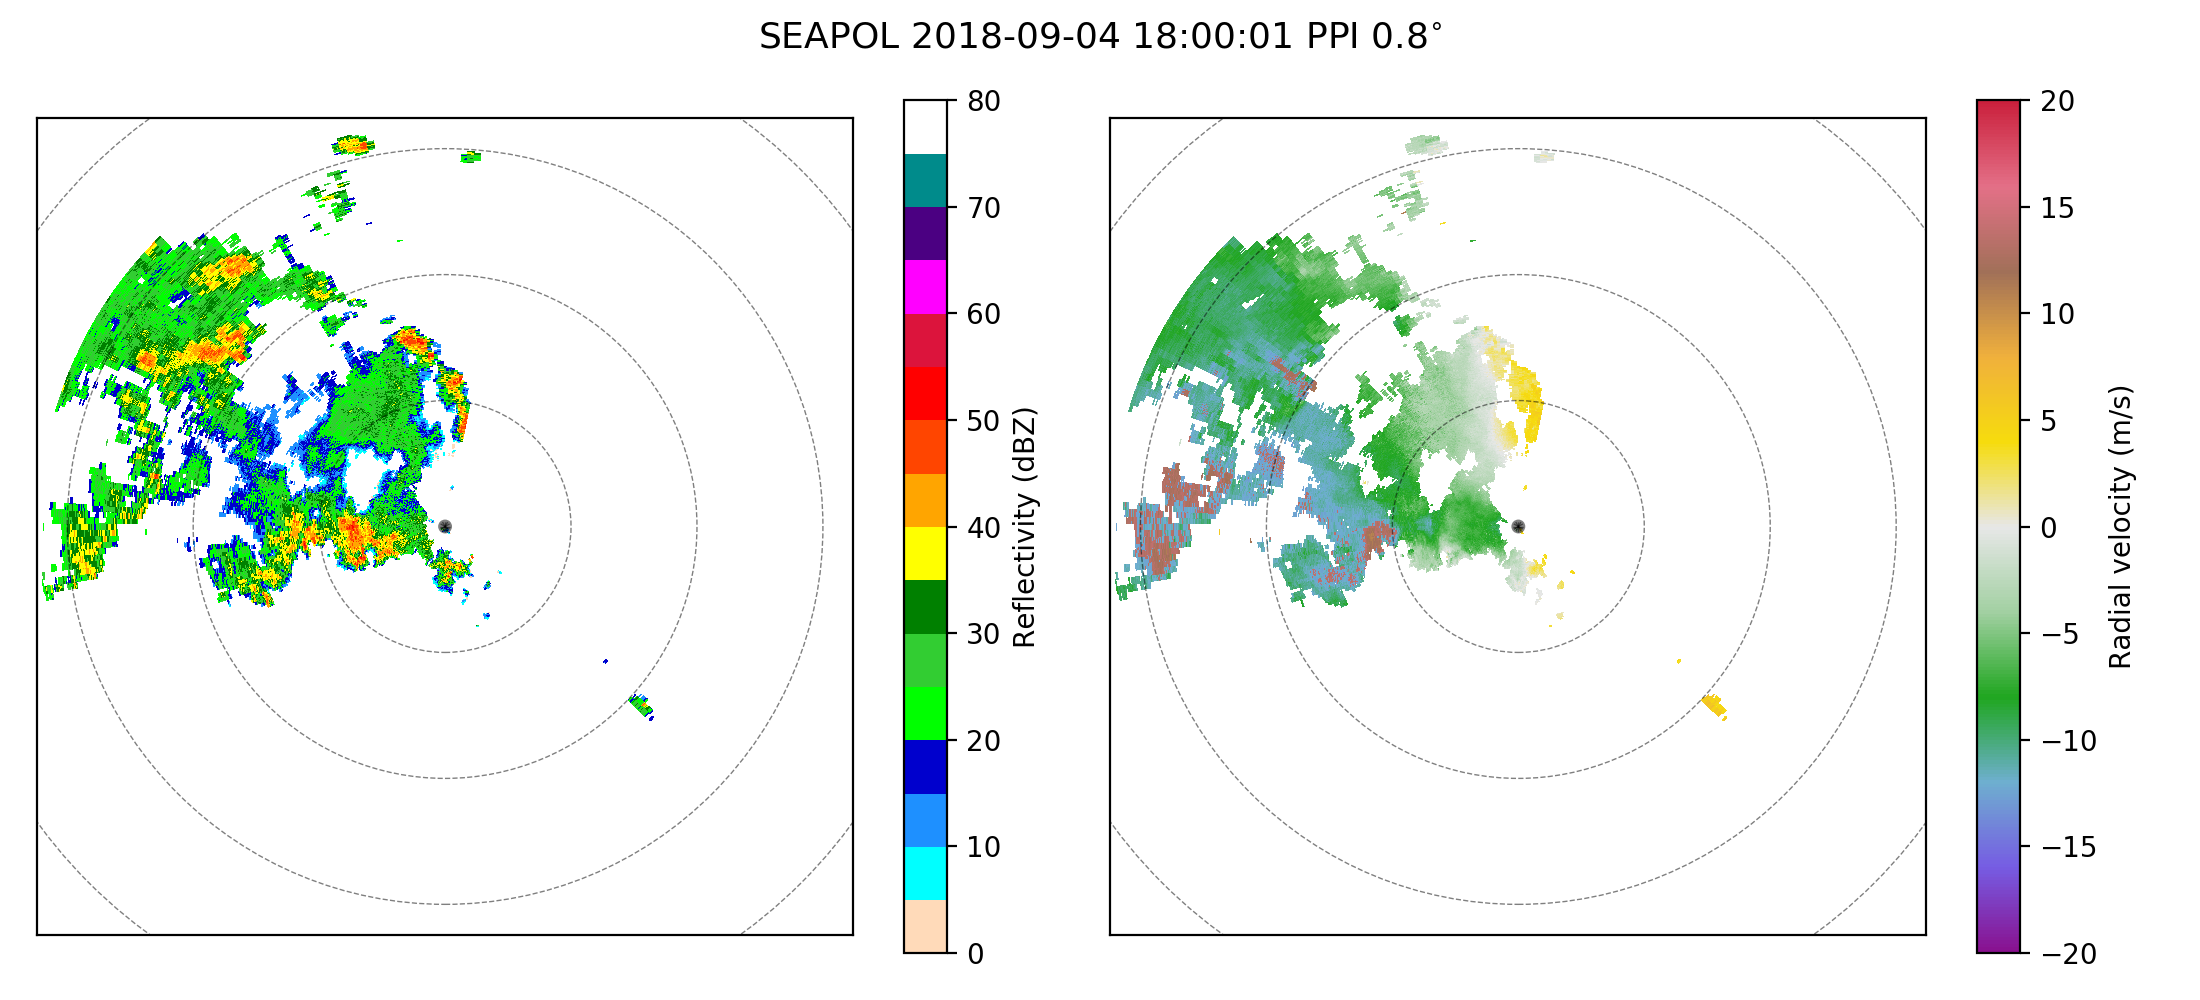
A ribbon of cyclonic vorticity extended from Vietnam through the Philippines between 10°N and 15°N extending to near 140°E (Figure 3), and a zonally oriented band of convection continued to fire up near 12°N east of the Philippines, as in the 0930 UTC IR image seen in Figure 5. However, by 1530 UTC, much of the convection east of 130°E weakened, except for a small band of developing isolated elements around 10.5°N near 132°E. This small area of convection would grow upscale and be captured by SEAPOL late on 4 September.
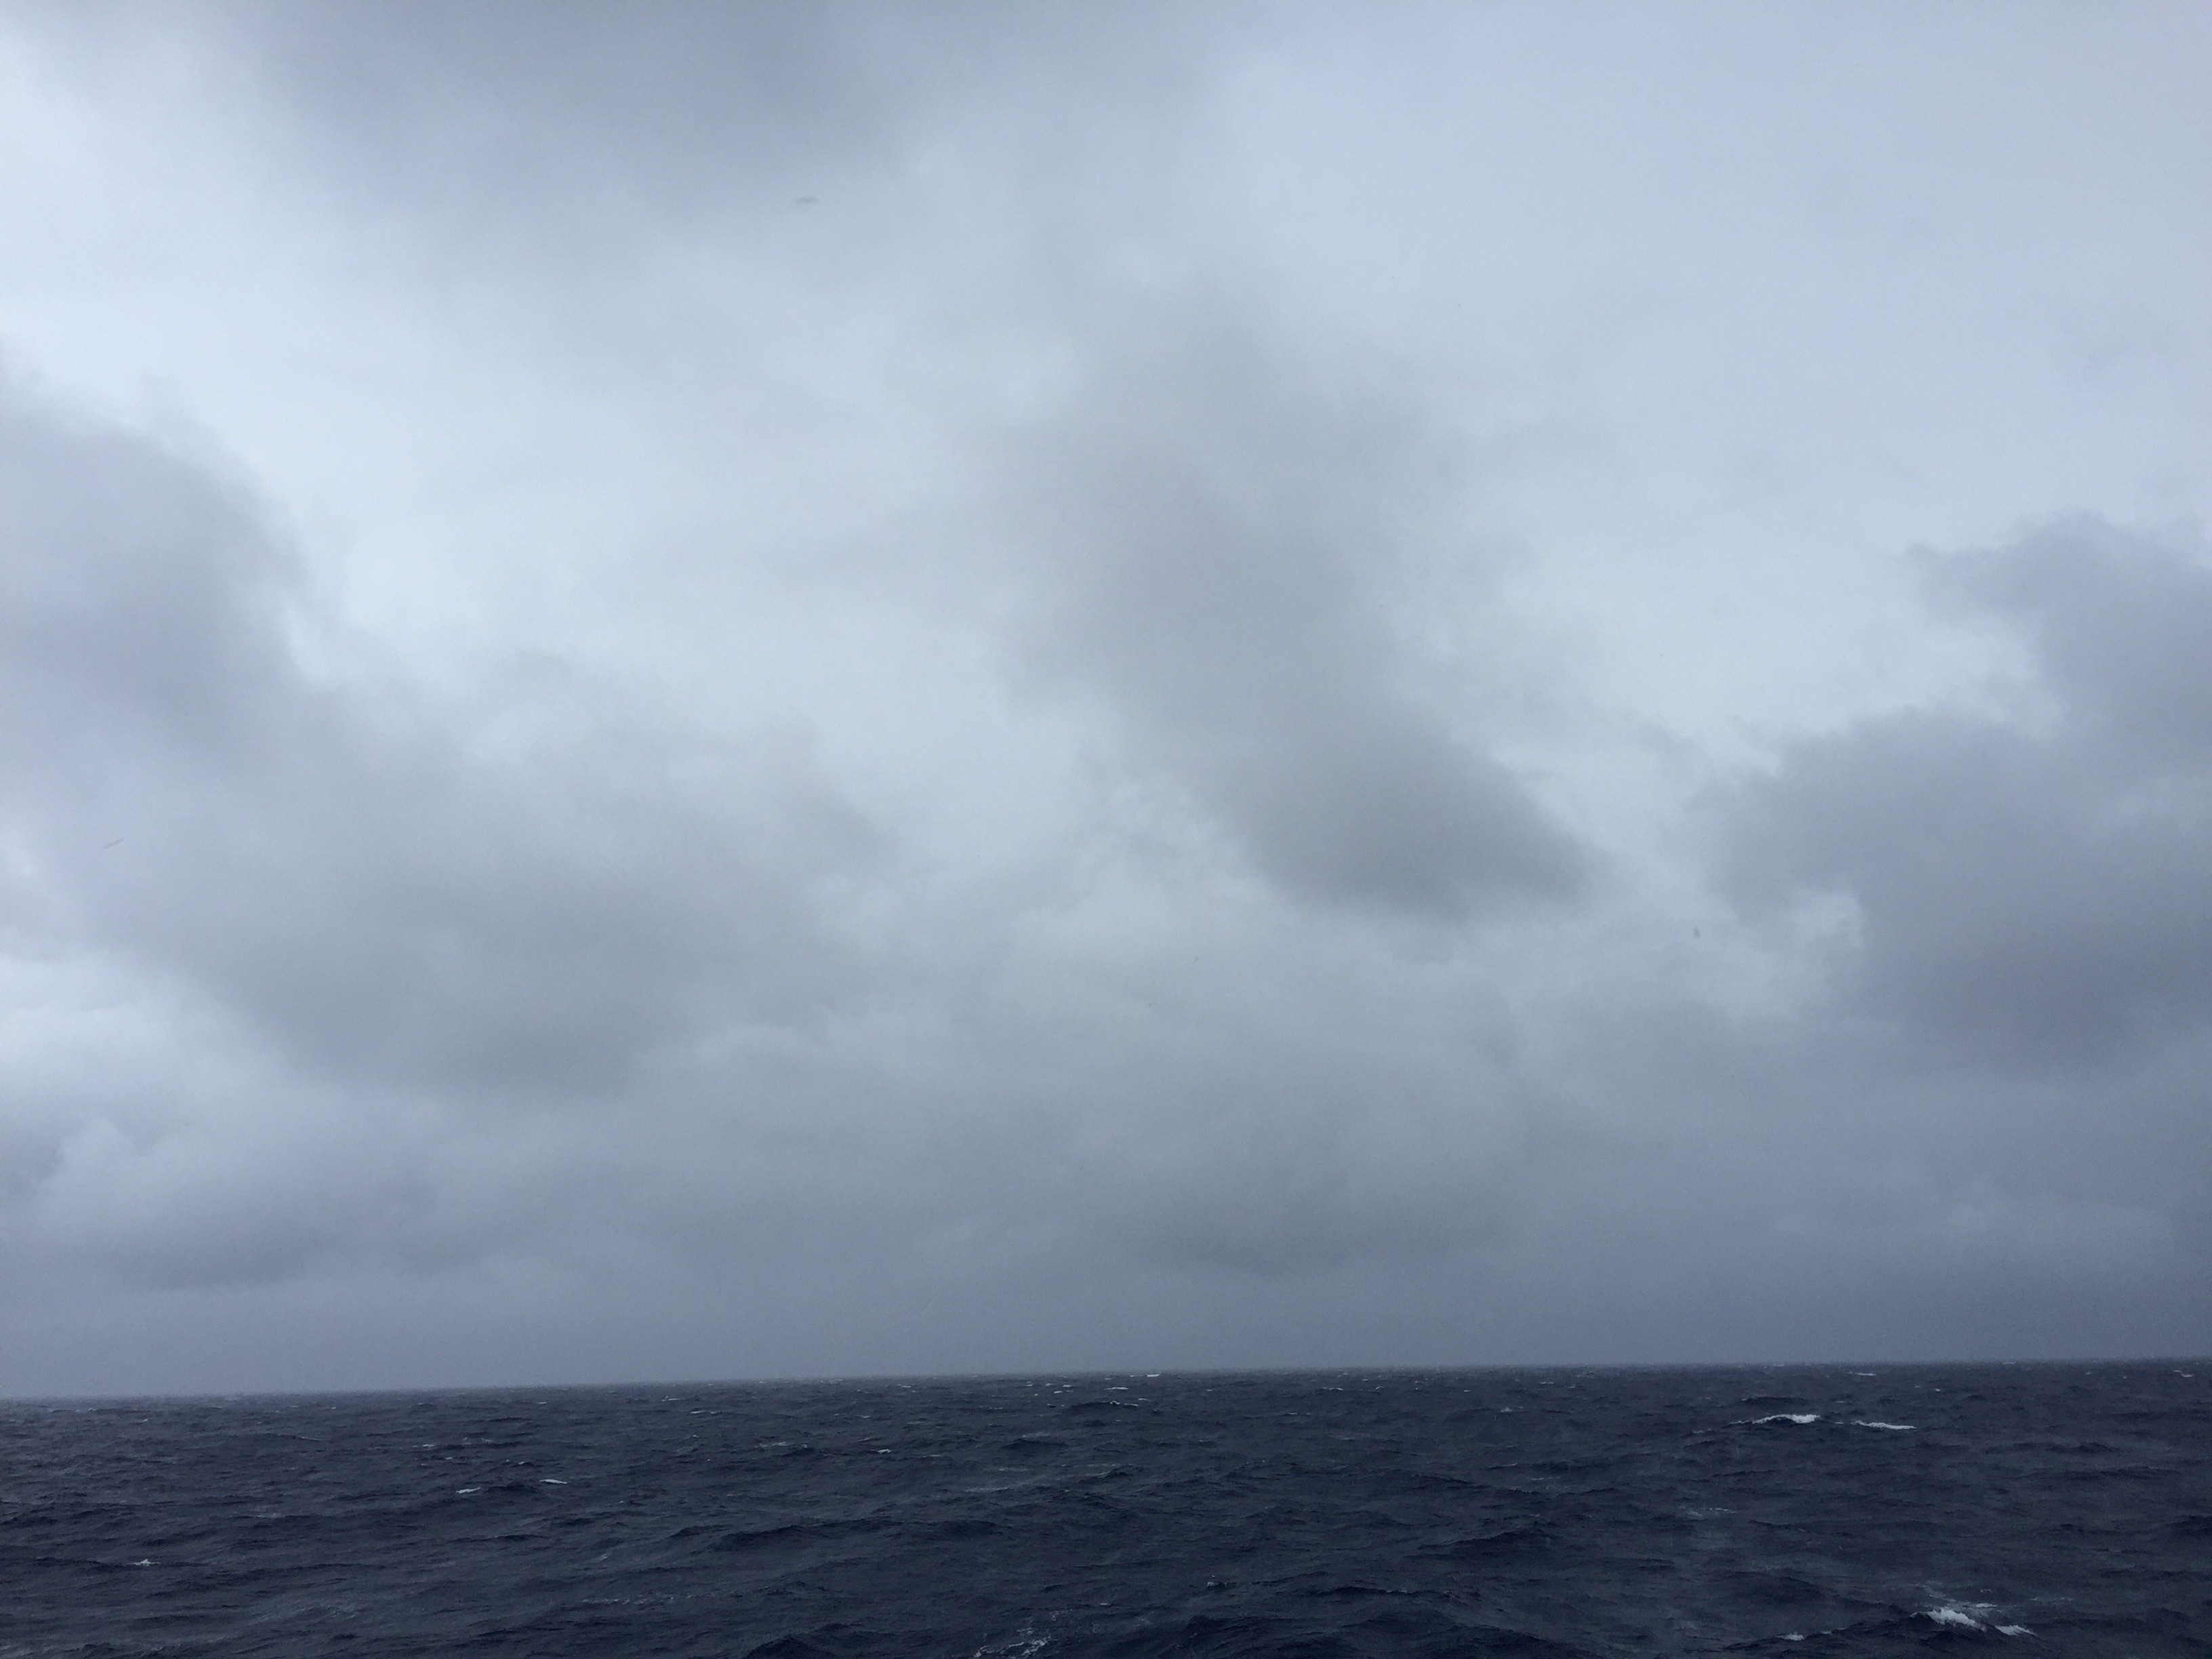
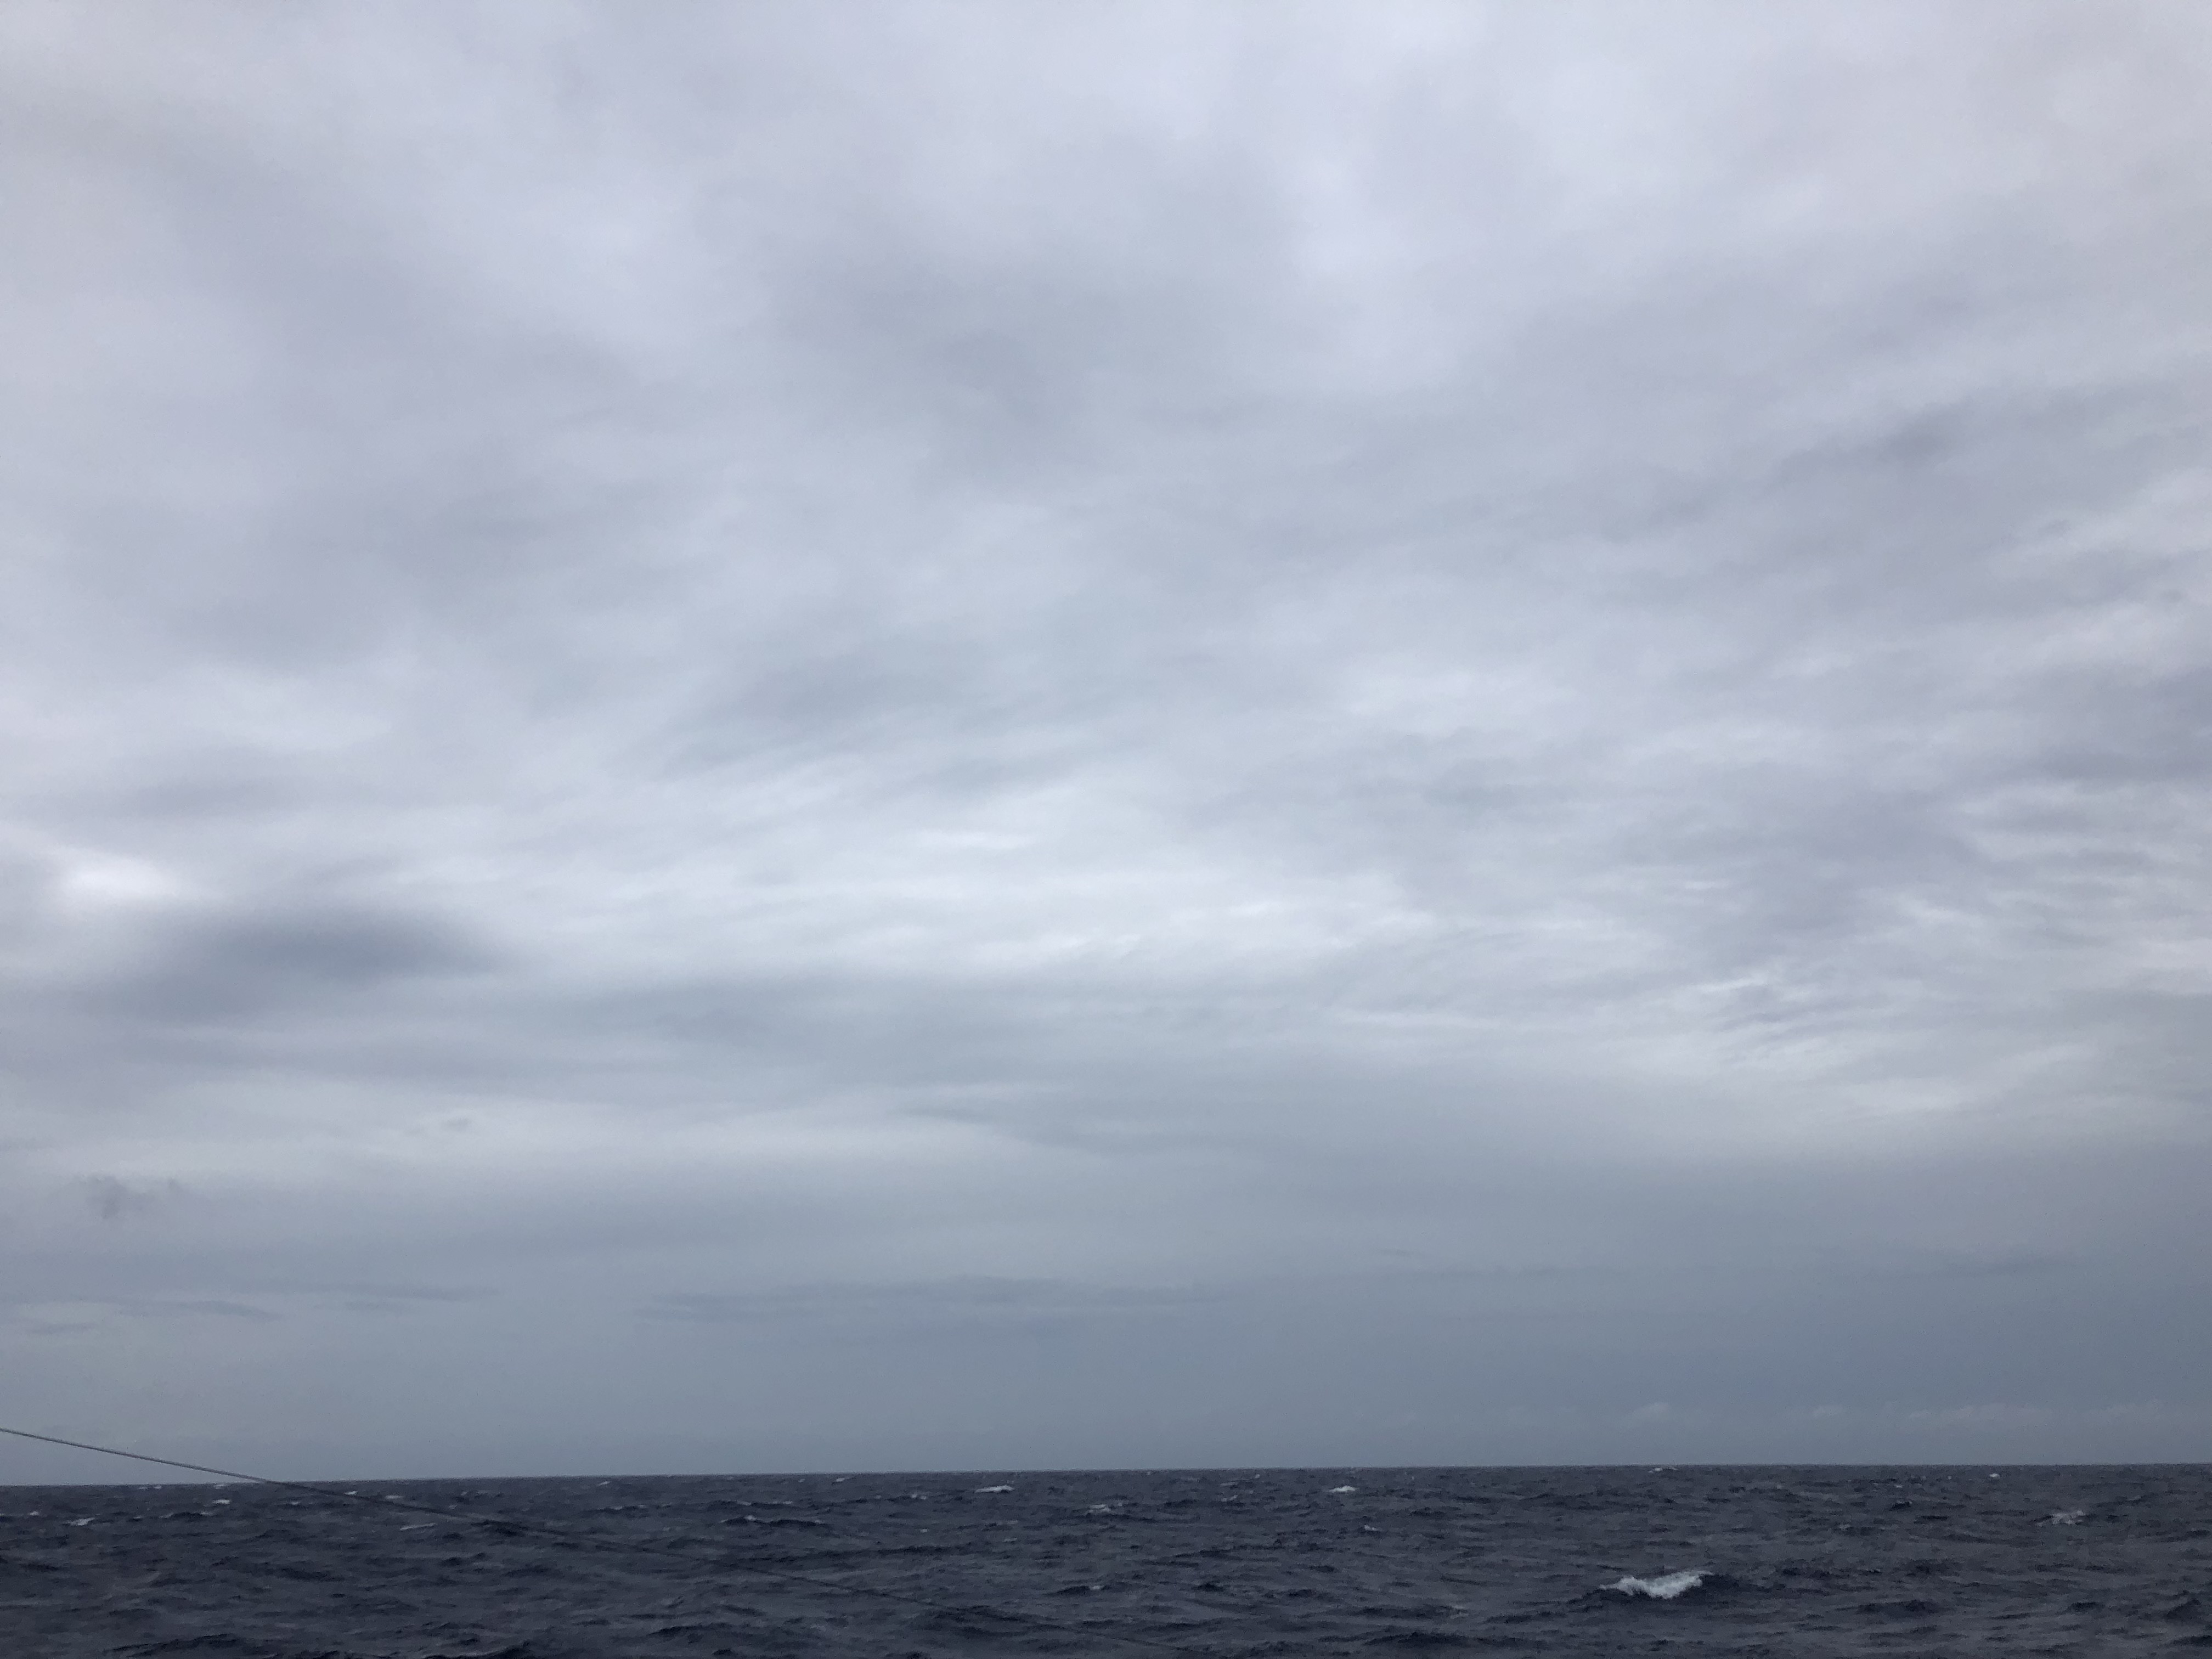
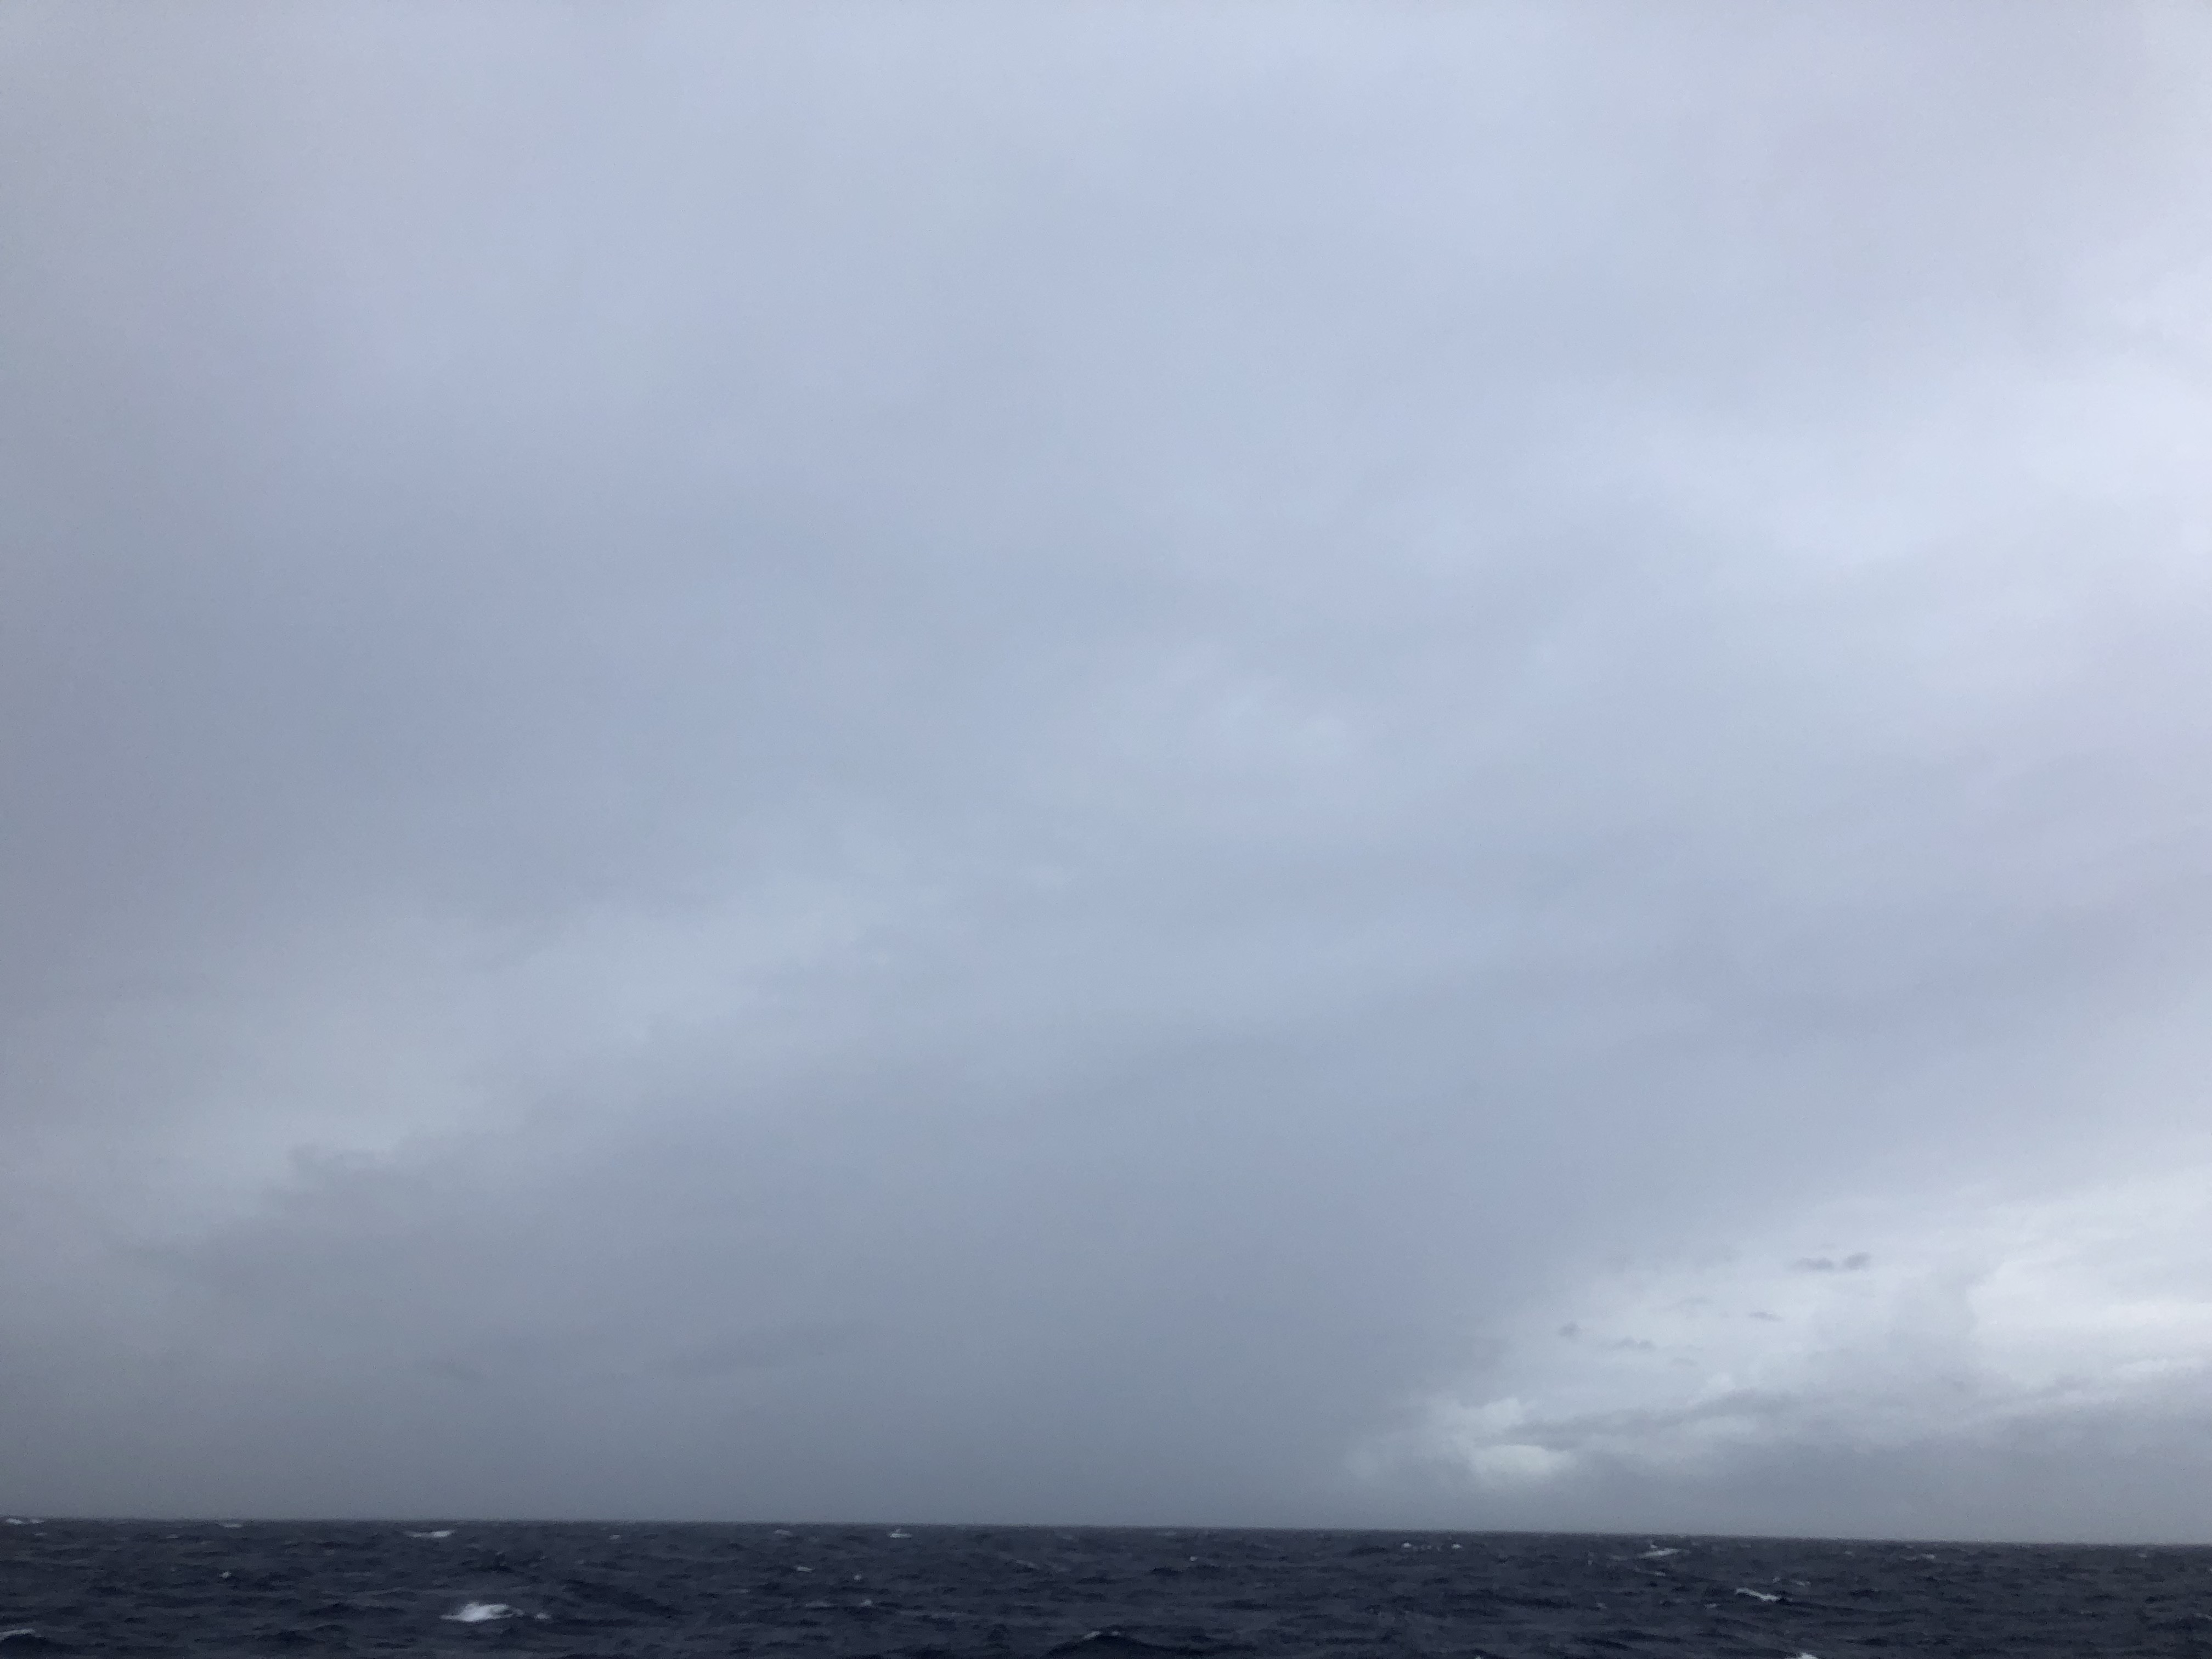
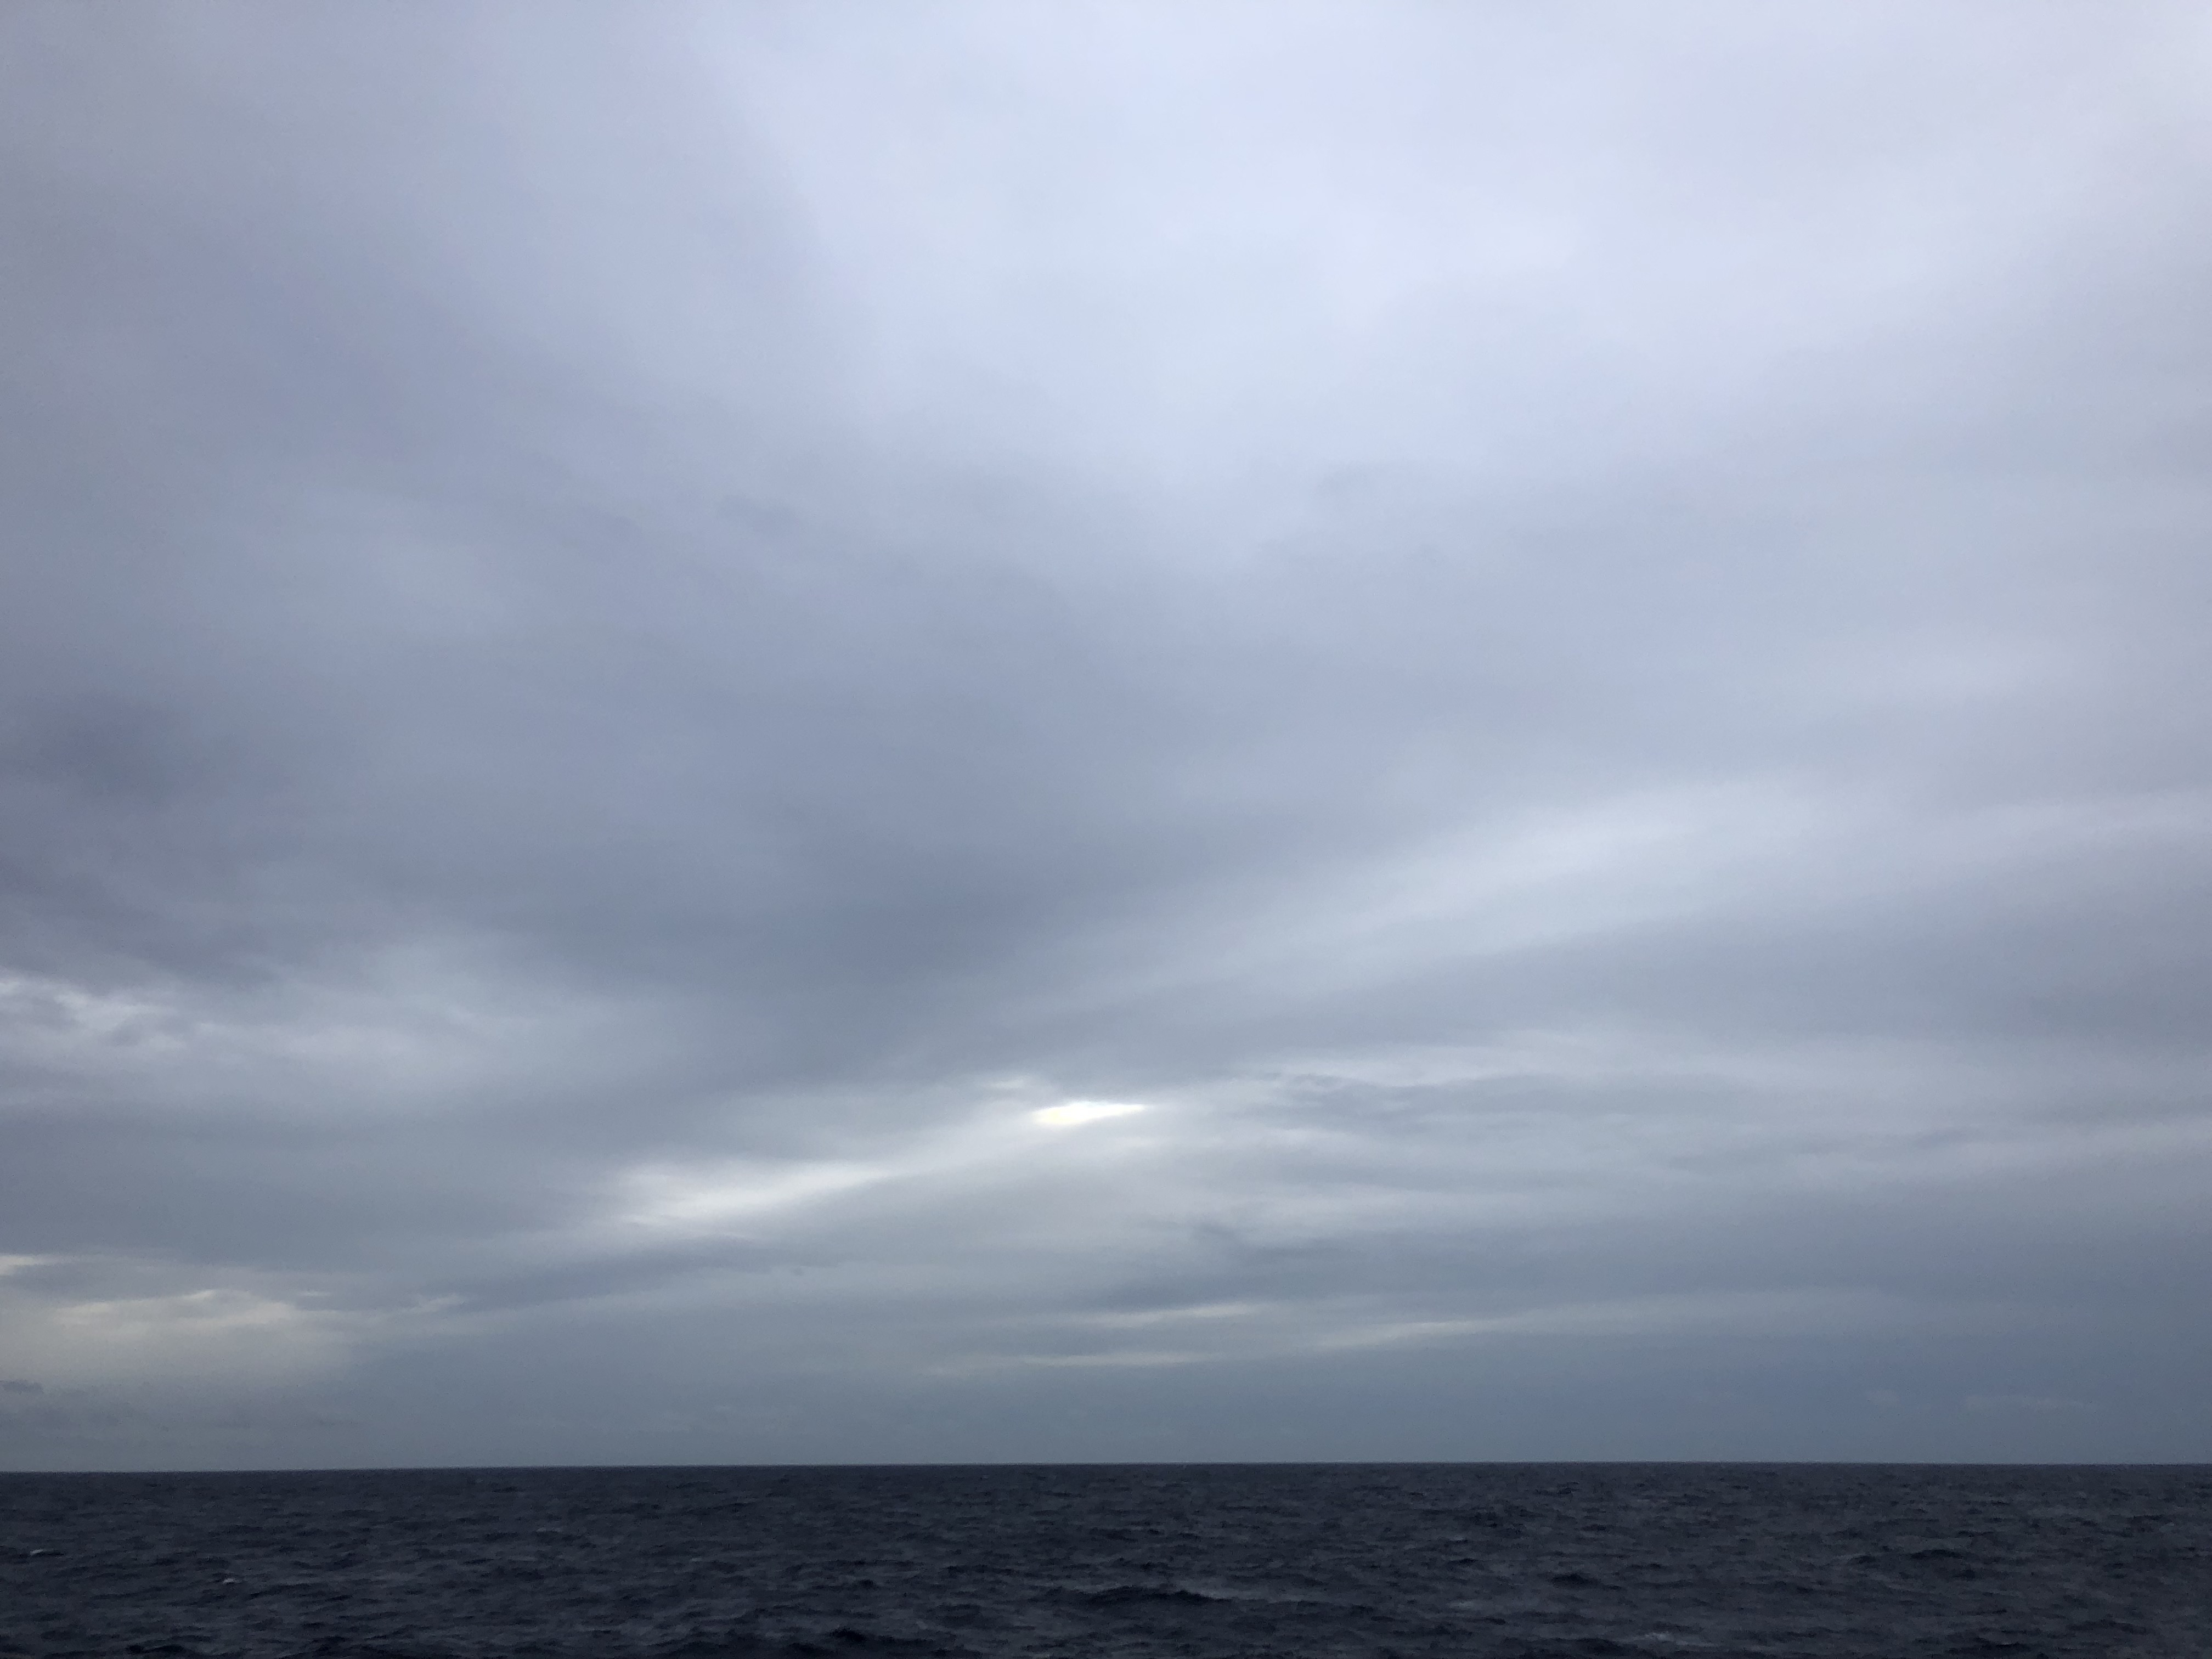
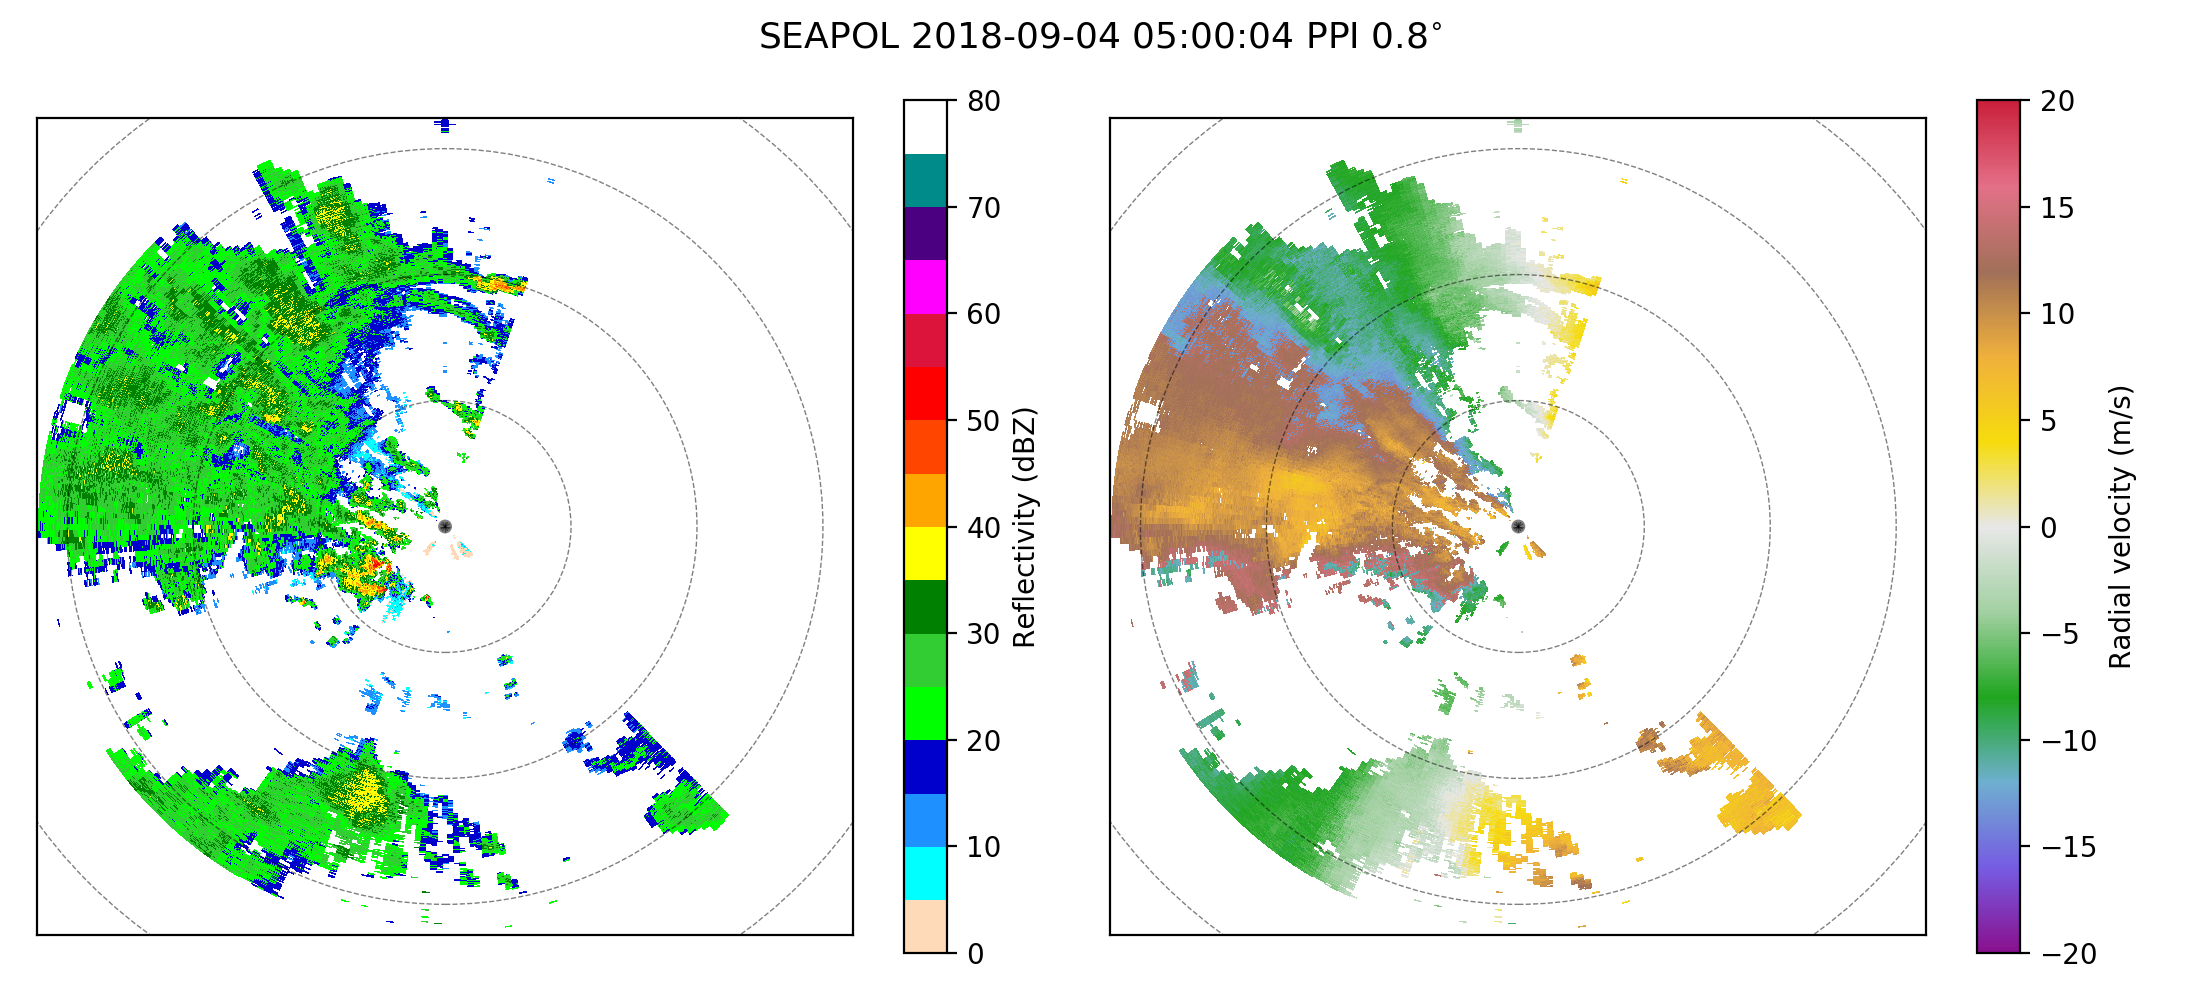
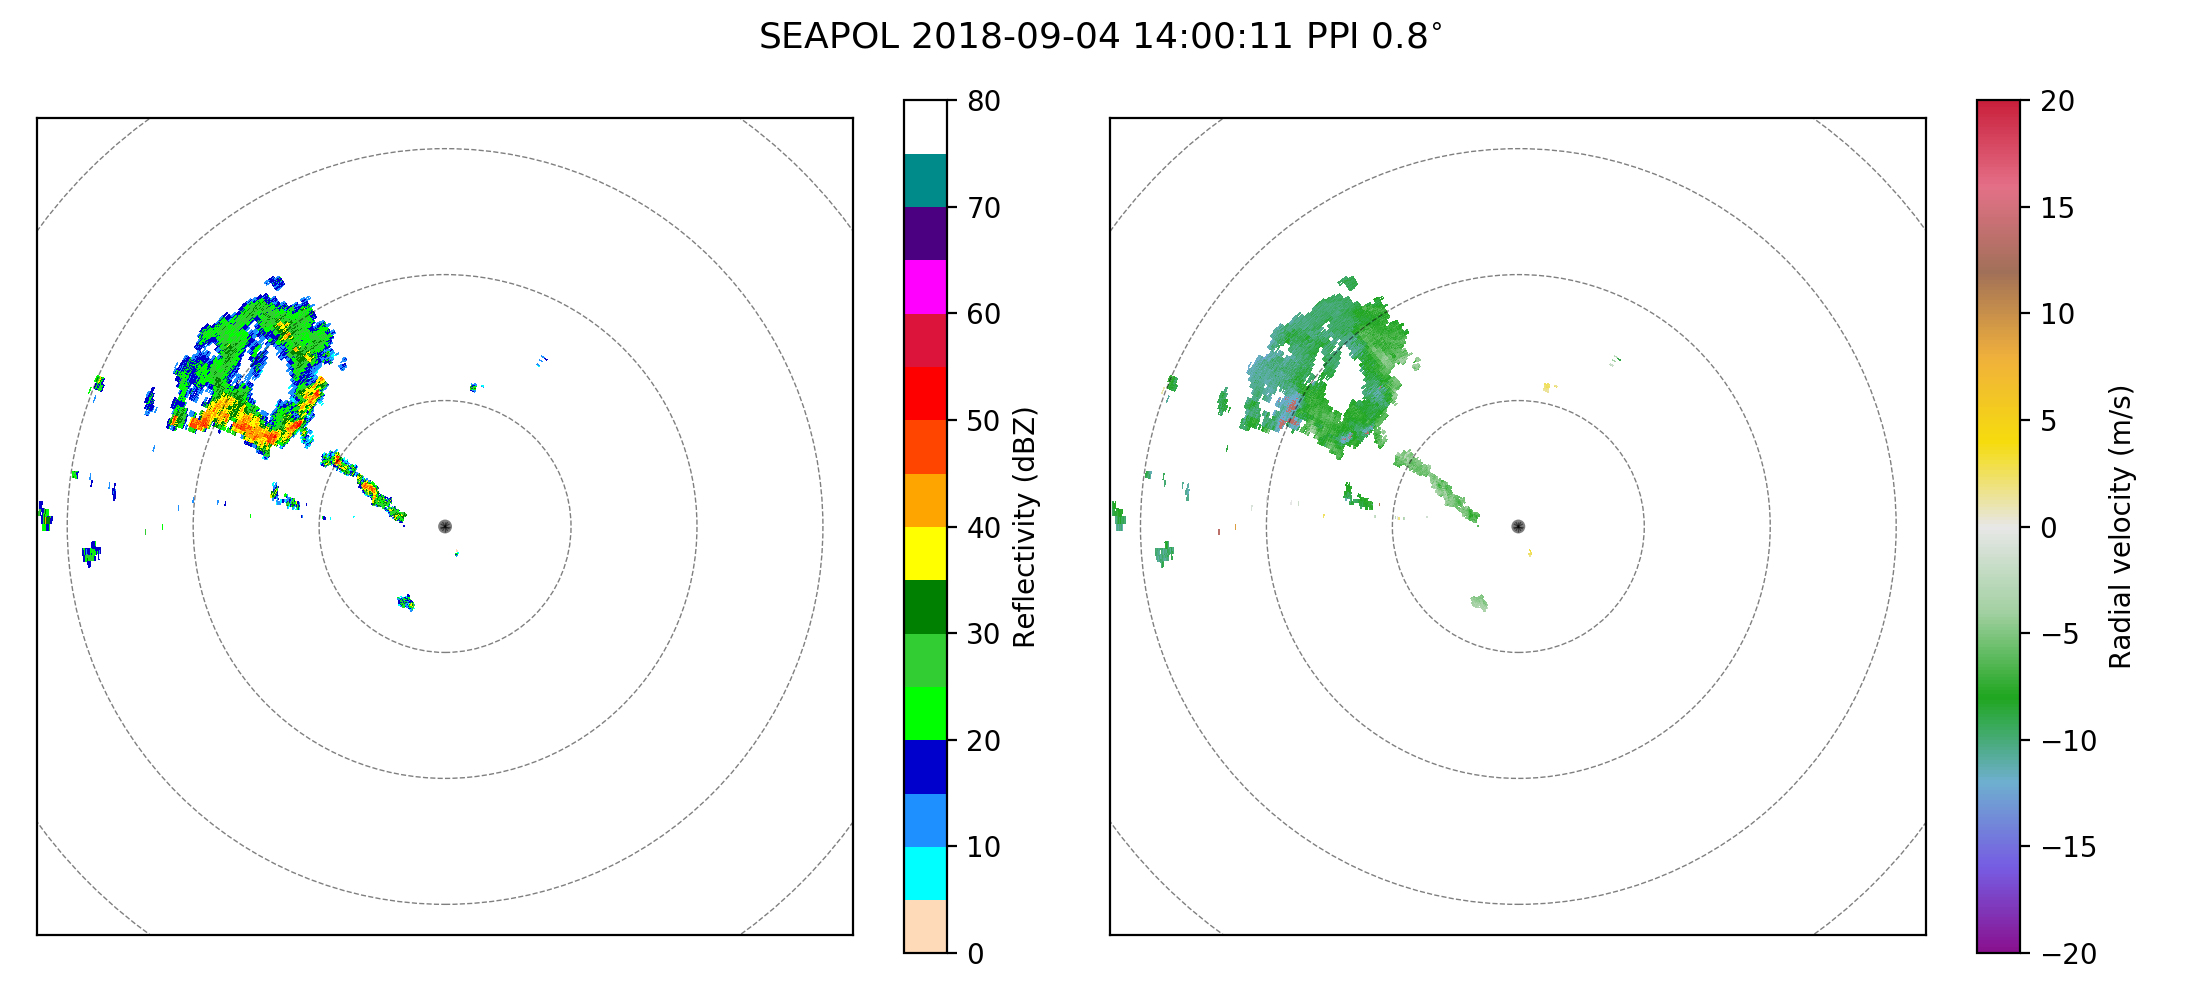
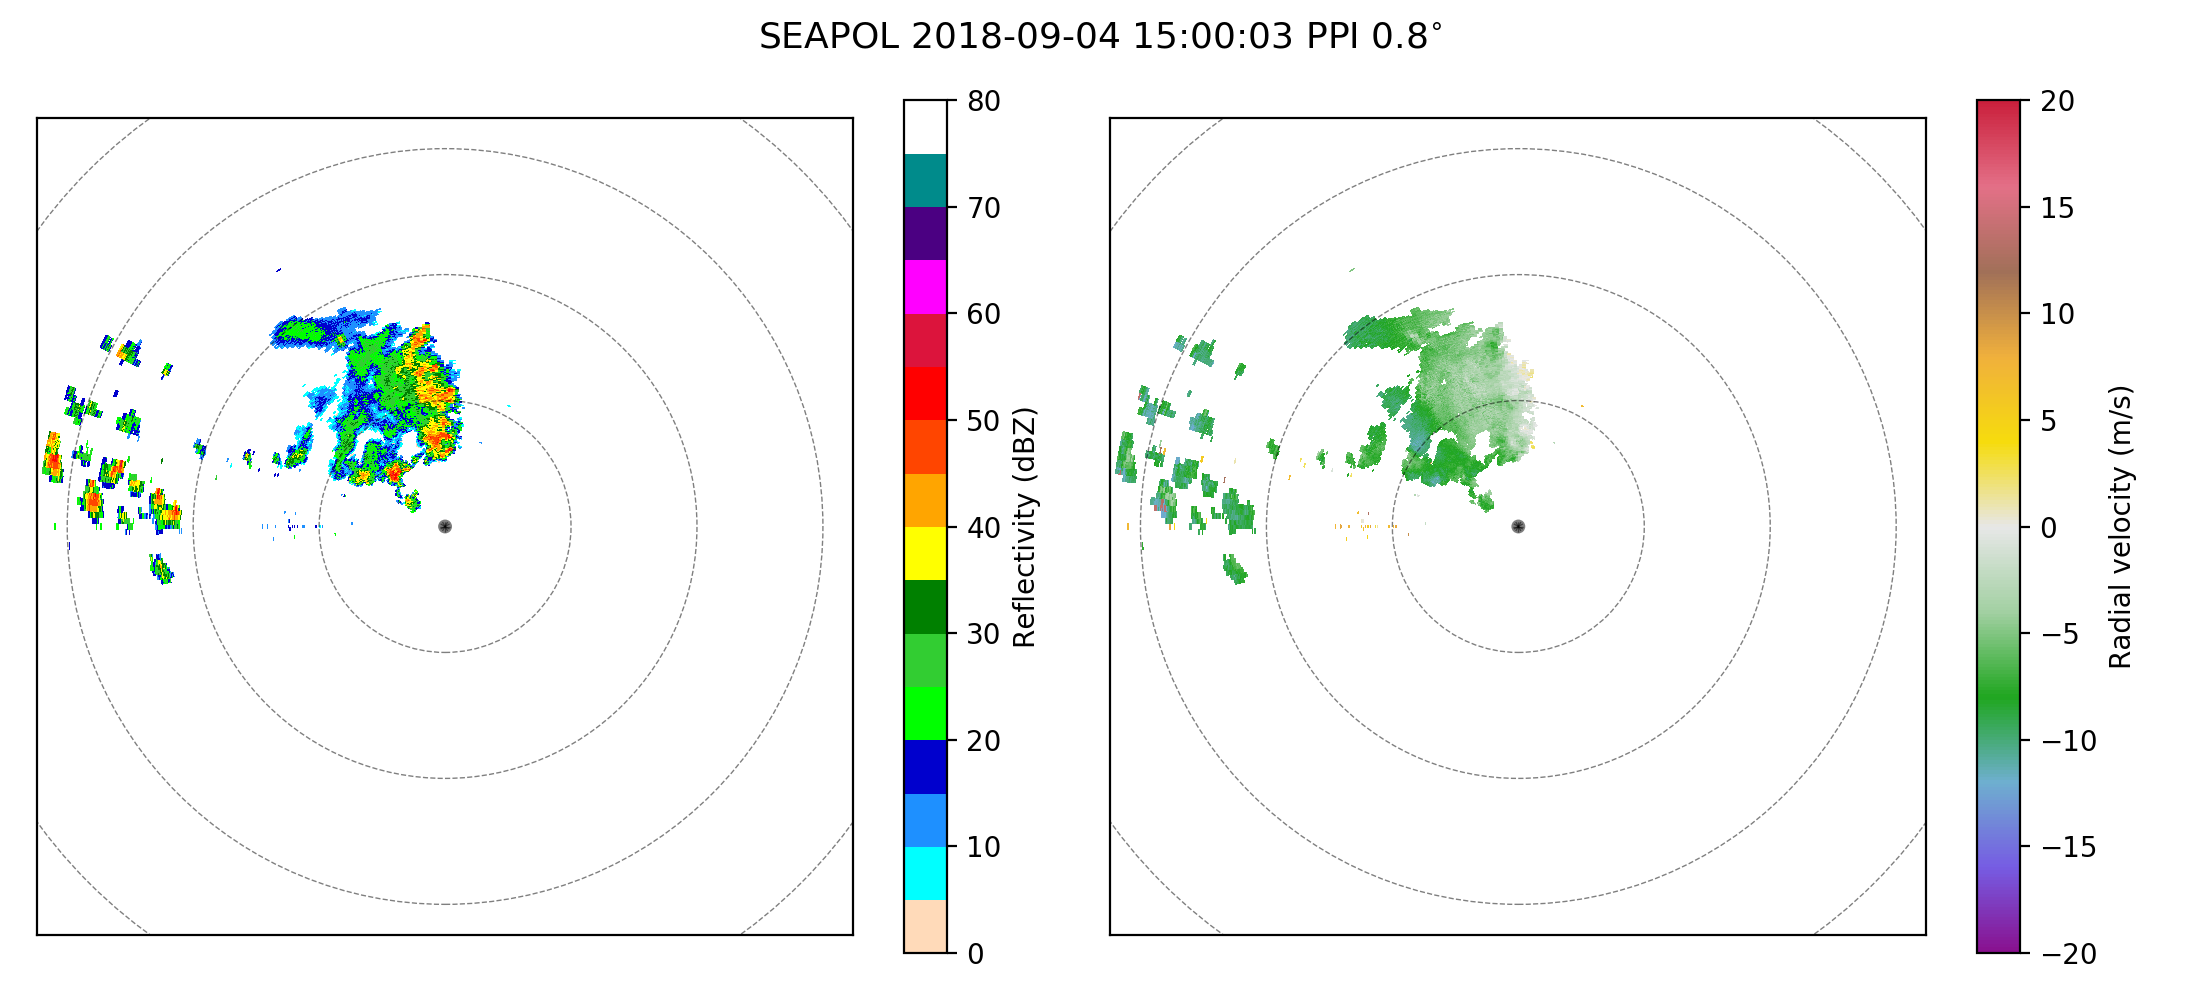
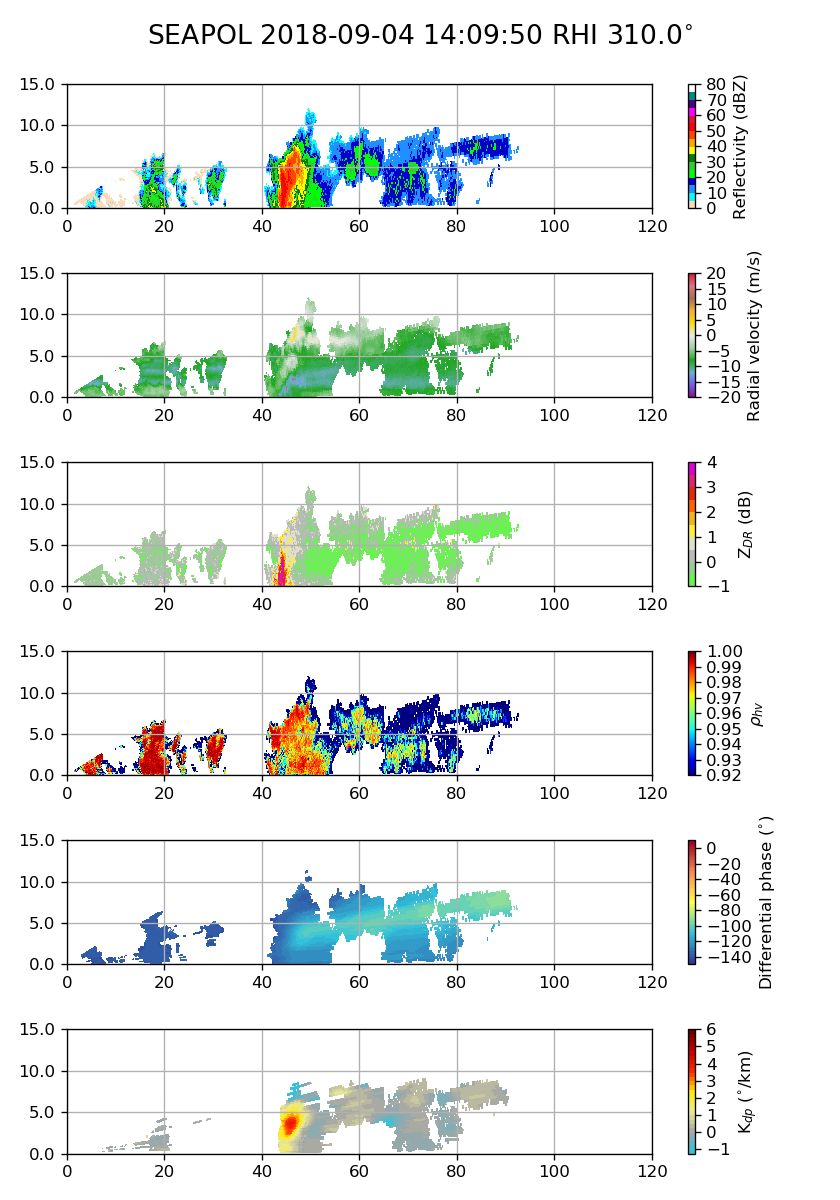
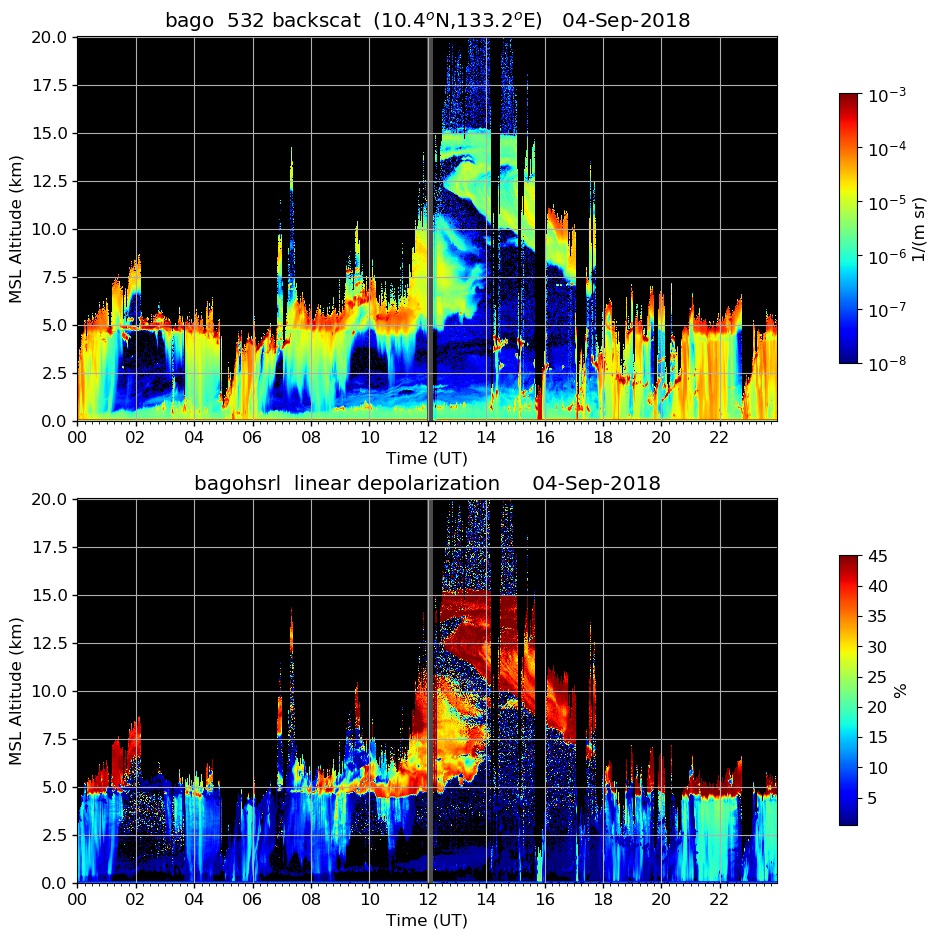
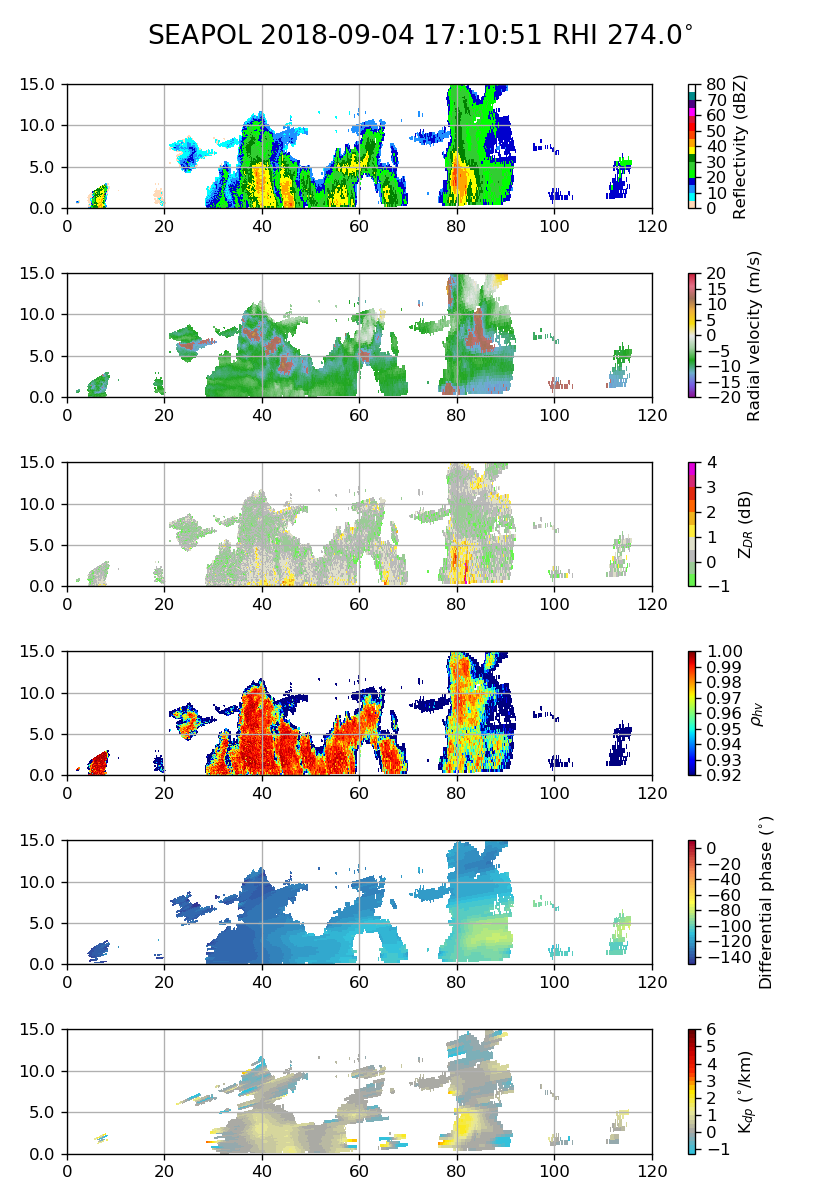
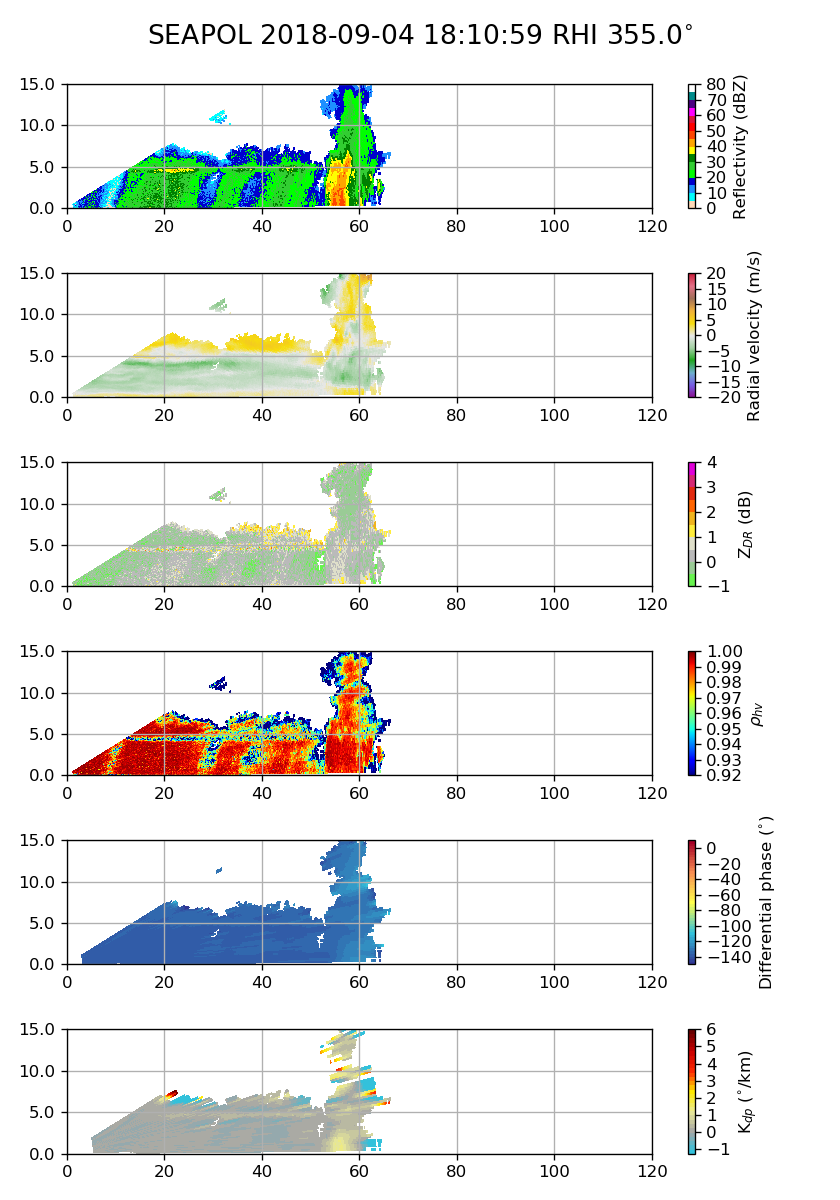
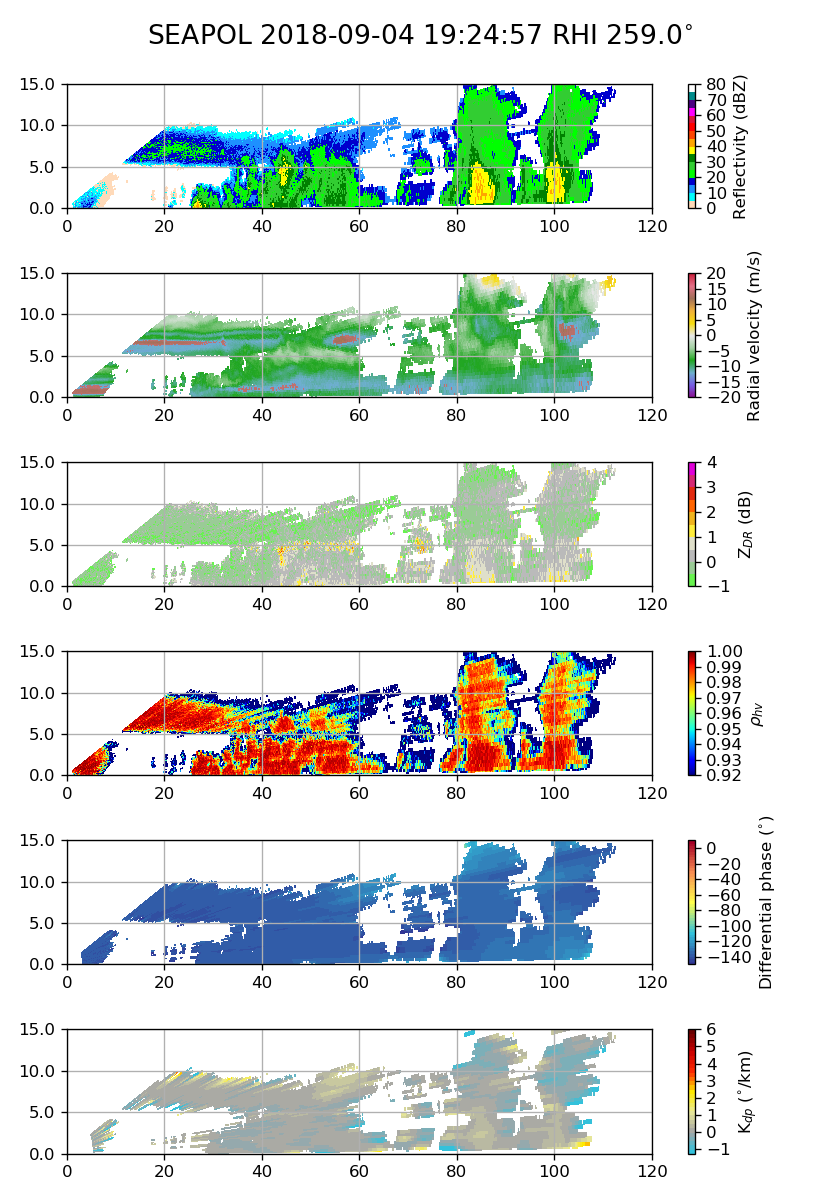
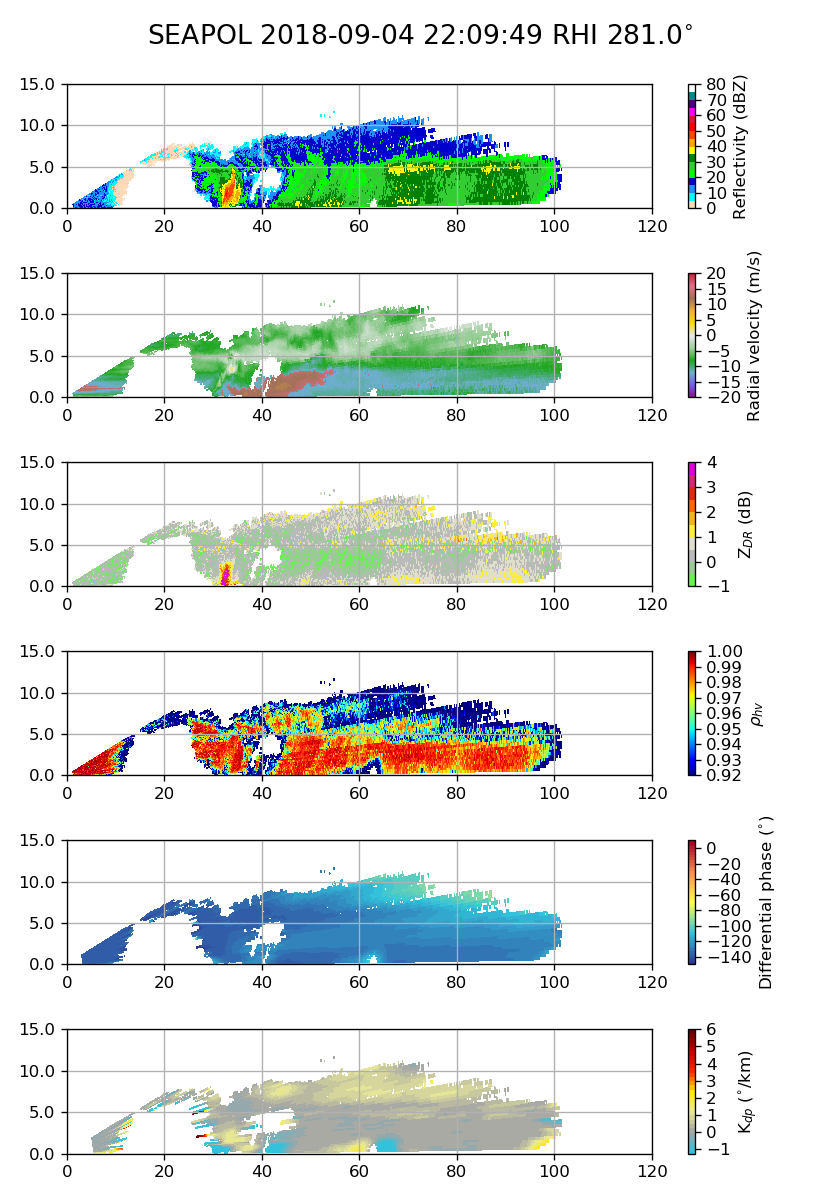
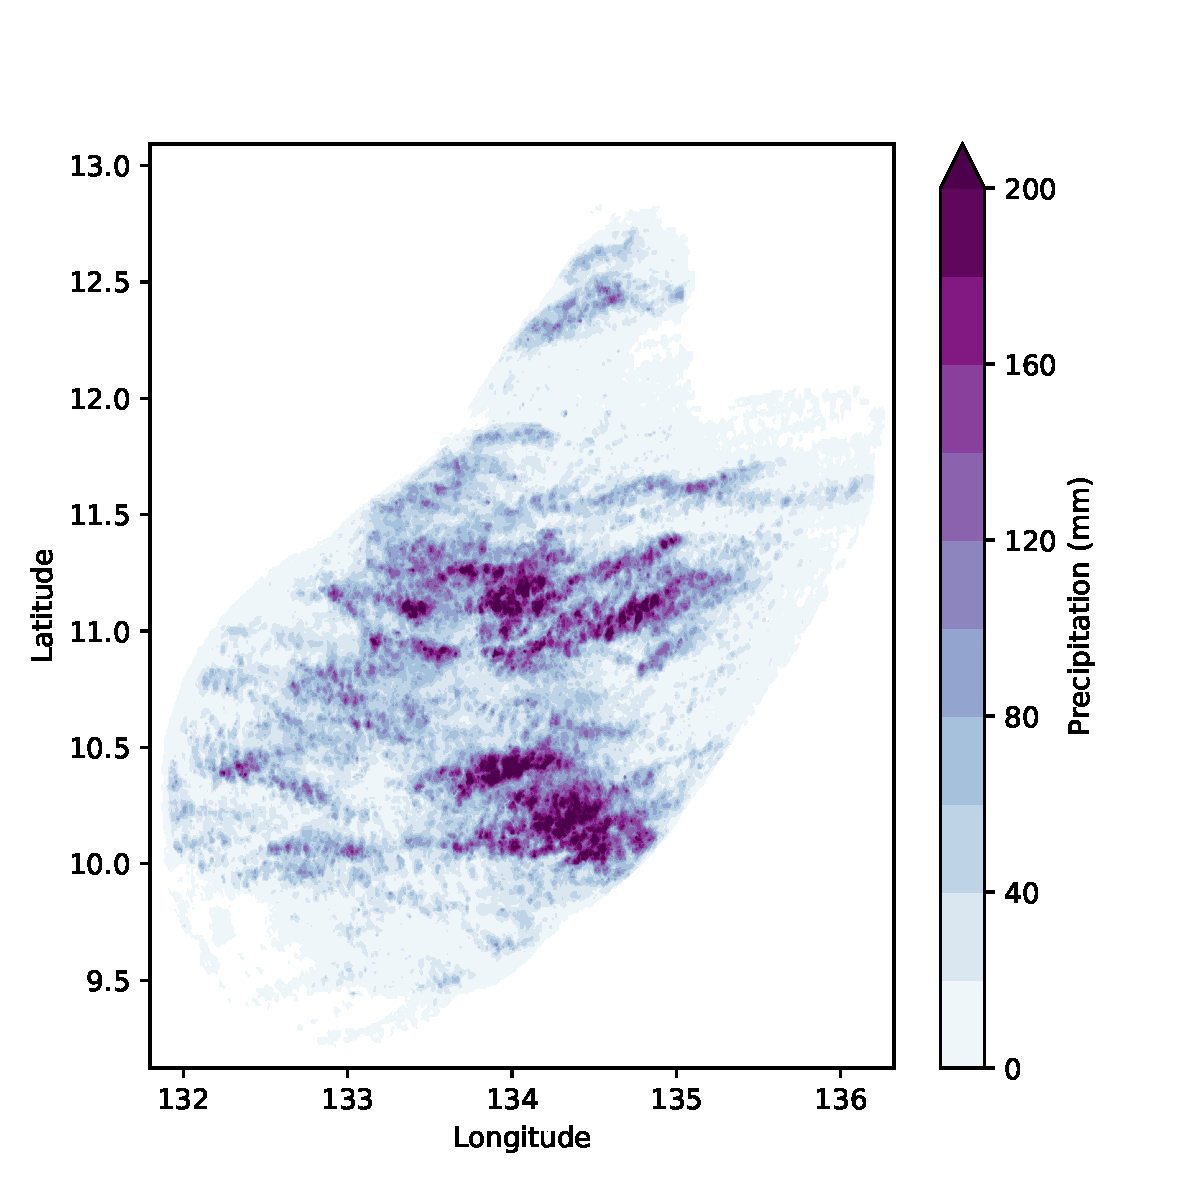
Skies were overcast throughout the day (Figure 6). A low-level stratus deck was present much of the day. Sometimes, the altostratus layer above would become visible. Relatively little sunlight reached the surface. Rain fell somewhere in the SEAPOL domain for most of the day. A break in rain at the ship occurred between 02 and 05 UTC, but echo remained in the SEAPOL domain. More convection--not organized into a discrete line this time--arrived shortly after 05 UTC (Figure 7 and Figure 8). It was accompanied by a gust front and followed by decaying stratiform. Lower-tropospheric mesoscale subsidence was again clear in the 09 UTC sounding (Figure 1). Little echo was observed between 10 and 13 UTC, but an isolated ring of convection--which involved into a short meridionally oriented line of convection moving eastward with a small trailing stratiform area quickly moved north of SEAPOL between 14 and 15 UTC. Convective echoes in this small complex reached 15–16 km. Figure 9 includes low-level scans of this echo object at 14 and 15 UTC as it moved by SEAPOL, and Figure 10 provides and RHI through it when it was organized into a ring. The convective side consisted of apparently young convection with very high ZDR. About 30 km northwest of the convective core, weak stratiform precipitation was present. Between the two, only some weak echo between 3 and 7 km was present, but no precipitation was detected near the surface. Similarly deep convection was observed later both forming from isolated cells or embedded within larger stratiform regions. Rain restarted at the ship around 18 UTC (Figure 11). Perhaps because of the westerlies occurring aloft (Figure 1), a mesoscale circulation, or both, a leading anvil cloud was observed by HSRL prior to the arrival of precipitation as early as 12 UTC (Figure 12). A few cross-sections of the deepest convection are shown in Figure 13, and low-level scan at 2345 UTC reveals intense convection embedded seemingly randomly within a much larger contiguous region of stratiform echo. The total rainfall observed by SEAPOL during 1–4 September is displayed in Figure 14. The radar was blind toward the east or northeast for most of this time period and was moving southwestward; therefore, this plot does not represent the total rain that fell within the domain. Nonetheless, over 200 mm of precipitation were estimated in some locations.